NVIDIA Jetson Orin Nano Super Monitoring
NVIDIA Jetson Orin Nano Super Monitoring (Flux & Grafana 11.x)

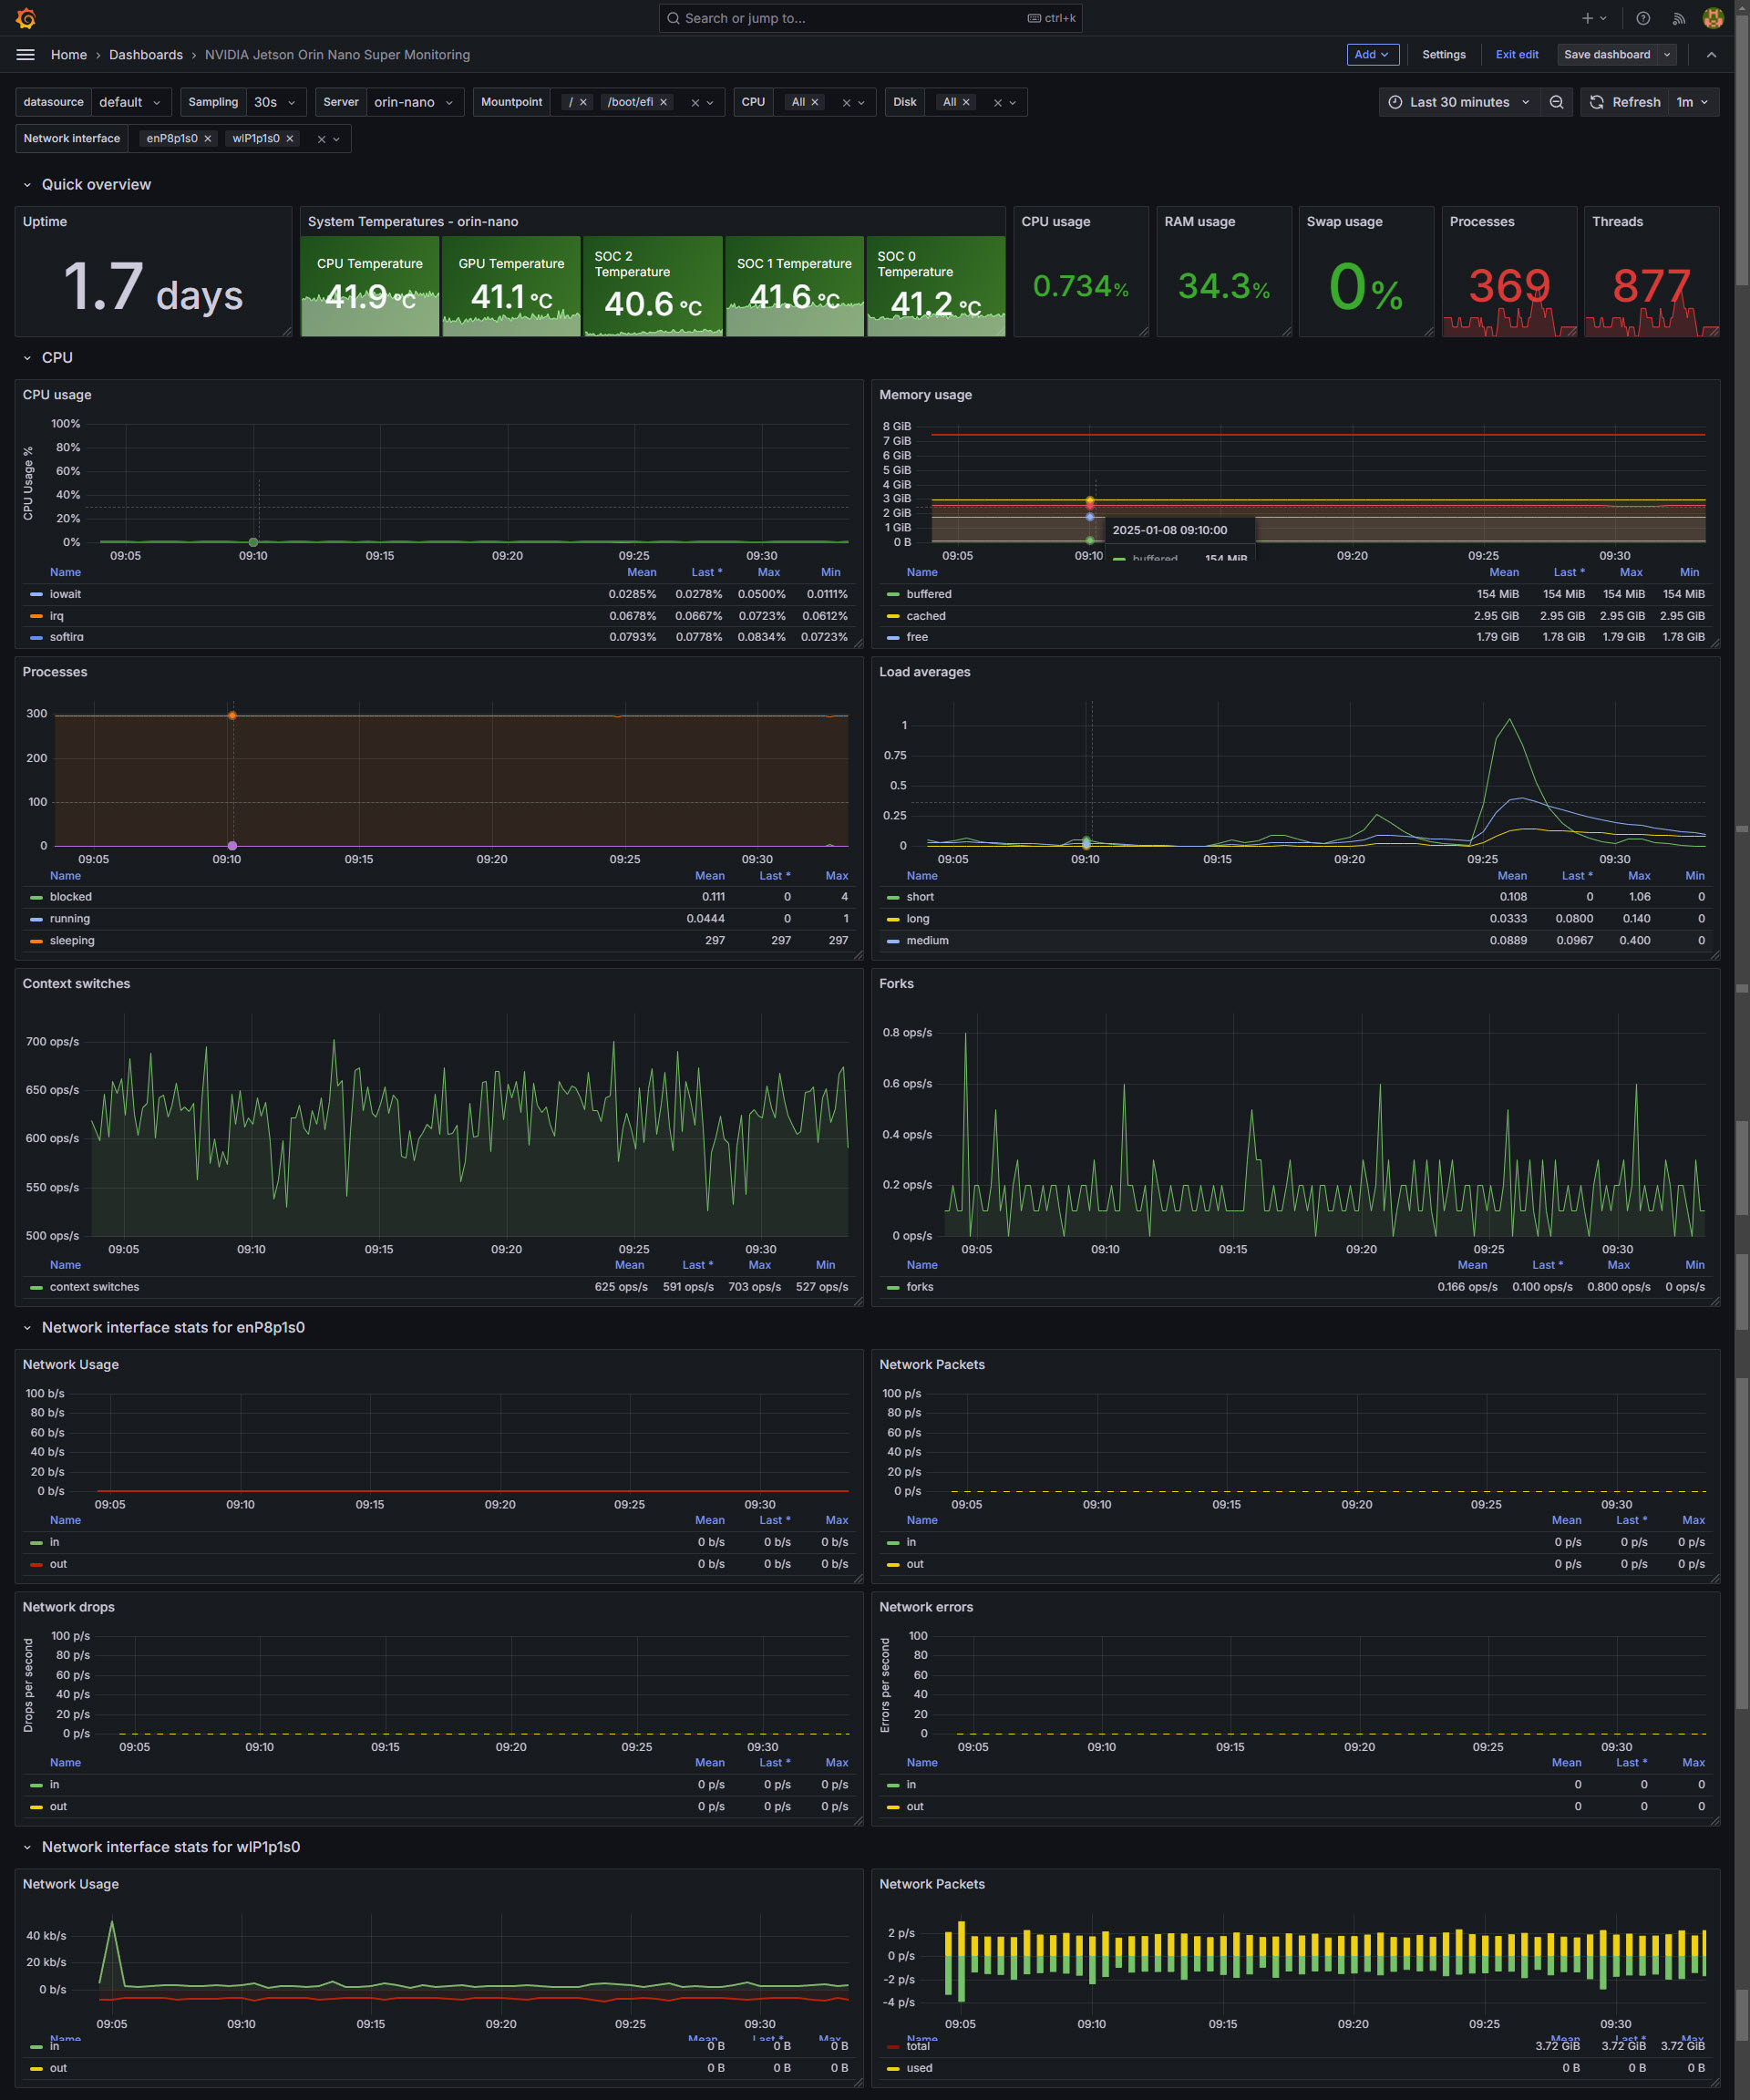
This dashboard contains multiples sections with the goal to monitor a full NVIDIA Jetson Nano Super board or boards, we have some sections to monitor the Linux and machine overall performance, and temperature. Special thanks to Lex Rivera for his Linux System dashboard
Dashboard – Summary
- Quick Overview – On the top bar we can find a quick overview of our NVIDIA Jetson Orin Nano: Uptime, Temperatures of the board, CPU/RAM/Swap usage, and processes and threats.
- Resources consumption – The CPU/RAM consumption plus processes, load, etc. all in historical to detect spikes.
- Network consumption – Truly important historical information with all we need regarding Network consumption and network status, like packets, drops, errors, etc.
- Disk IOPS/Volume Usage – Multiple visualisations about disks and volumes, showing consumption, iops, etc.
Data source config
Collector type:
Collector plugins:
Collector config:
Revisions
Upload an updated version of an exported dashboard.json file from Grafana
| Revision | Description | Created | |
|---|---|---|---|
| Download |