Kaspersky Security Center Prometheus Metrics Dashboard
A Grafana dashboard to monitor Kaspersky Security Center metrics exported via Prometheus on port 13296. Provides real-time insights into server health, performance, and security operations.
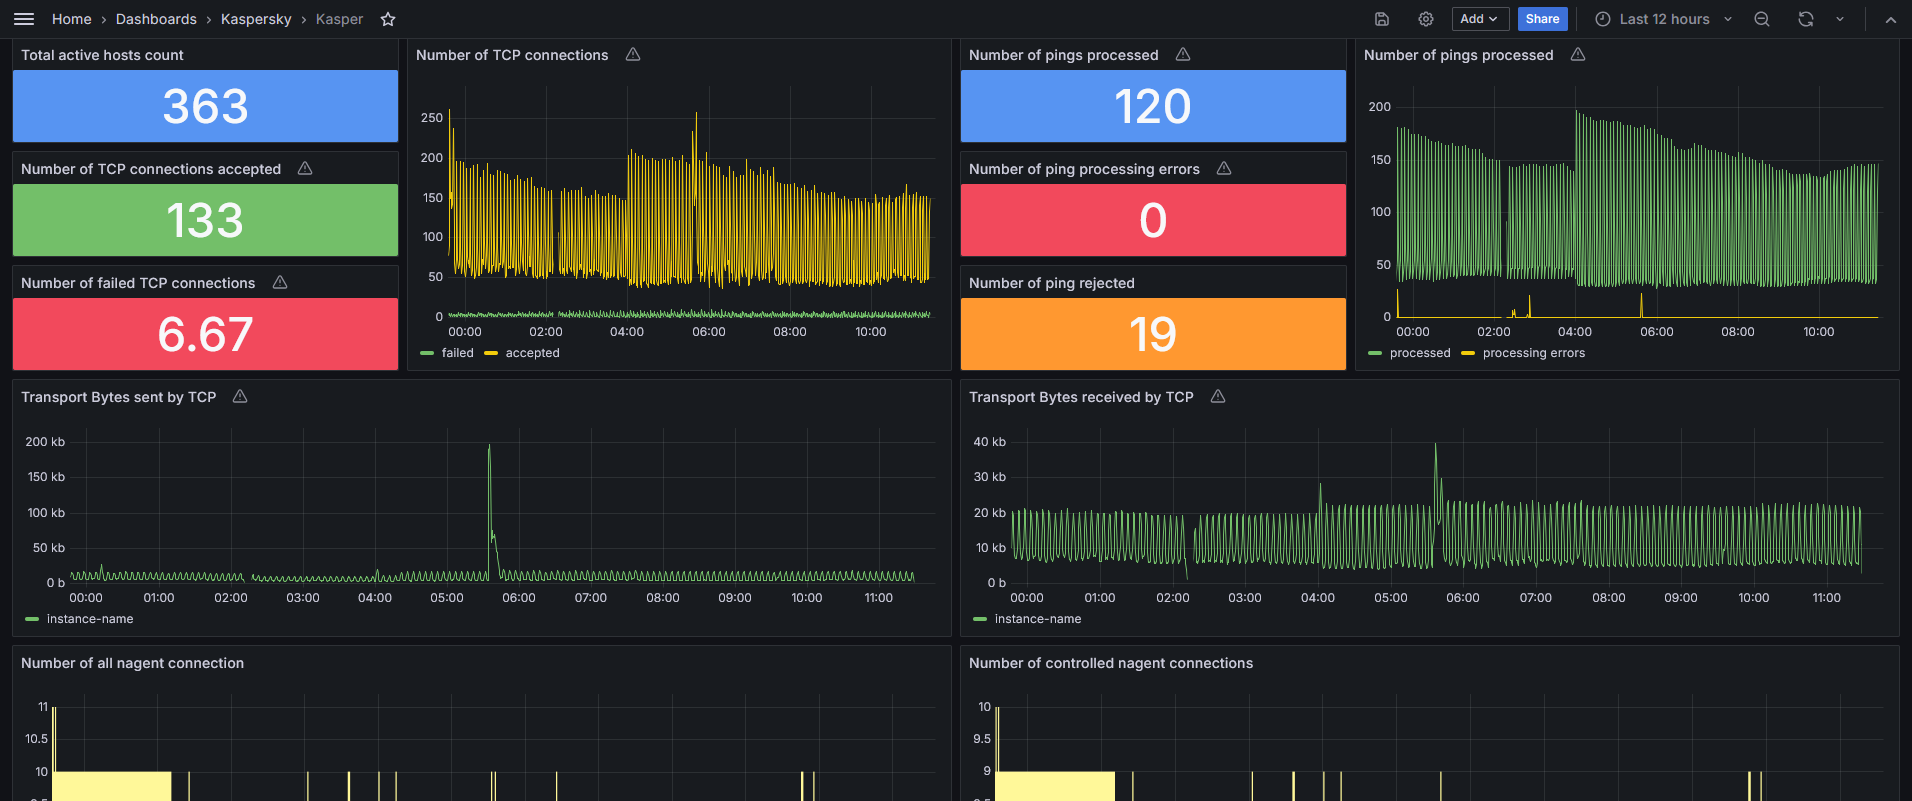
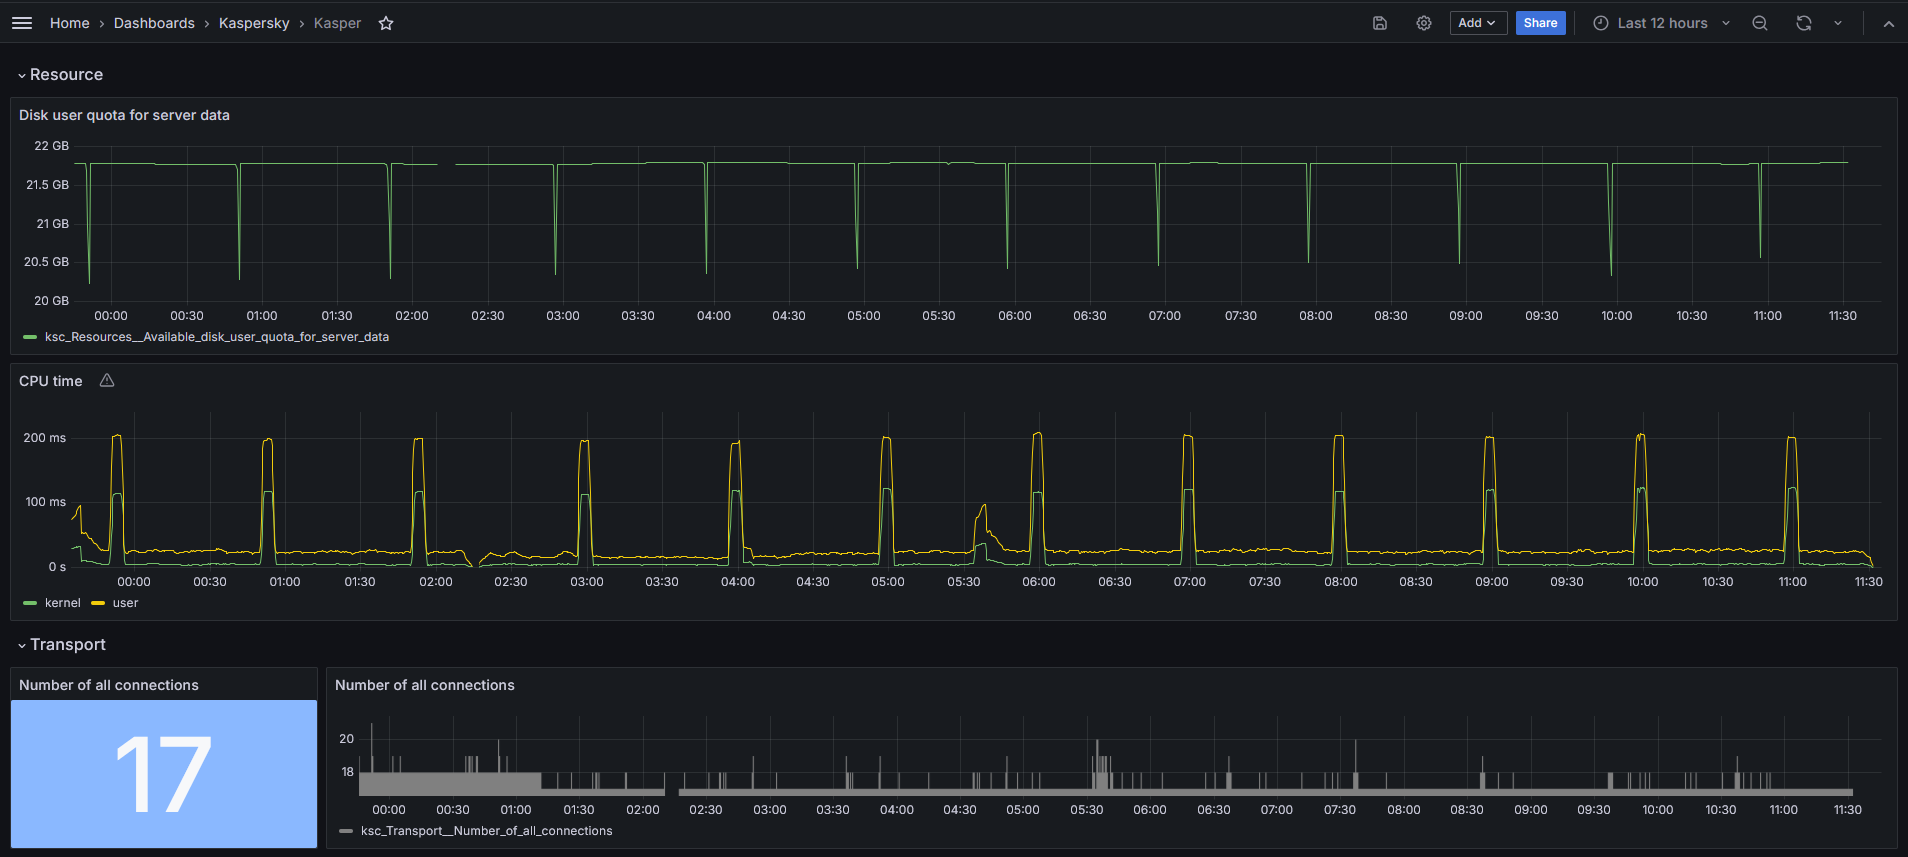
Kaspersky Security Center Prometheus Metrics Dashboard
This dashboard is designed to visualize metrics exported from Kaspersky Security Center for Prometheus. The metrics are accessible at https://<server_address>:13296/metrics, where <server_address> is the IP address or domain of your Kaspersky Administration Server.
Data source config
Collector type:
Collector plugins:
Collector config:
Revisions
Upload an updated version of an exported dashboard.json file from Grafana
| Revision | Description | Created | |
|---|---|---|---|
| Download |
Metrics Endpoint (Prometheus)
Easily monitor any Prometheus-compatible and publicly accessible metrics URL with Grafana Cloud's out-of-the-box monitoring solution.
Learn more