Express.js Node Application Application Performance Dashboard
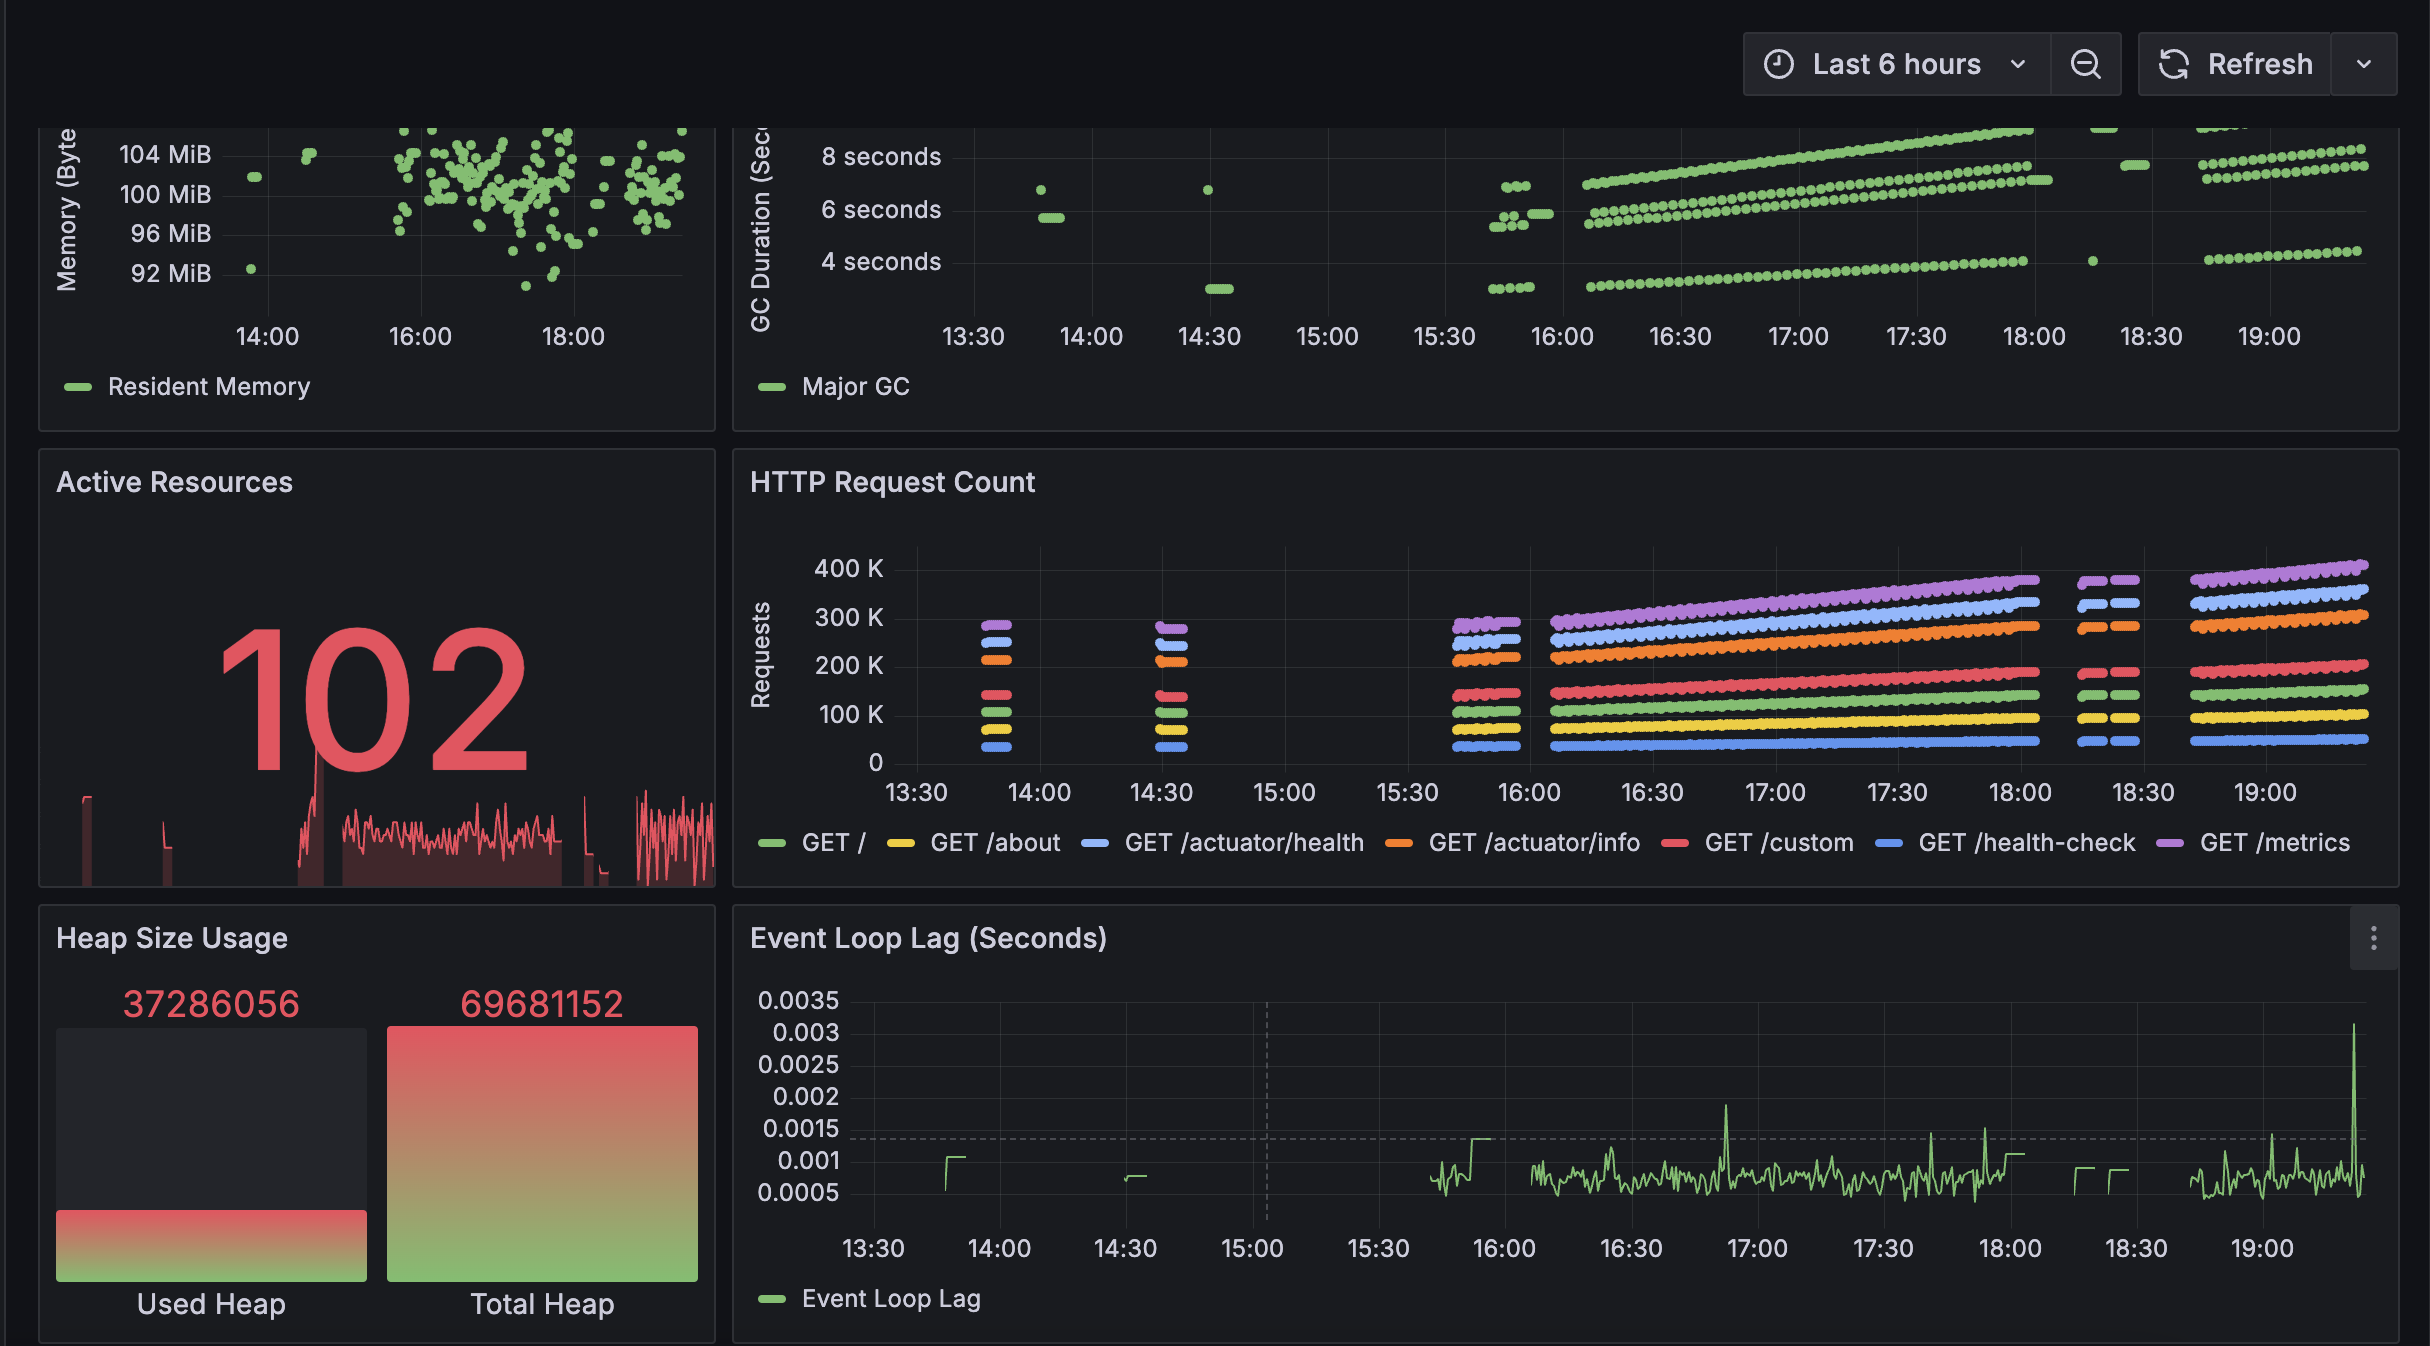
Grafana Dashboard for Node.js Express App with Prometheus Metrics This guide explains how to integrate Prometheus monitoring into a Node.js Express application using the prom-client library and visualize the collected metrics in Grafana. The solution leverages the express-prom-bundle middleware to expose key Prometheus metrics such as request duration, uptime, and more. Grafana Dashboard To visualize the Prometheus metrics, Grafana is used to create dashboards that display the following: Request Latency: Visualize HTTP request latency over time, helping you understand performance. Application Health: Track the health of the application by monitoring the up metric. Request Status Breakdown: View the breakdown of HTTP requests by status code, method, and path to identify potential bottlenecks or issues in the server's routing. With this integration, you can easily monitor the health and performance of your Node.js Express application in a Grafana dashboard, powered by Prometheus as the data source.
Grafana Dashboard for Node.js Express App with Prometheus Metrics
This project demonstrates how to integrate Prometheus monitoring into a Node.js Express application using the prom-client library and how to visualize the collected metrics using Grafana. It leverages the express-prom-bundle middleware to expose essential Prometheus metrics, which can be scraped by a Prometheus server for further visualization.
Table of Contents
Overview
This project uses the express-prom-bundle middleware, which integrates seamlessly with the prom-client library for Node.js. It exposes metrics for monitoring the performance of your Express.js server, including request duration, uptime, and more.
Metrics Supported
- up: Indicates the health of the application (1 if the server is running, 0 if down).
- http_request_duration_seconds: Measures HTTP request latencies, categorized by status code, HTTP method, and path.
This data is then scraped by a Prometheus server and visualized in a Grafana dashboard for better observability.
Installation
Prerequisites
Before using this solution, ensure you have:
- Node.js (v14+ recommended)
- Prometheus running to scrape the metrics
- Grafana running for dashboard visualization
Steps
Follow Steps here: node-app-observability
You can import the provided dashboard JSON file into Grafana by following these steps:
- Open Grafana and navigate to Create > Import.
- Upload the dashboard JSON file or use the provided ID to import it from the Grafana community dashboard.
- Once the dashboard is imported, configure the Prometheus data source and start exploring the metrics.
Metrics Explained
up
- Description: A metric that indicates whether your application is running. It returns a value of
1when your application is up and0when it is down. - Labels: None
- Example:
up{job="nodejs-app"} 1
http_request_duration_seconds
- Description: A histogram metric that measures the duration of HTTP requests.
- Labels:
status_code: The HTTP status code of the response.method: The HTTP method (e.g., GET, POST).path: The route path (e.g.,/,/api/data).
- Example:
http_request_duration_seconds_bucket{status_code="200",method="GET",path="/"} 0.005
http_request_duration_seconds_count{status_code="200",method="GET",path="/"} 100
http_request_duration_seconds_sum{status_code="200",method="GET",path="/"} 5
Licenses
This project is licensed under the MIT License. Please refer to the individual libraries used in the project for their respective licenses:
By following the above steps, you will be able to monitor and visualize key metrics for your Node.js Express application with Prometheus and Grafana!
Data source config
Collector config:
Upload an updated version of an exported dashboard.json file from Grafana
| Revision | Description | Created | |
|---|---|---|---|
| Download |
Linux Server
Monitor Linux with Grafana. Easily monitor your Linux deployment with Grafana Cloud's out-of-the-box monitoring solution.
Learn more