nvitop-dashboard
Grafana Dashboard built by `nvitop-exporter`.
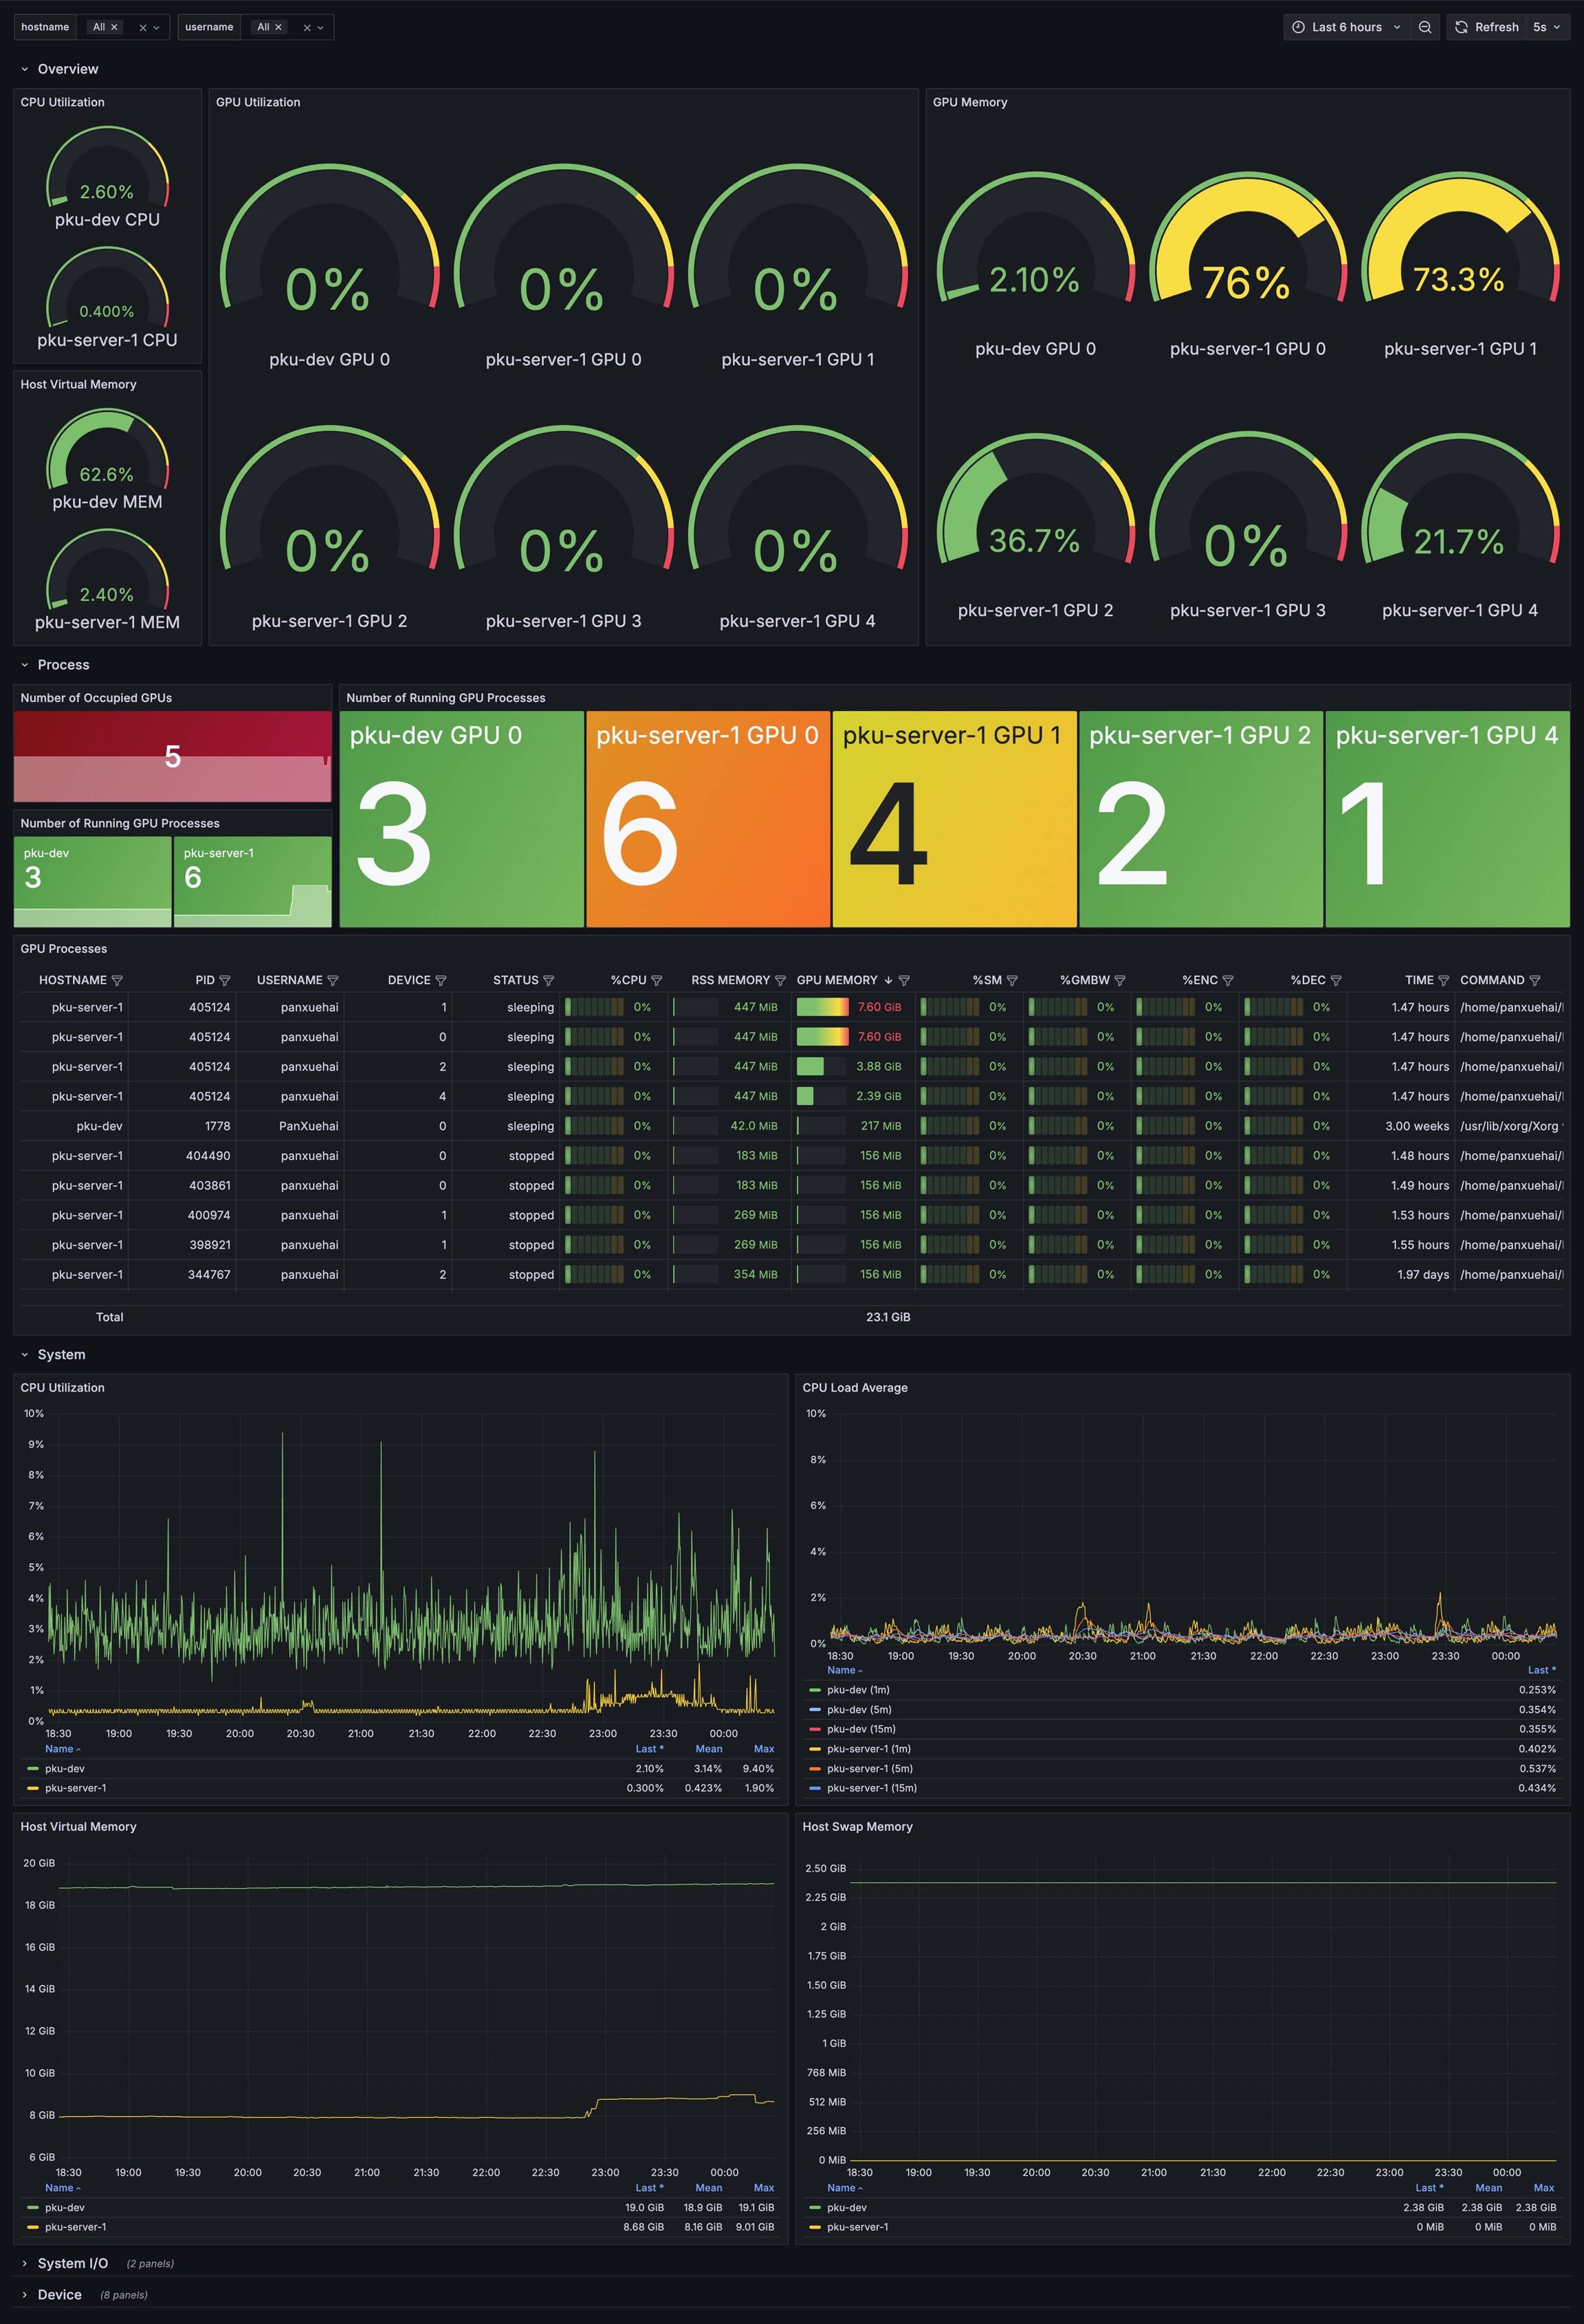
Grafana Dashboard built by nvitop-exporter.
Quickstart
Start the exporter with the following command:
pipx run nvitop-exporter --bind-address 0.0.0.0 --port 5050
# or
uvx nvitop-exporter --bind-address 0.0.0.0 --port 5050
Then you can access the metrics at http://localhost:5050/metrics.
You will need to configure Prometheus to scrape the metrics from the exporter.
scrape_configs:
  - job_name: 'nvitop-exporter'
    static_configs:
      - targets: ['localhost:5050']
Data source config
Collector type:
Collector plugins:
Collector config:
Revisions
Upload an updated version of an exported dashboard.json file from Grafana
| Revision | Description | Created | |
|---|---|---|---|
| Download |