MSK Dashboard
Prometheus (thanos) monitoring for MSK cluster
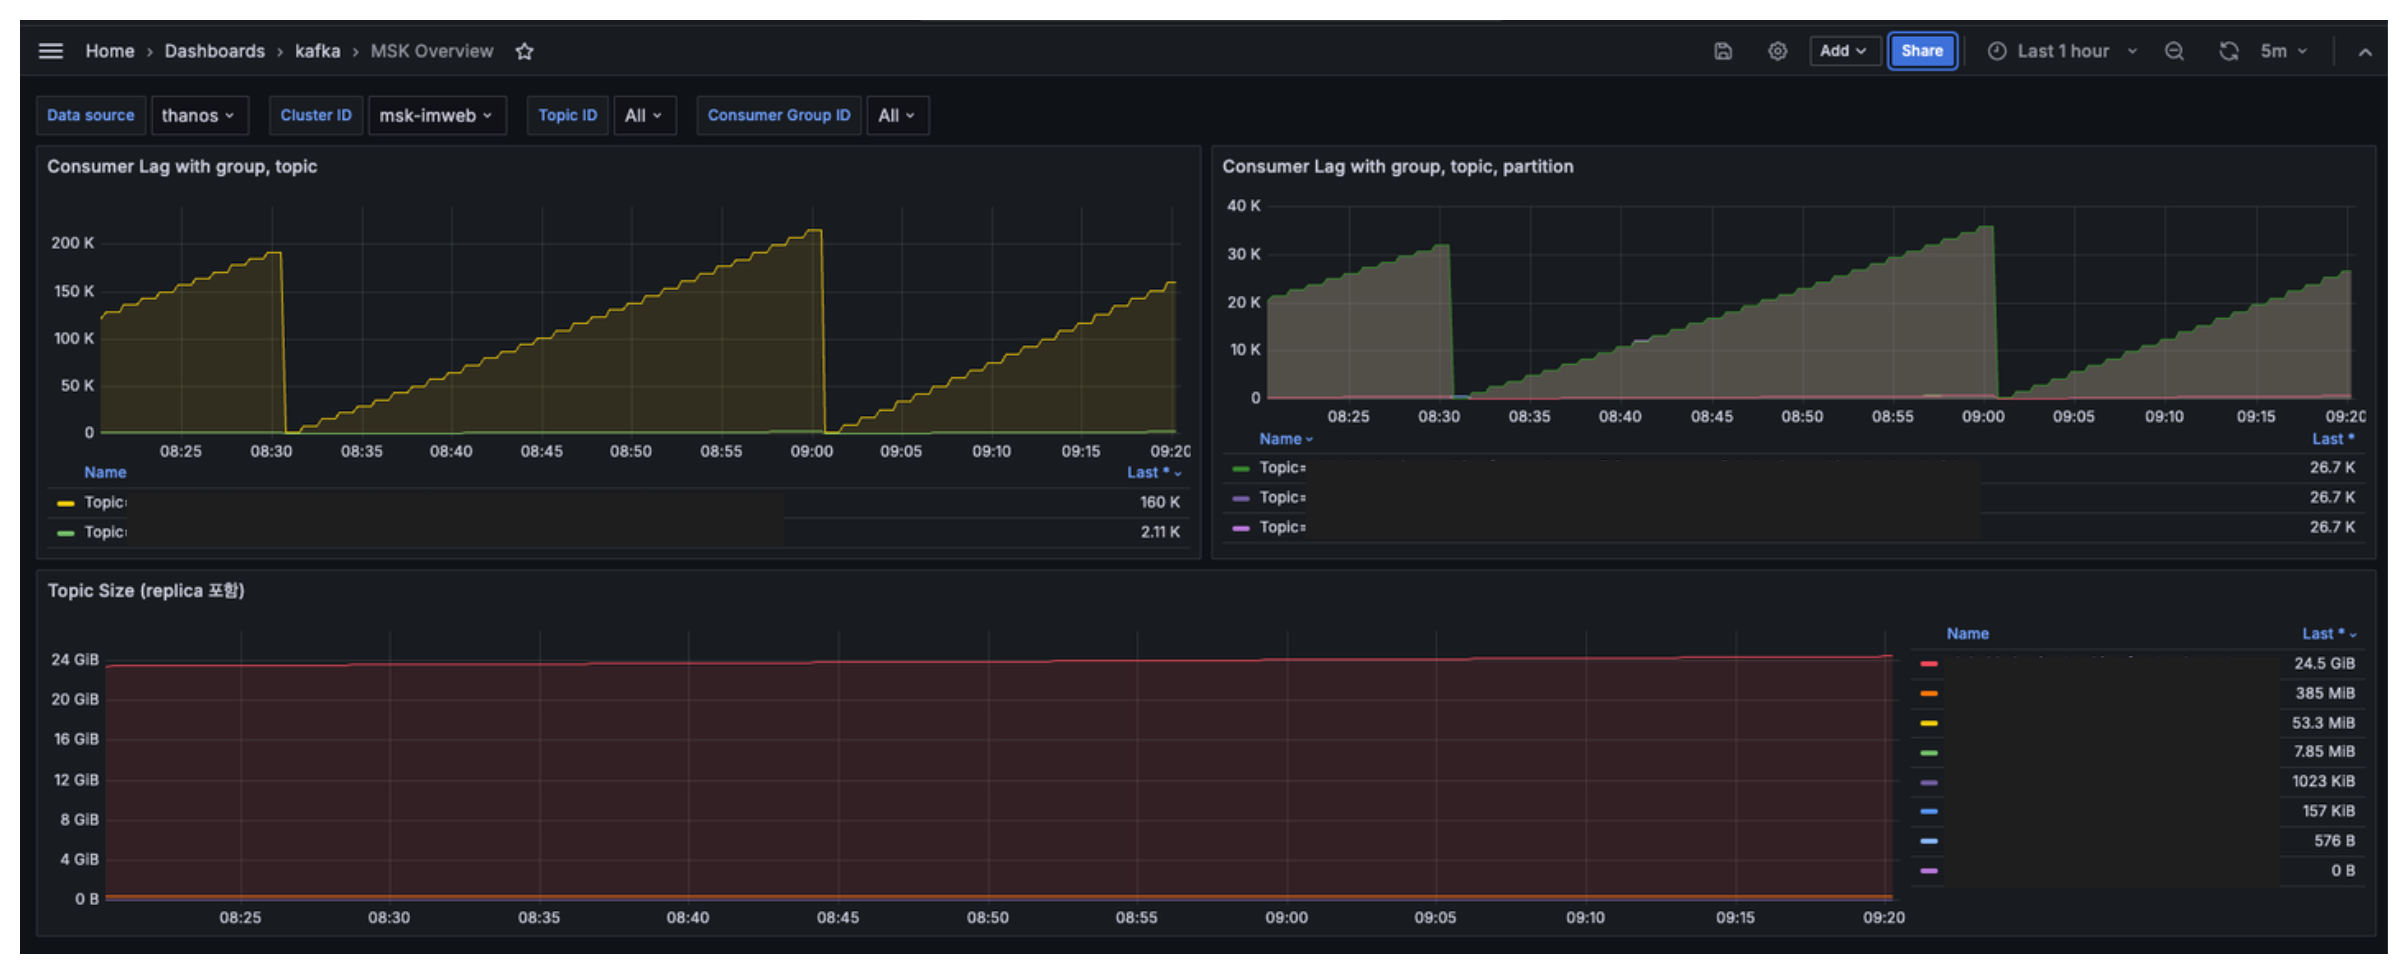
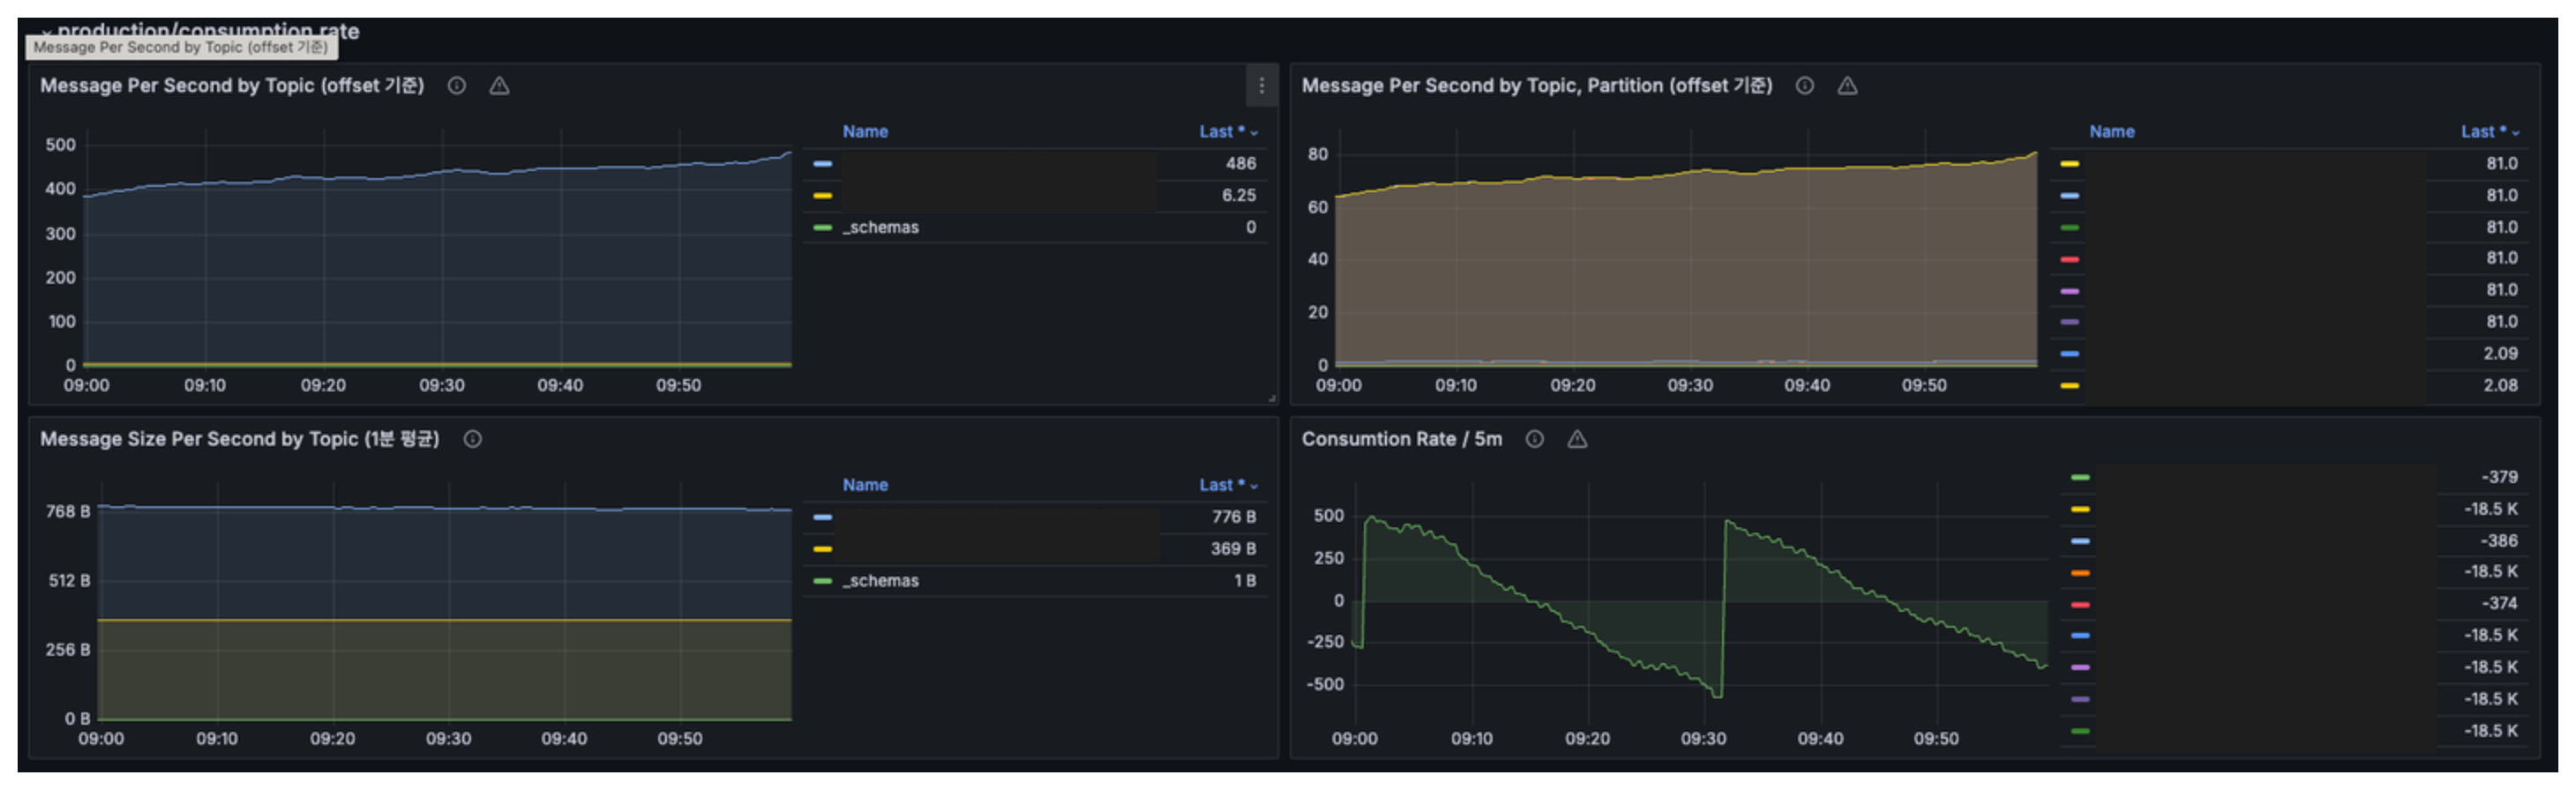
The MSK Overview dashboard uses the prometheus data source to create a Grafana dashboard with the graph panel.
Based on metrics collected by activating msk prometheus exporter (https://docs.aws.amazon.com/ko_kr/msk/latest/developerguide/open-monitoring.html)
Filtering possible by msk cluster, topic, and consumer group
Data source config
Collector type:
Collector plugins:
Collector config:
Revisions
Upload an updated version of an exported dashboard.json file from Grafana
| Revision | Description | Created | |
|---|---|---|---|
| Download |