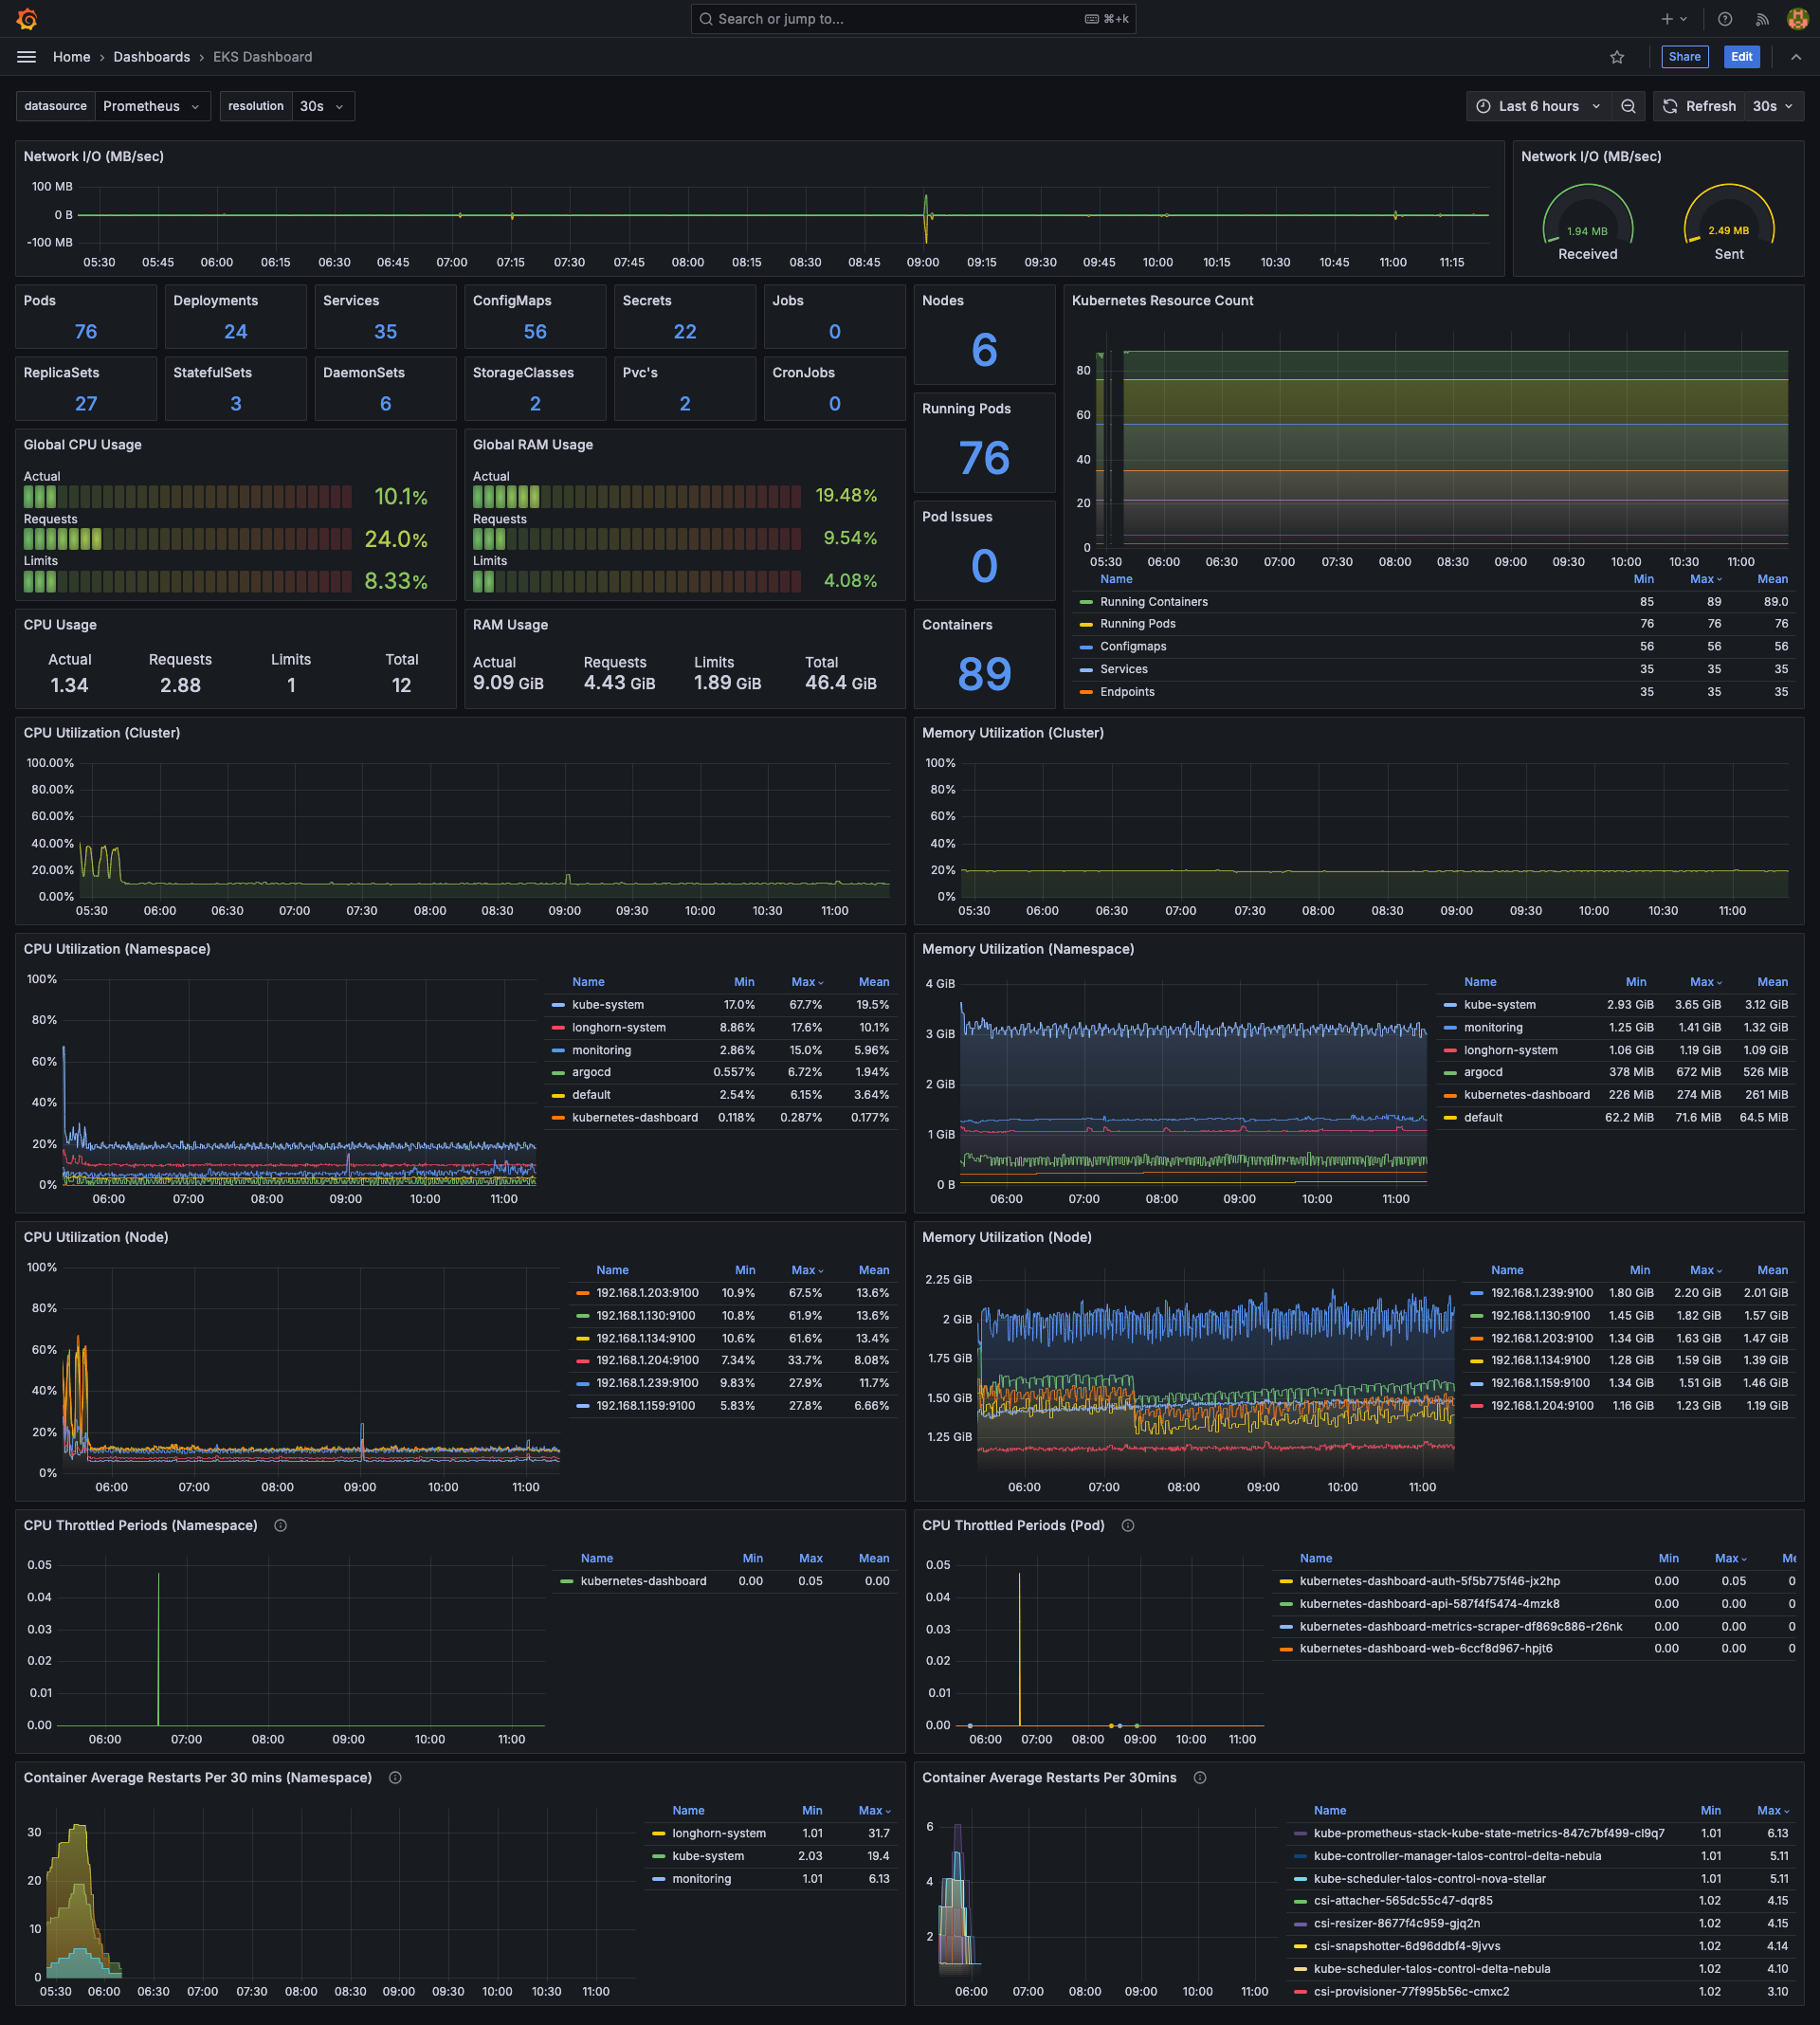
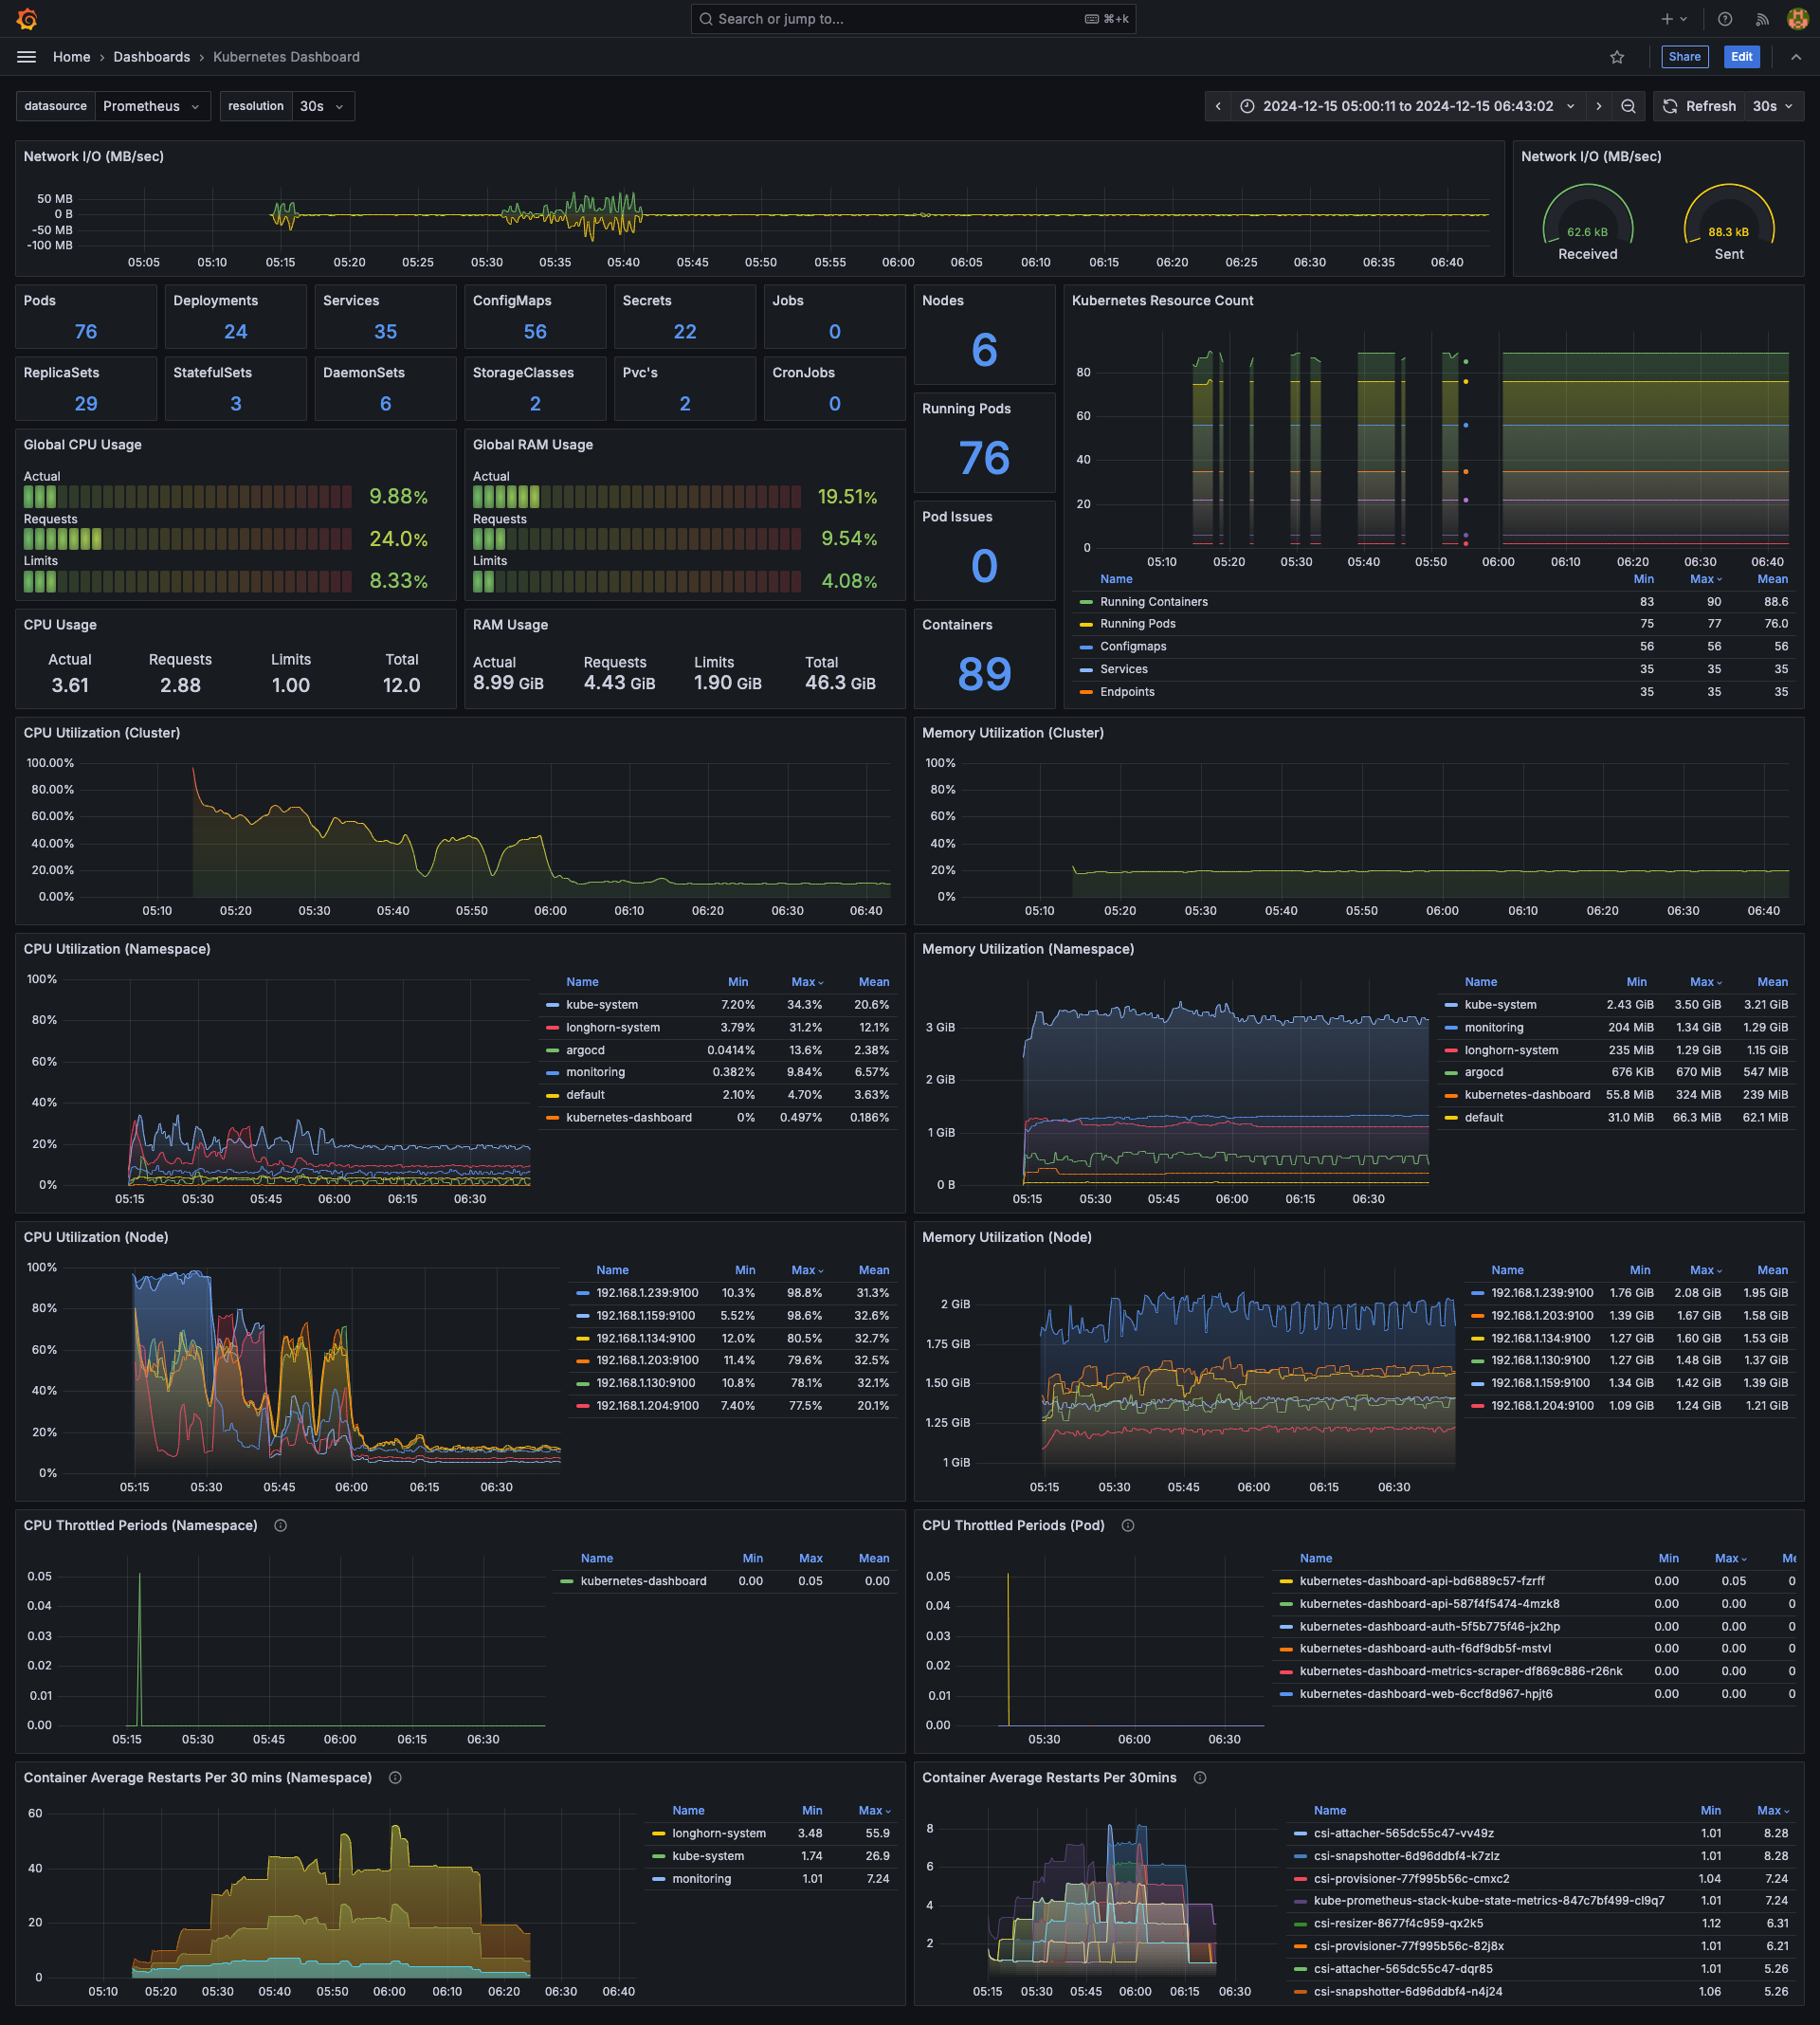
Kubernetes Dashboard
High-level view of Kubernetes cluster - useful for monitoring, alerting and troubleshooting.
Overview
High-level view of Kubernetes cluster - useful for monitoring, alerting and troubleshooting.
Works on local, bare-metal or cloud provided clusters (e.g. k3s, kind, minikube, Talos Linux, EKS etc..)
github.com/adegoodyer/grafana-dashboards
Features
- network I/O
- k8s resource counts
- highlights pods not running
- CPU/RAM utilization (cluster, node, namespace and pod)
- CPU throttling information (namespace/pod)
- container restart information (namespace/pod)
Dependencies
Last tested via kube-prometheus-stack Helm chart v66.3.1
However, will work when recent versions of the following Prometheus exporters are installed..
cAdvisorkube-state-metricsnode-exporter
Contributing
- Fork the repository
- Create your feature branch (
git checkout -b feature/amazing-feature) - Commit your changes (
git commit -m 'Add some amazing feature') - Push to the branch (
git push origin feature/amazing-feature) - Open a Pull Request
License
This project is licensed under the MIT License - see the LICENSE file for details.
Support
Data source config
Collector config:
Upload an updated version of an exported dashboard.json file from Grafana
| Revision | Description | Created | |
|---|---|---|---|
| Download |
Kubernetes
Monitor your Kubernetes deployment with prebuilt visualizations that allow you to drill down from a high-level cluster overview to pod-specific details in minutes.
Learn more