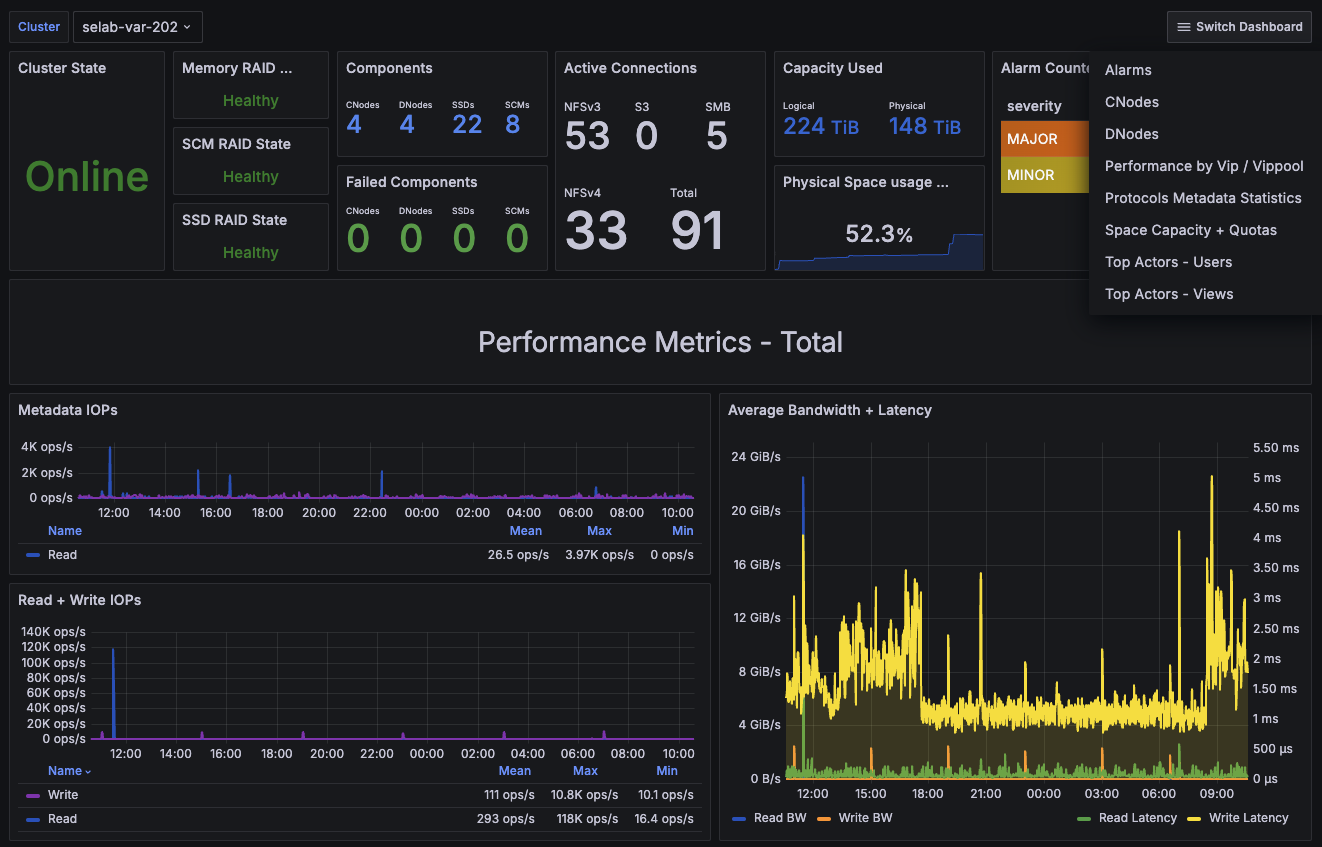
VAST Cluster Statistics
Dashboard for visualizing VAST cluster metrics
Introduction
The VAST Data Platform unifies storage, database, and containerized compute into a single, scalable software platform to power AI & deep learning in modern data centers and clouds.
In addition to the in-depth analytics provided in the product UI, VAST clusters have built-in Prometheus exporters for easy integration into existing monitoring infrastructure.
This dashboard is one of a collection, each that focuses on a different set of metrics. The full collection is available from the Exporting Metrics to Prometheus article on our support site.
The full collection of dashboards include:
- VAST Cluster Statistics (this one)
- Alarms
- CNodes
- DNodes
- Performance by Vip / Vippool
- Protocols Metadata Statistics
- Space Capacity + Quotas
- Top Actors - Users
- Top Actors - Views
Compatibility
This dashboard supports VAST 5.0-sp60 and later with the built-in Prometheus exporter. For a 4.7 dashboard, see VAST 4.7 Cluster Statistics.
Prometheus Configuration
Here's an example prometheus.yml configuration:
scrape_configs:
  # Recommended scrape interval is 60s although 30s may work
  # for smaller clusters. Very large clusters may require longer
  # intervals and a higher scrape_timeout.
  - job_name: 'vast_all'
    metrics_path: '/api/prometheusmetrics/all'
    scrape_interval: 60s
    scrape_timeout: 45s
scheme: https
static_configs:
  - targets: ['10.71.10.202:443']
tls_config:
    insecure_skip_verify: true

basic_auth:
   username: 'admin'
   password: 'xxxxxx'
Data source config
Collector config:
Upload an updated version of an exported dashboard.json file from Grafana
| Revision | Description | Created | |
|---|---|---|---|
| Download |