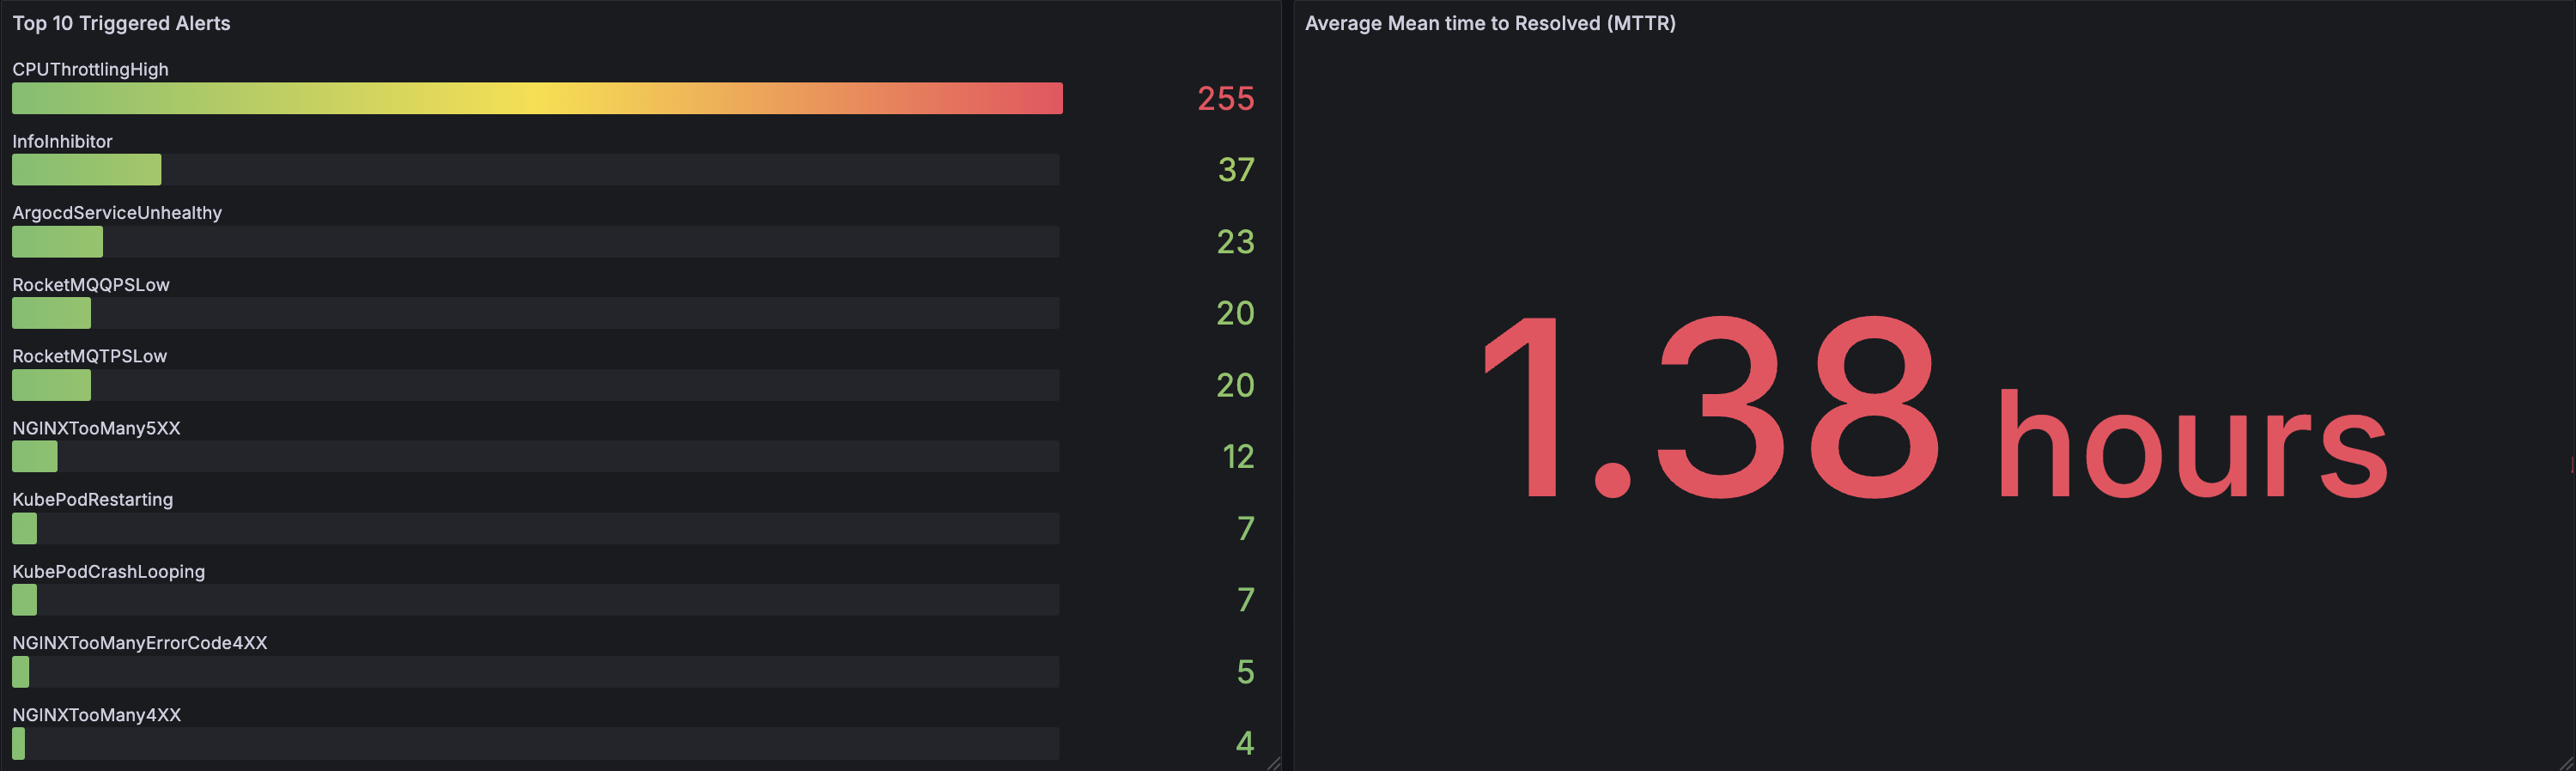
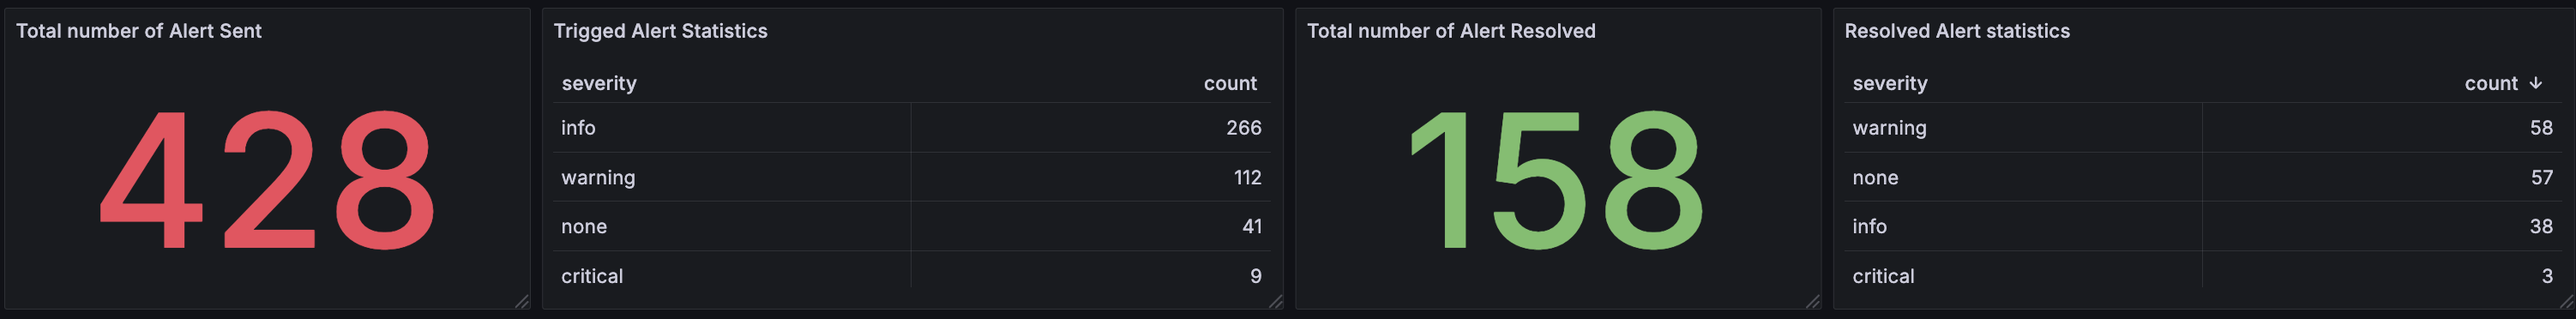
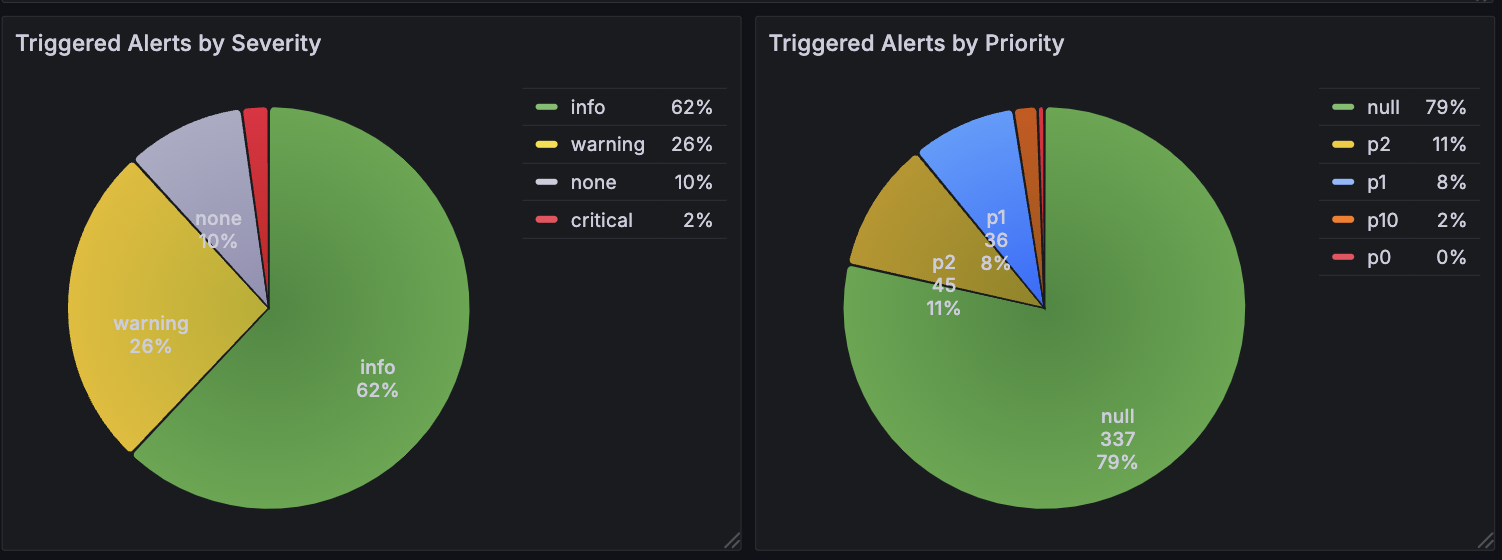
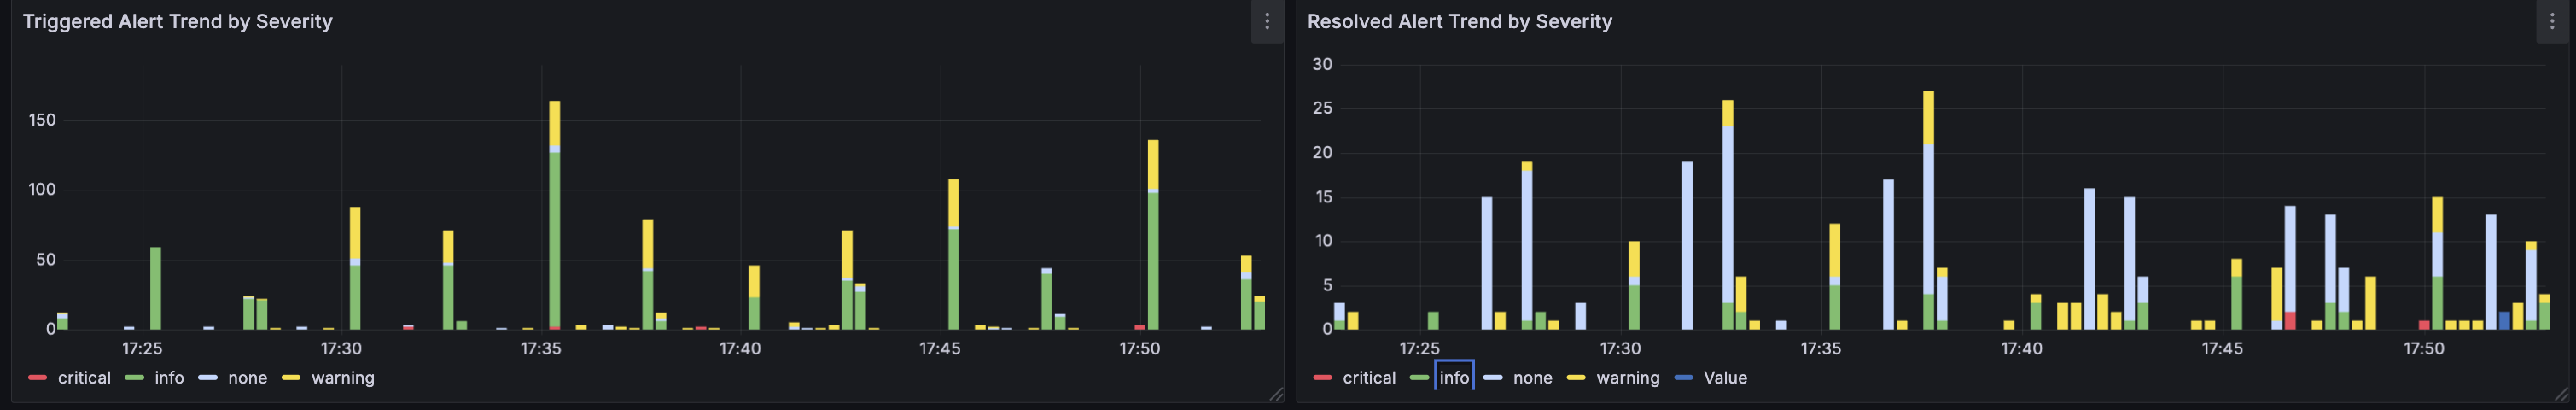
Loki / AlertSnitch Alert History Overview
Ingests Prometheus alerts and poops them into a backend storage for offline analysis
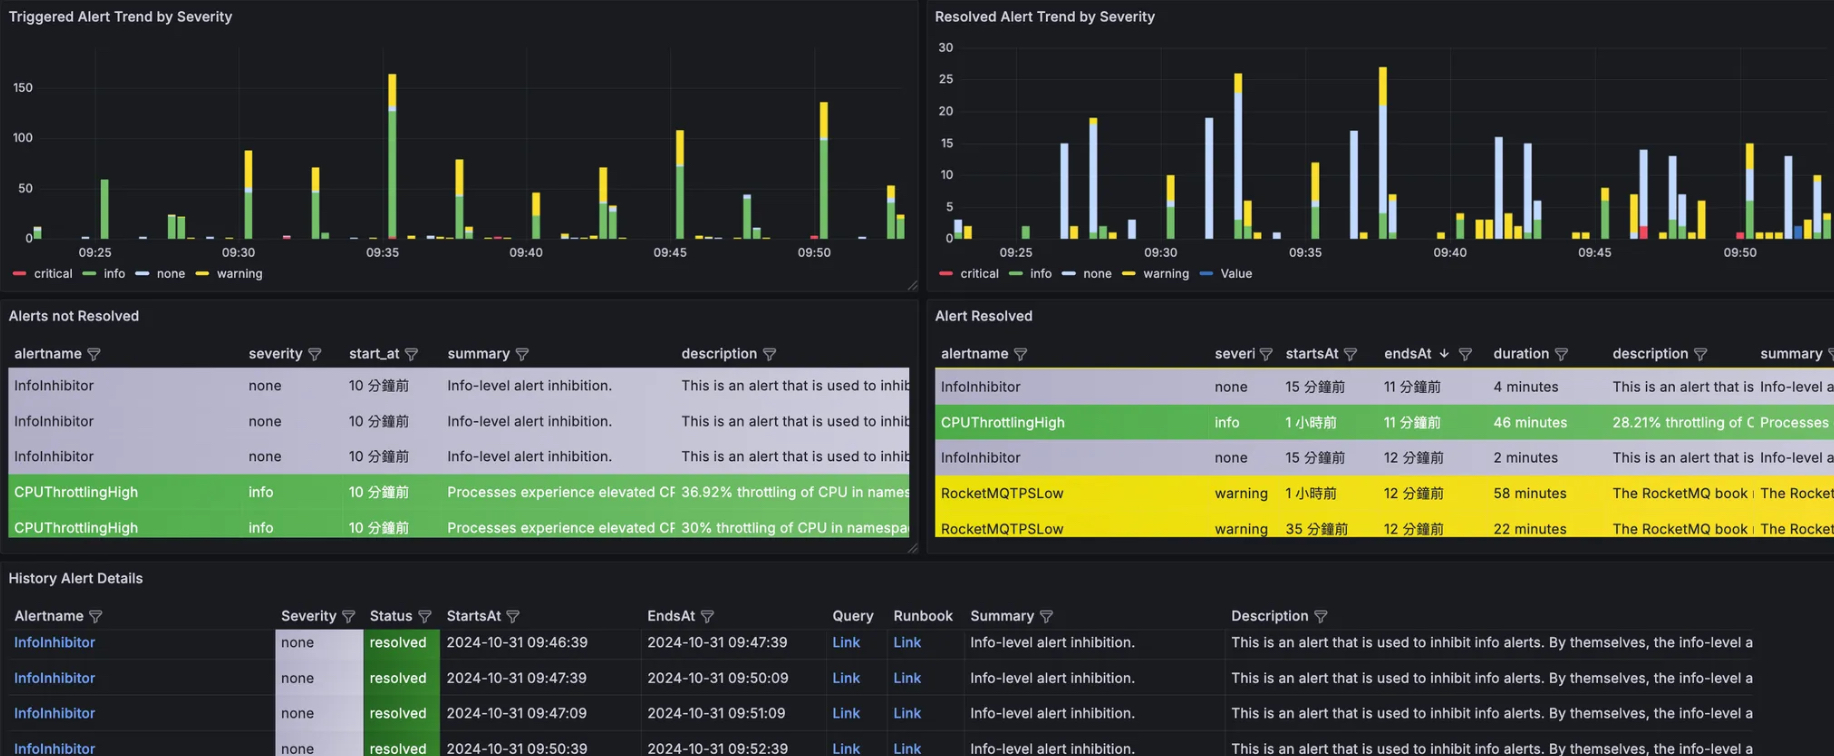
AlertSnitch
Captures Prometheus AlertManager alerts and writes them in a MySQL, Postgres or Loki for future examination.
Because given a noisy enough alerting environment, offline querying capabilities of triggered alerts is extremely valuable.
Data source config
Collector type:
Collector plugins:
Collector config:
Revisions
Upload an updated version of an exported dashboard.json file from Grafana
| Revision | Description | Created | |
|---|---|---|---|
| Download |
Grafana Loki (self-hosted)
Easily monitor Grafana Loki (self-hosted), a horizontally scalable, highly available, multi-tenant log aggregation system inspired by Prometheus, with Grafana Cloud's out-of-the-box monitoring solution.
Learn more