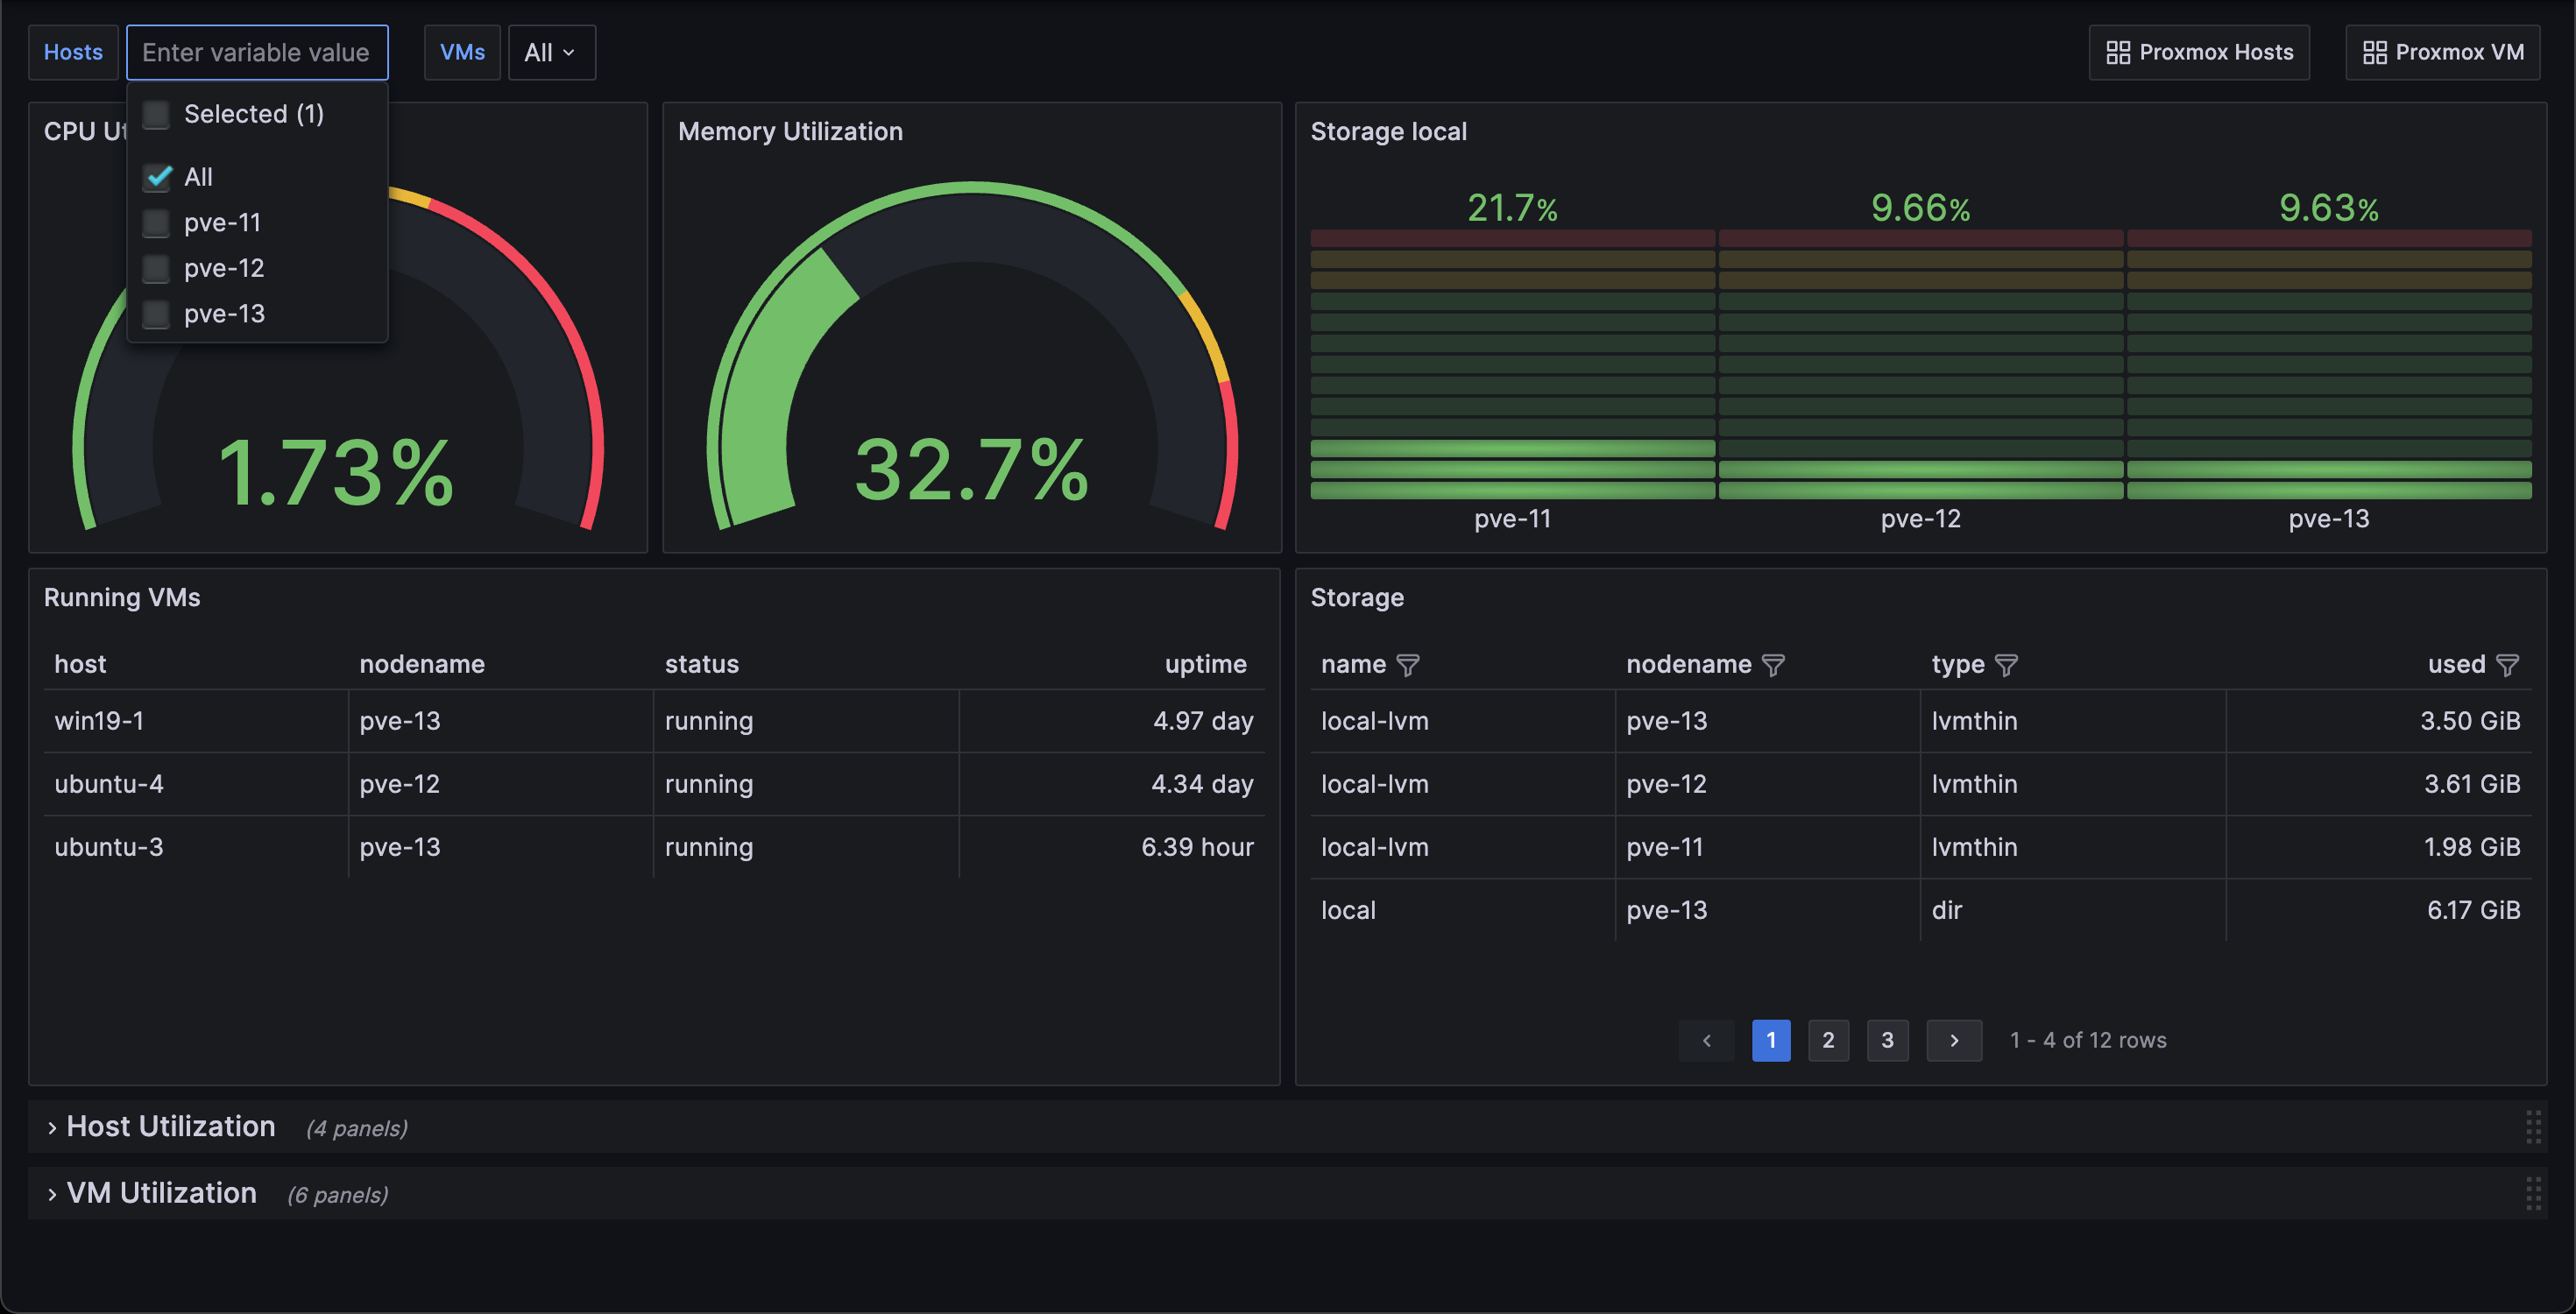
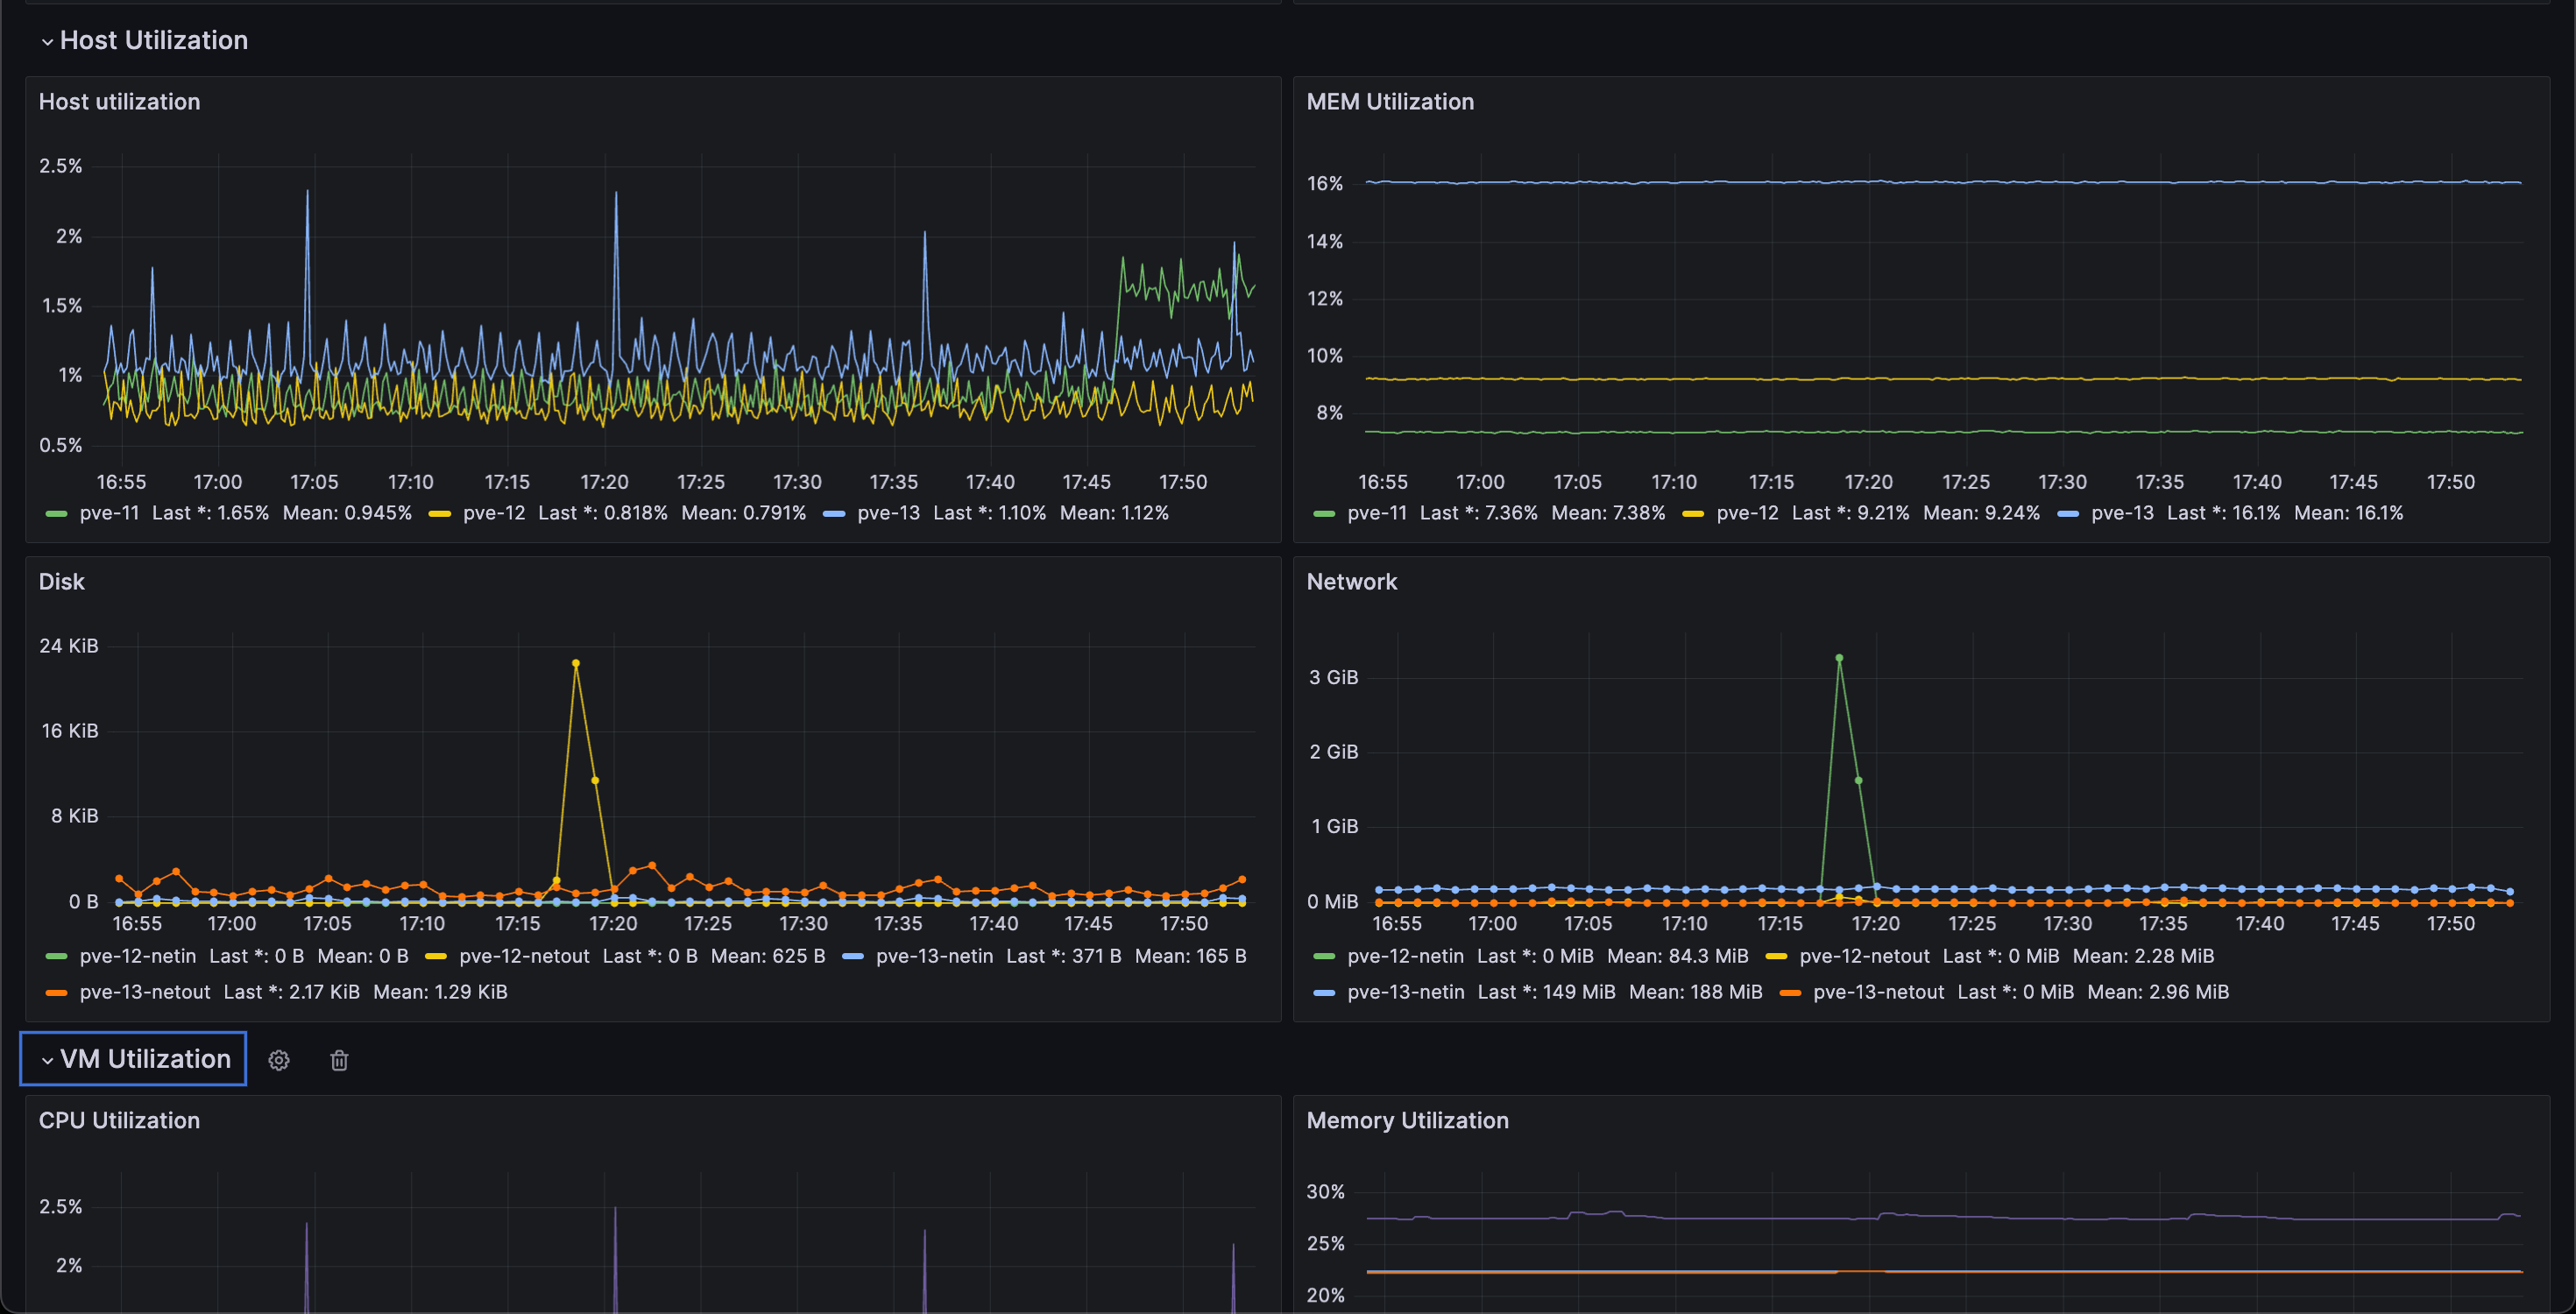
Proxmox Overview
The dashboard is built for giving a quick overview of the utilization of a Proxmox Virtual environment.
It fetches data from an InfluxDB database and will use InfluxQL as the query language.
To configure the Proxmox to Influx integration you'll make use of the built in Metric Server functionality in Proxmox. For more information see the Proxmox documentation or my blog post here
See also my other Proxmox dashboards built on the same datasource
- Proxmox Overview (this dashboard)
- Proxmox Host, id 22483
- Proxmox VM, id 22484
Data source config
Collector type:
Collector plugins:
Collector config:
Revisions
Upload an updated version of an exported dashboard.json file from Grafana
| Revision | Description | Created | |
|---|---|---|---|
| Download |

