LavinMQ
LavinMQ overview dashboard based on /metrics endpoint
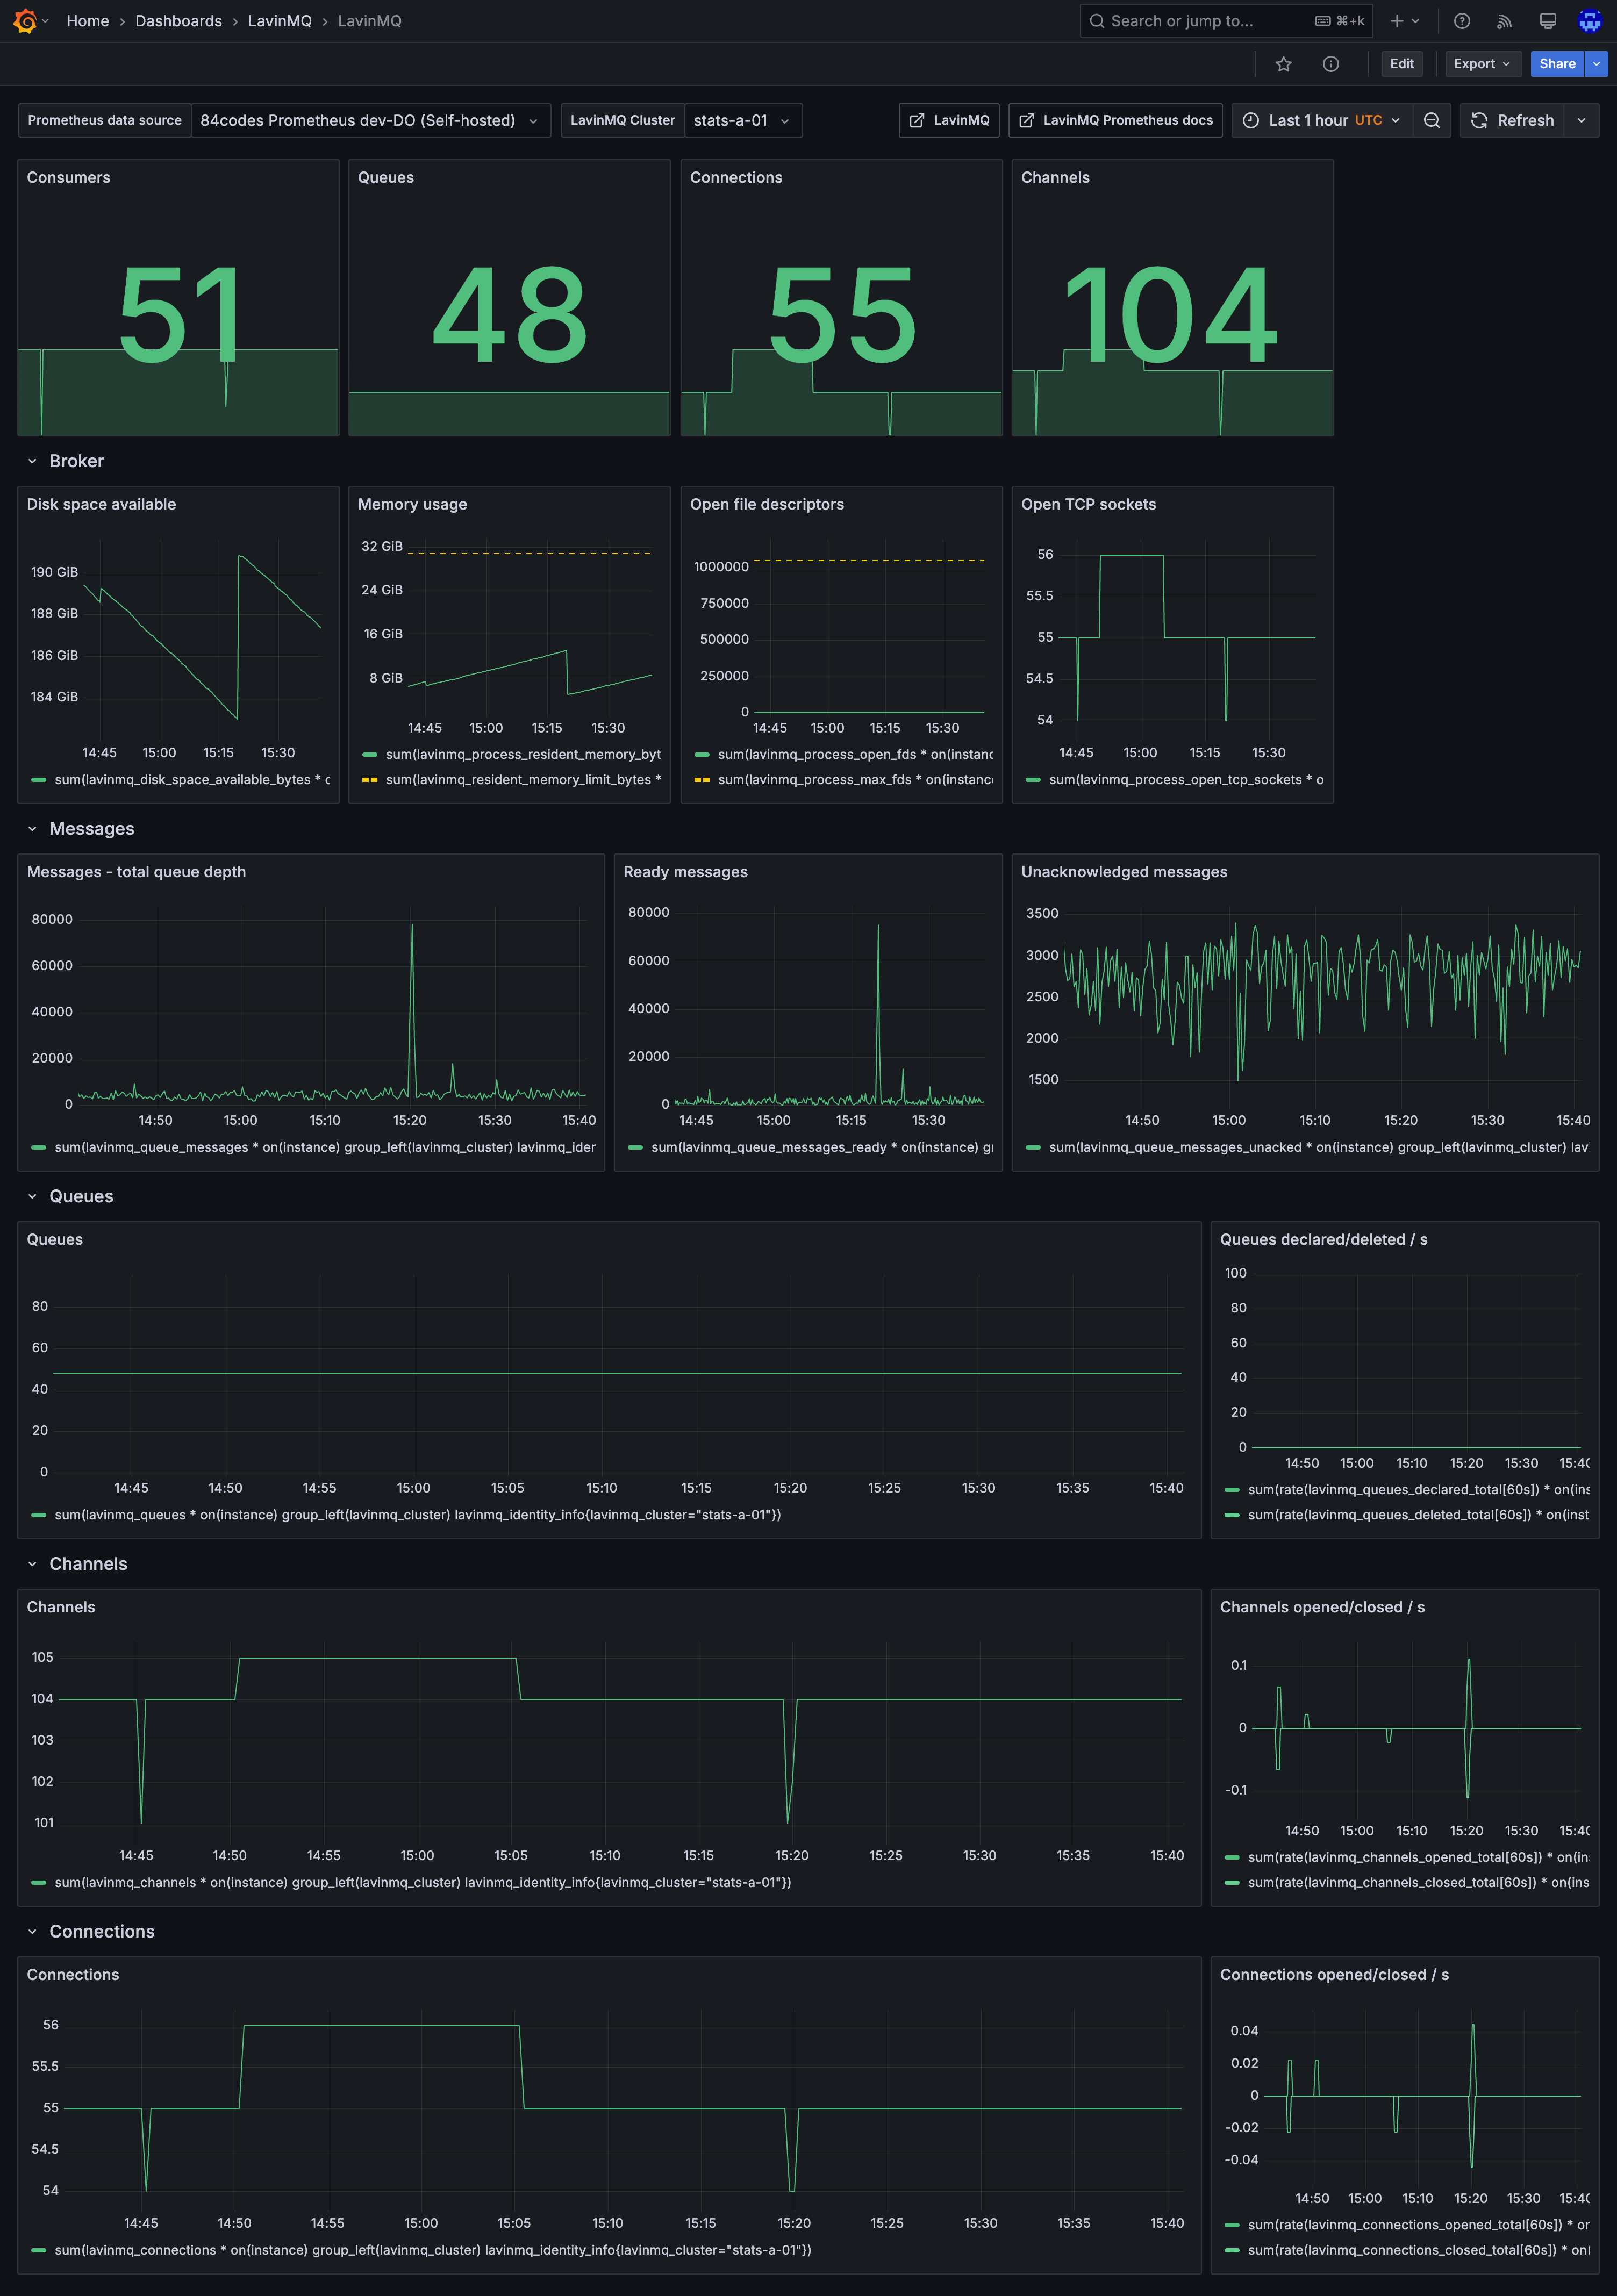
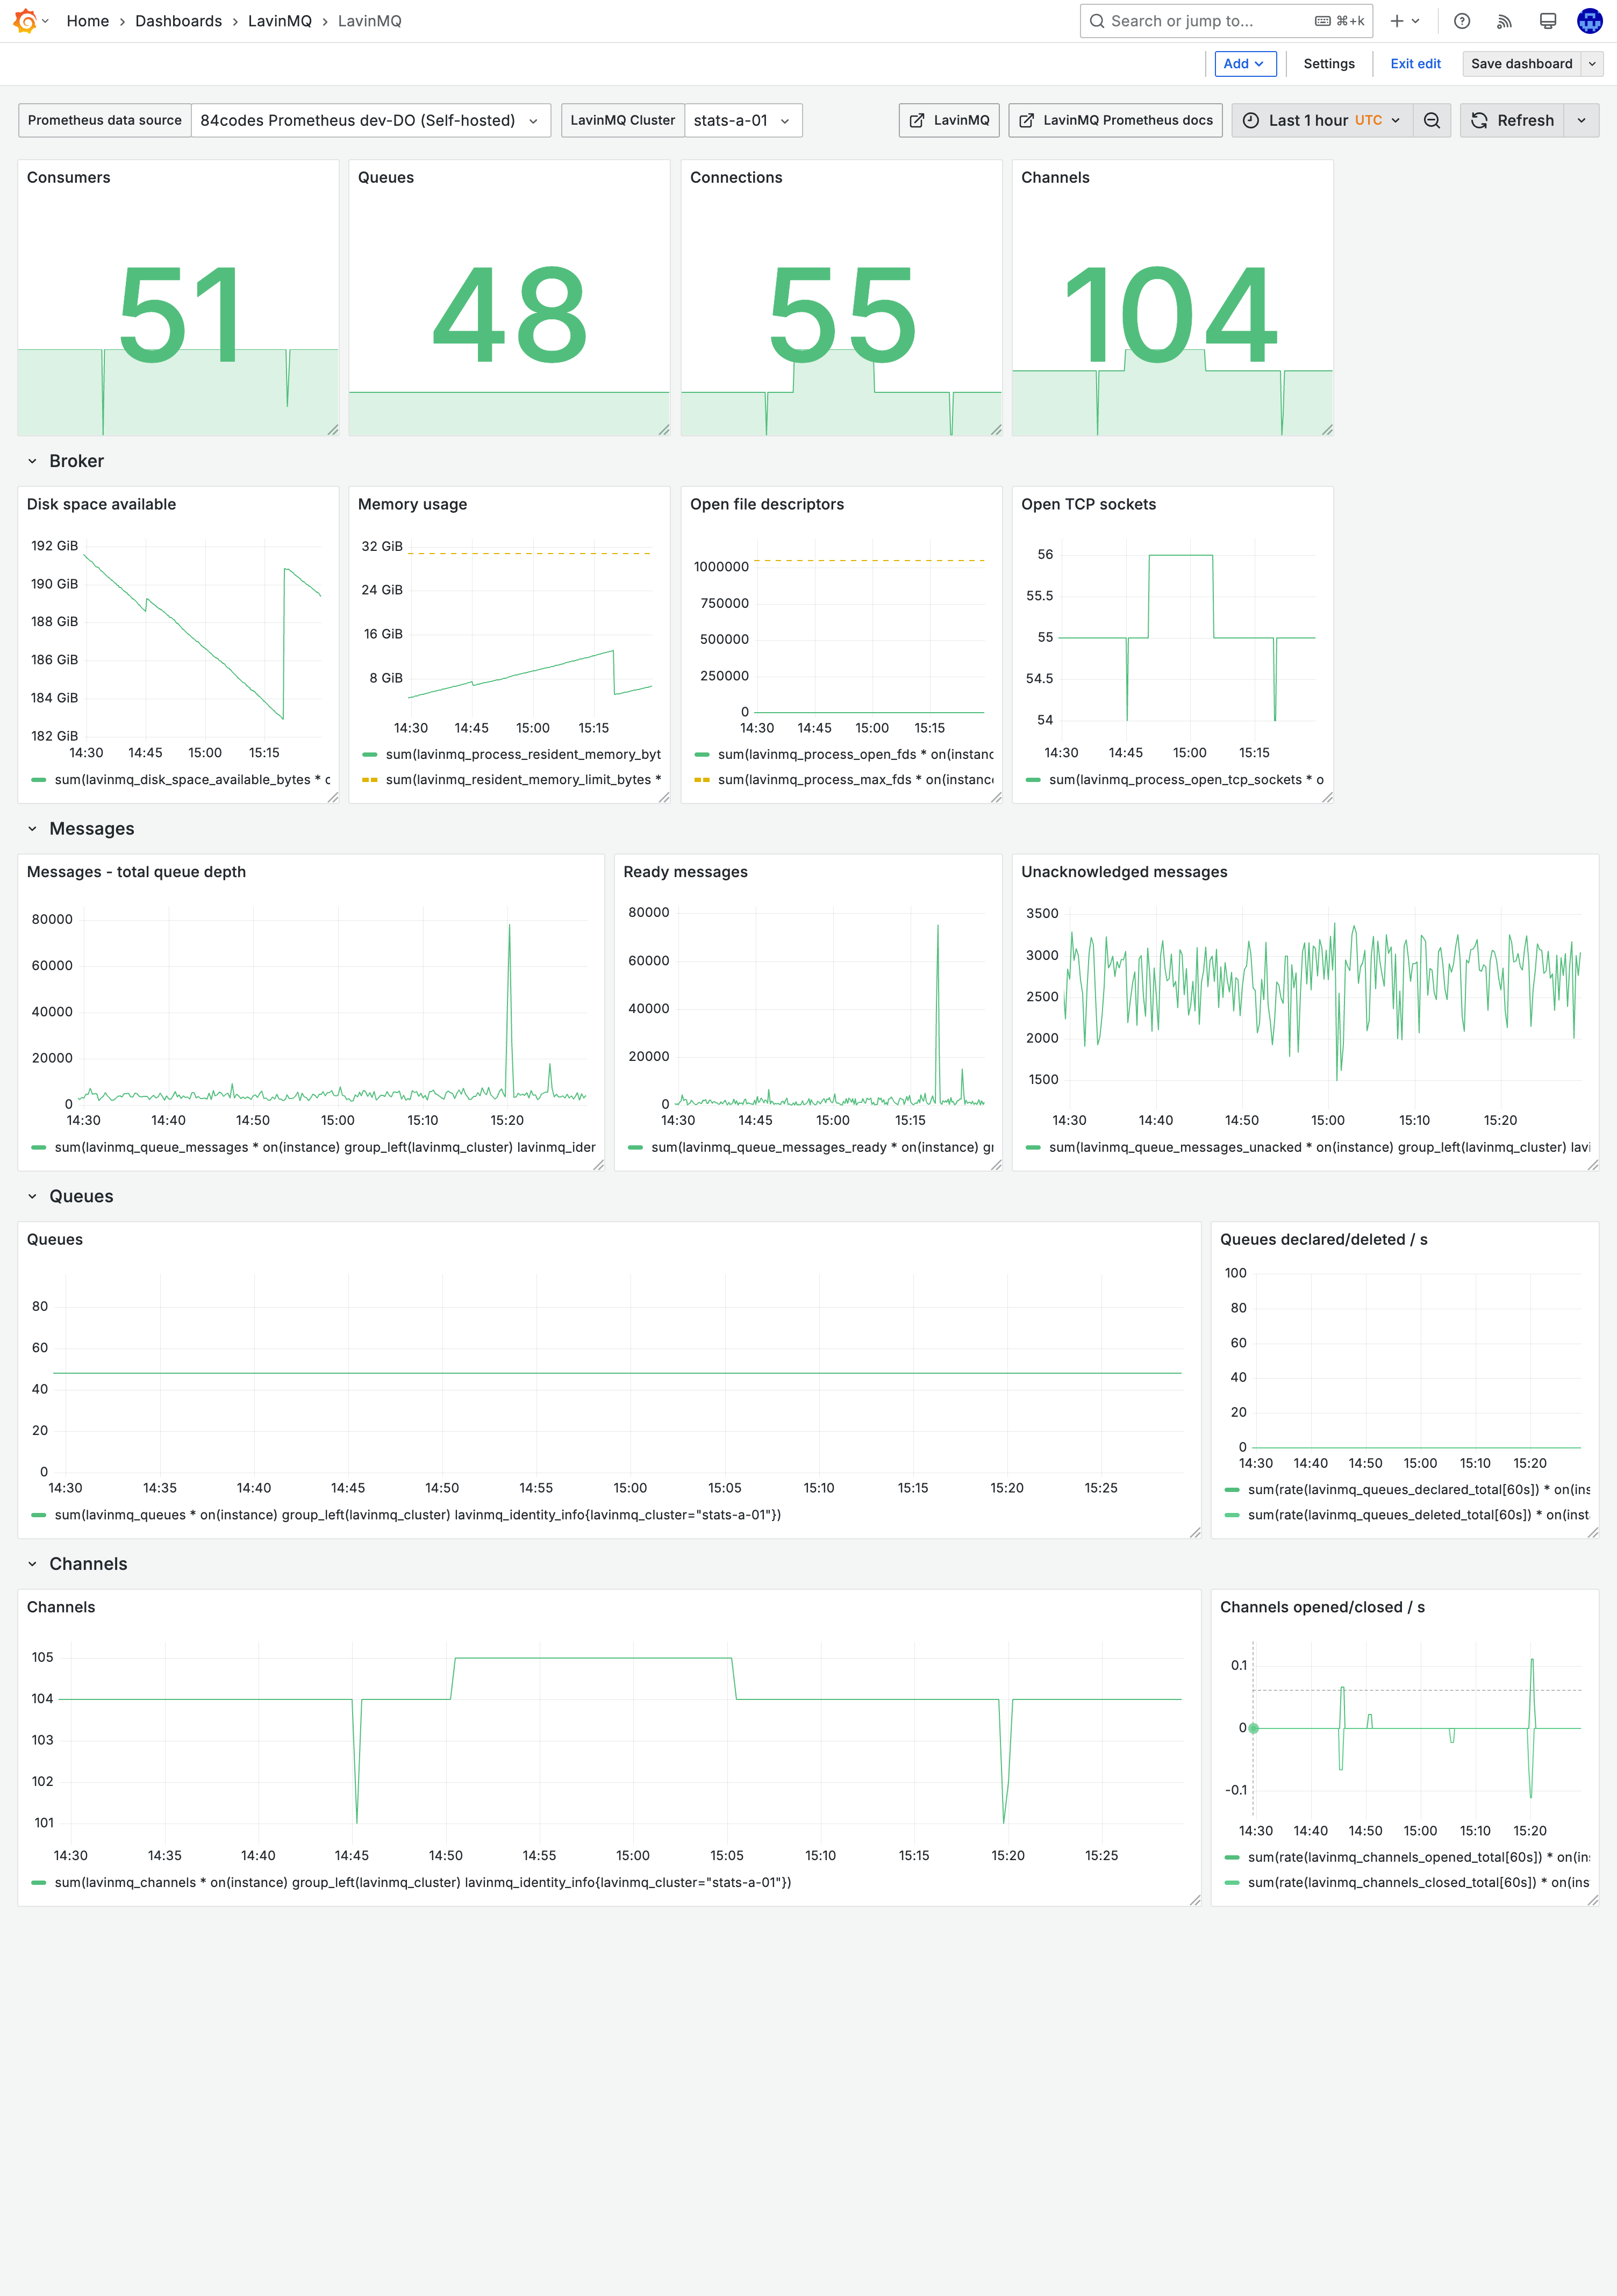
The LavinMQ dashboard uses the prometheus data source to create a Grafana dashboard with the stat and timeseries panels.
Data source config
Collector type:
Collector plugins:
Collector config:
Revisions
Upload an updated version of an exported dashboard.json file from Grafana
| Revision | Description | Created | |
|---|---|---|---|
| Download |