mactop
A Grafana dashboard that visualizes real-time performance metrics from MacTop, including CPU and GPU usage, memory consumption, and power usage
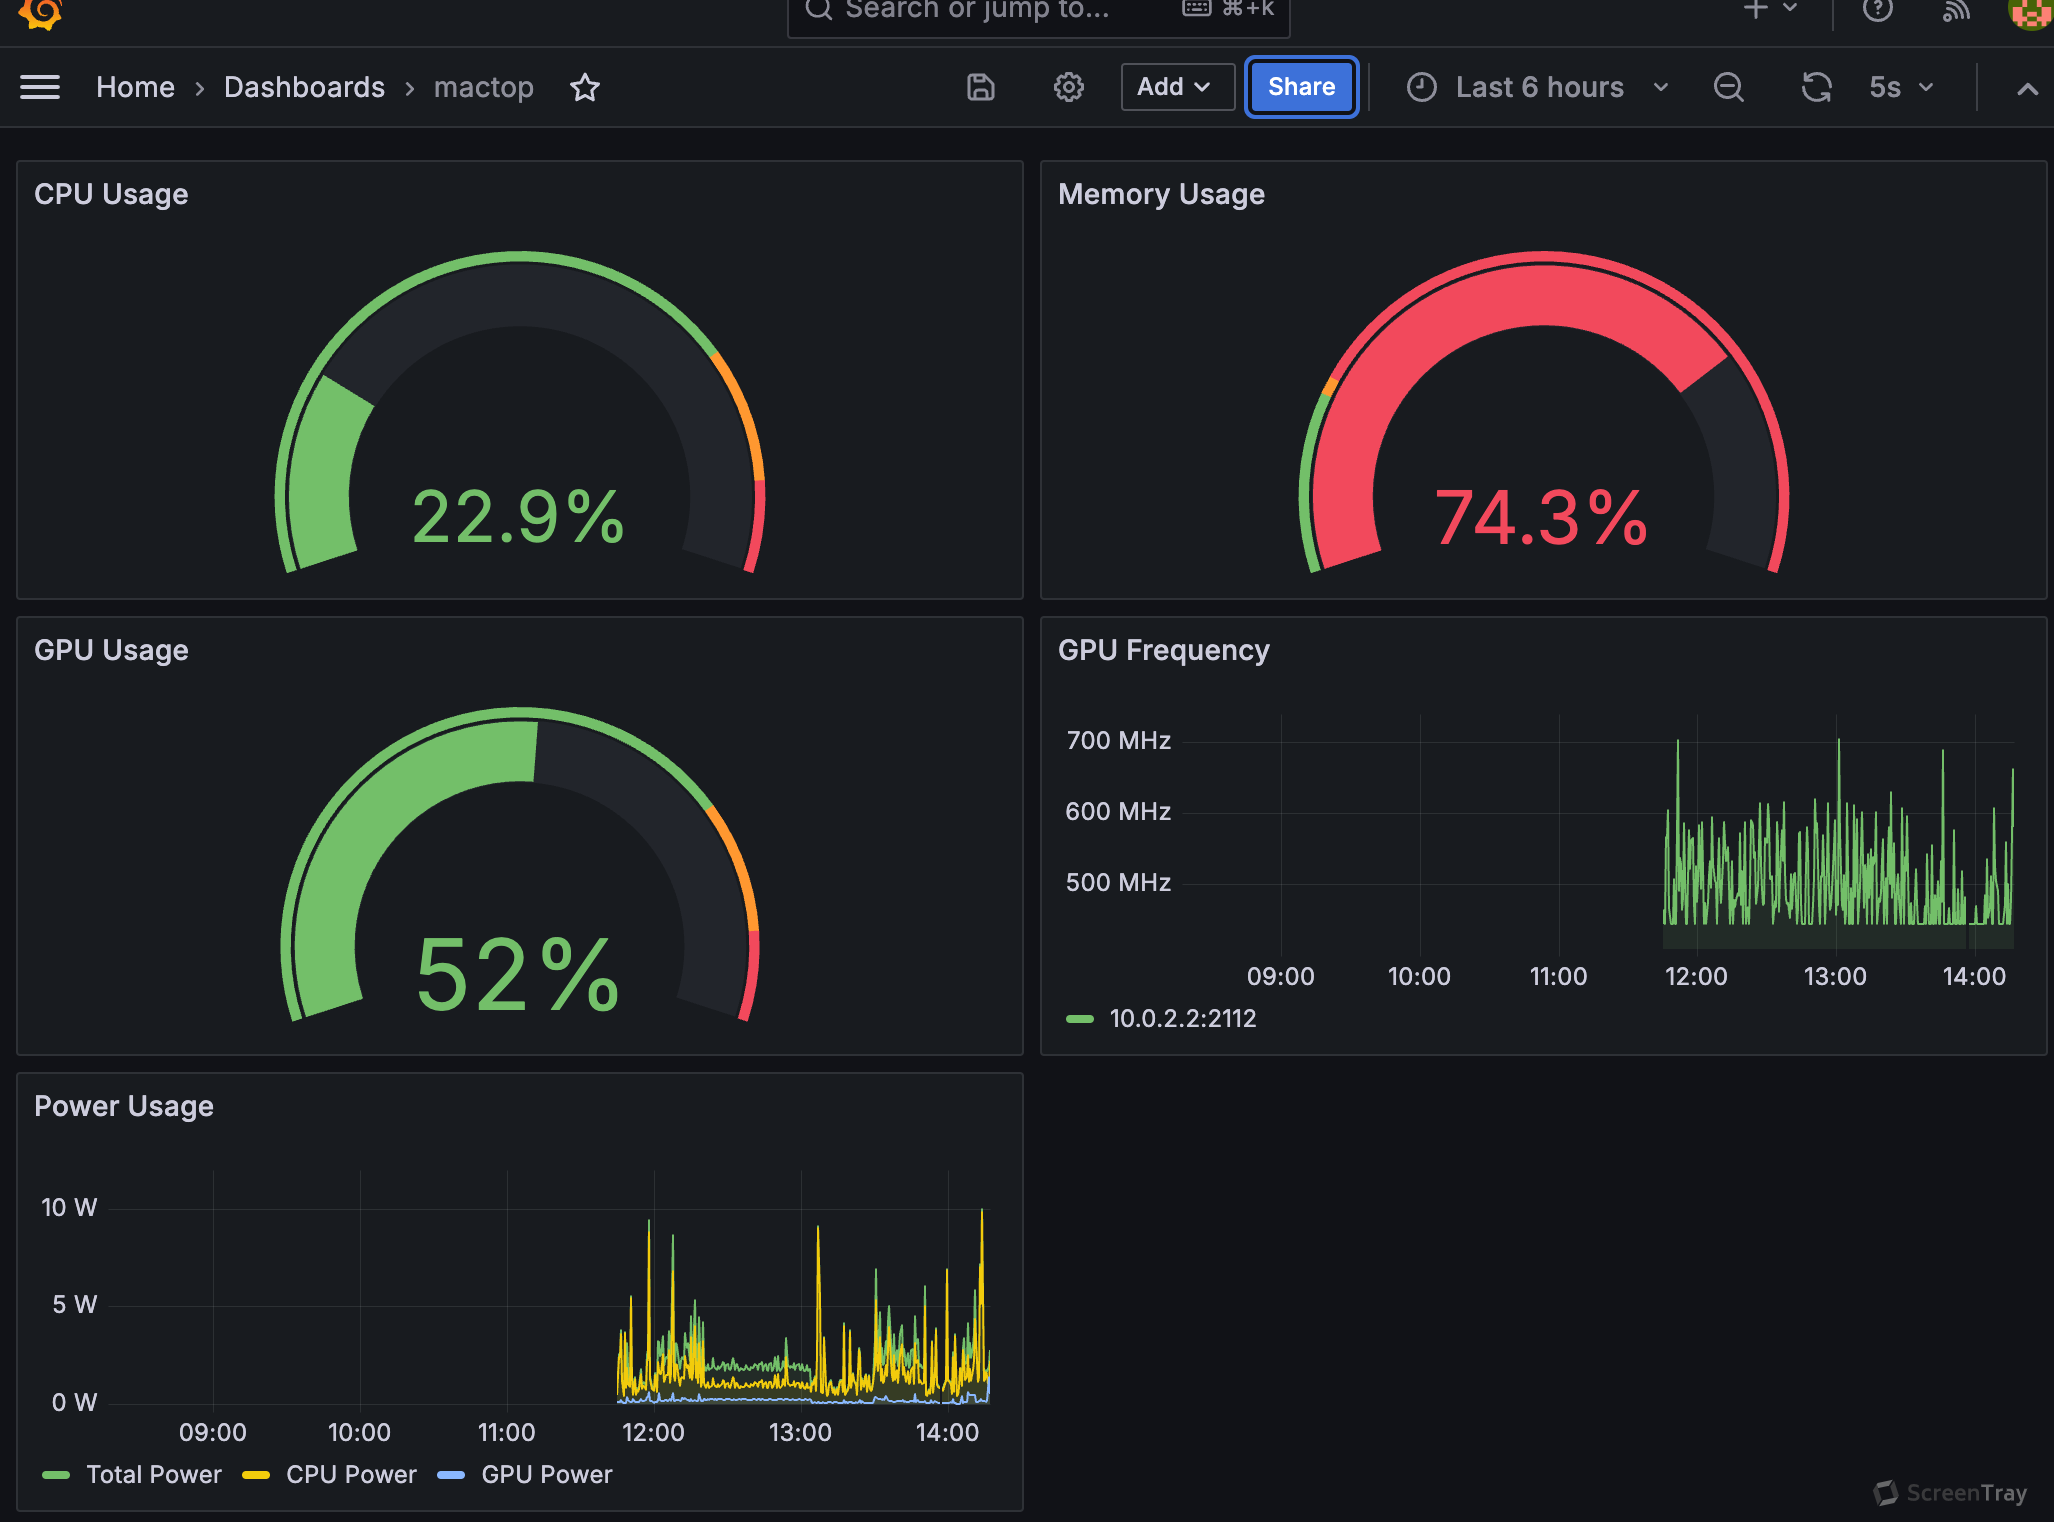
The mactop dashboard uses the prometheus data source to create a Grafana dashboard with the gauge and timeseries panels.
Data source config
Collector type:
Collector plugins:
Collector config:
Revisions
Upload an updated version of an exported dashboard.json file from Grafana
| Revision | Description | Created | |
|---|---|---|---|
| Download |