WAZUH - SYSTEM VULNERABILITIES
Please Note. I used an extractor to format my log. To fix wazuh logs, replace _ with . eg (Change agent_name to agent.name in Grafana).Other than just using Kibana, You can use Elasticsearch data source to visualize Wazuh - SYSTEM VULNERABILITIES, on all Agents. I prefer Grafana because it loads faster and allows me to consolidate multiple data sources, such as Prometheus and InfluxDB, into a single source of truth.
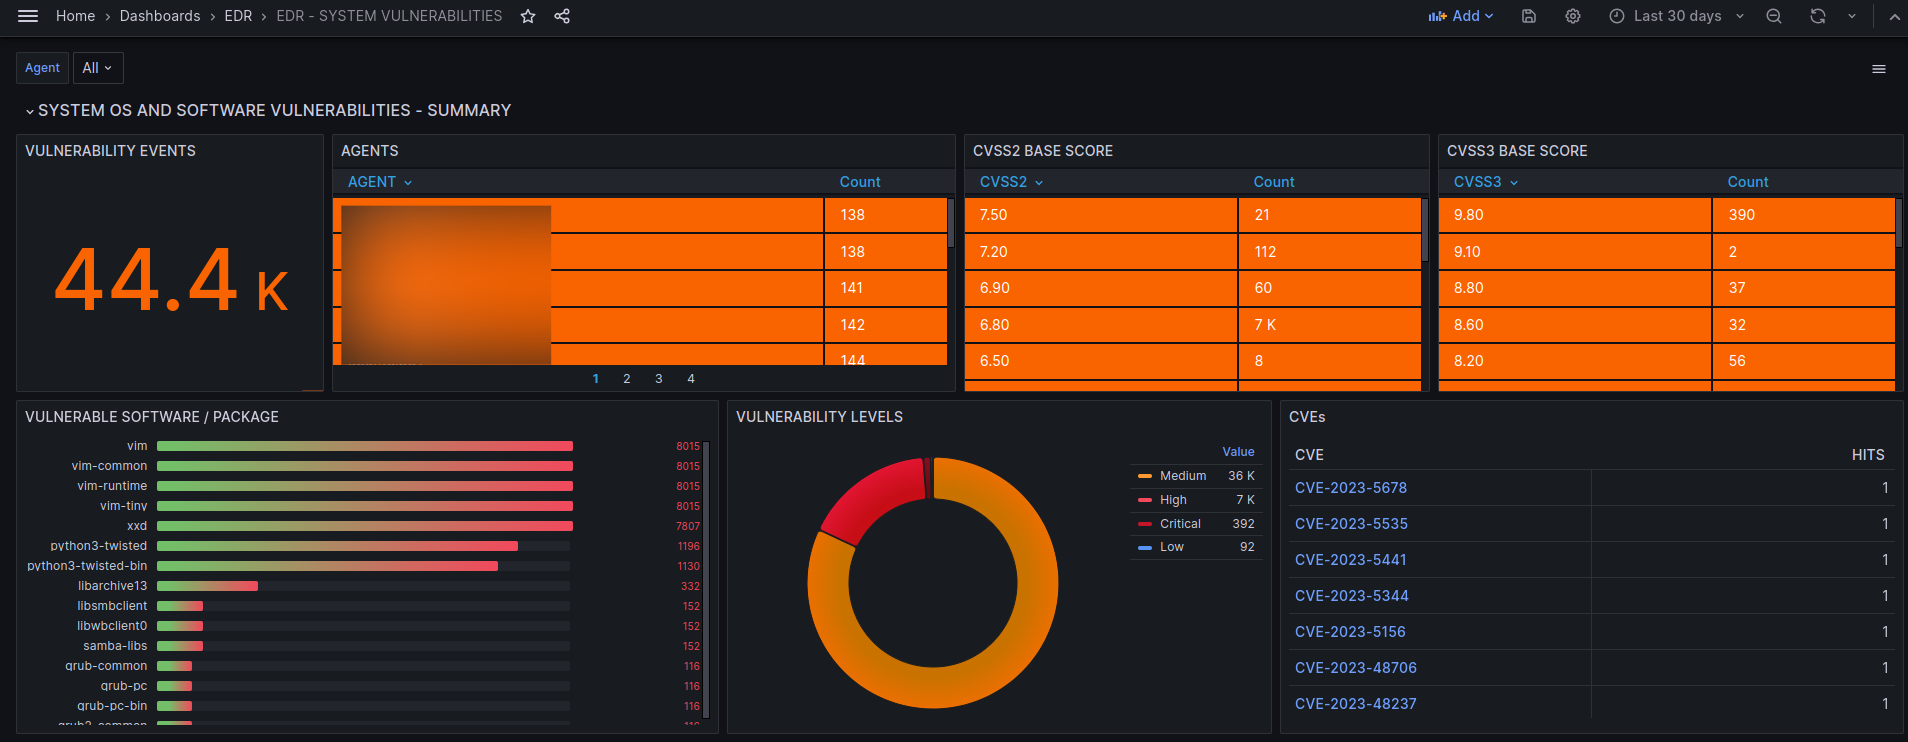
Please Note. I used an extractor to format my log. To fix wazuh logs, replace _ with . eg (Change agent_name to agent.name in Grafana).Other than just using Kibana, You can use Elasticsearch/Wazuh indexer data source to visualize Wazuh - SYSTEM VULNERABILITIES, on all Agents. I prefer Grafana because it loads faster and allows me to consolidate multiple data sources, such as Prometheus and InfluxDB, into a single source of truth. With Grafana I can create multiple organizations with different user roles
Data source config
Collector config:
Upload an updated version of an exported dashboard.json file from Grafana
| Revision | Description | Created | |
|---|---|---|---|
| Download |