K8s Node Metrics / Multi Clusters (Node Exporter, Prometheus, Grafana11, 2025, EN)
Centralized Multicluster Monitoring / Node Metrics / Multi-Job Selection / Grafana 11 / Reference 11074
Original Source (11074)
- https://grafana.com/grafana/dashboards/11074-node-exporter-for-prometheus-dashboard-en-v20201010/
- https://github.com/starsliao/Prometheus
Custom Changes (22413)
- Latest: https://github.com/YunanJeong/cmm
- Support Grafana 11.3
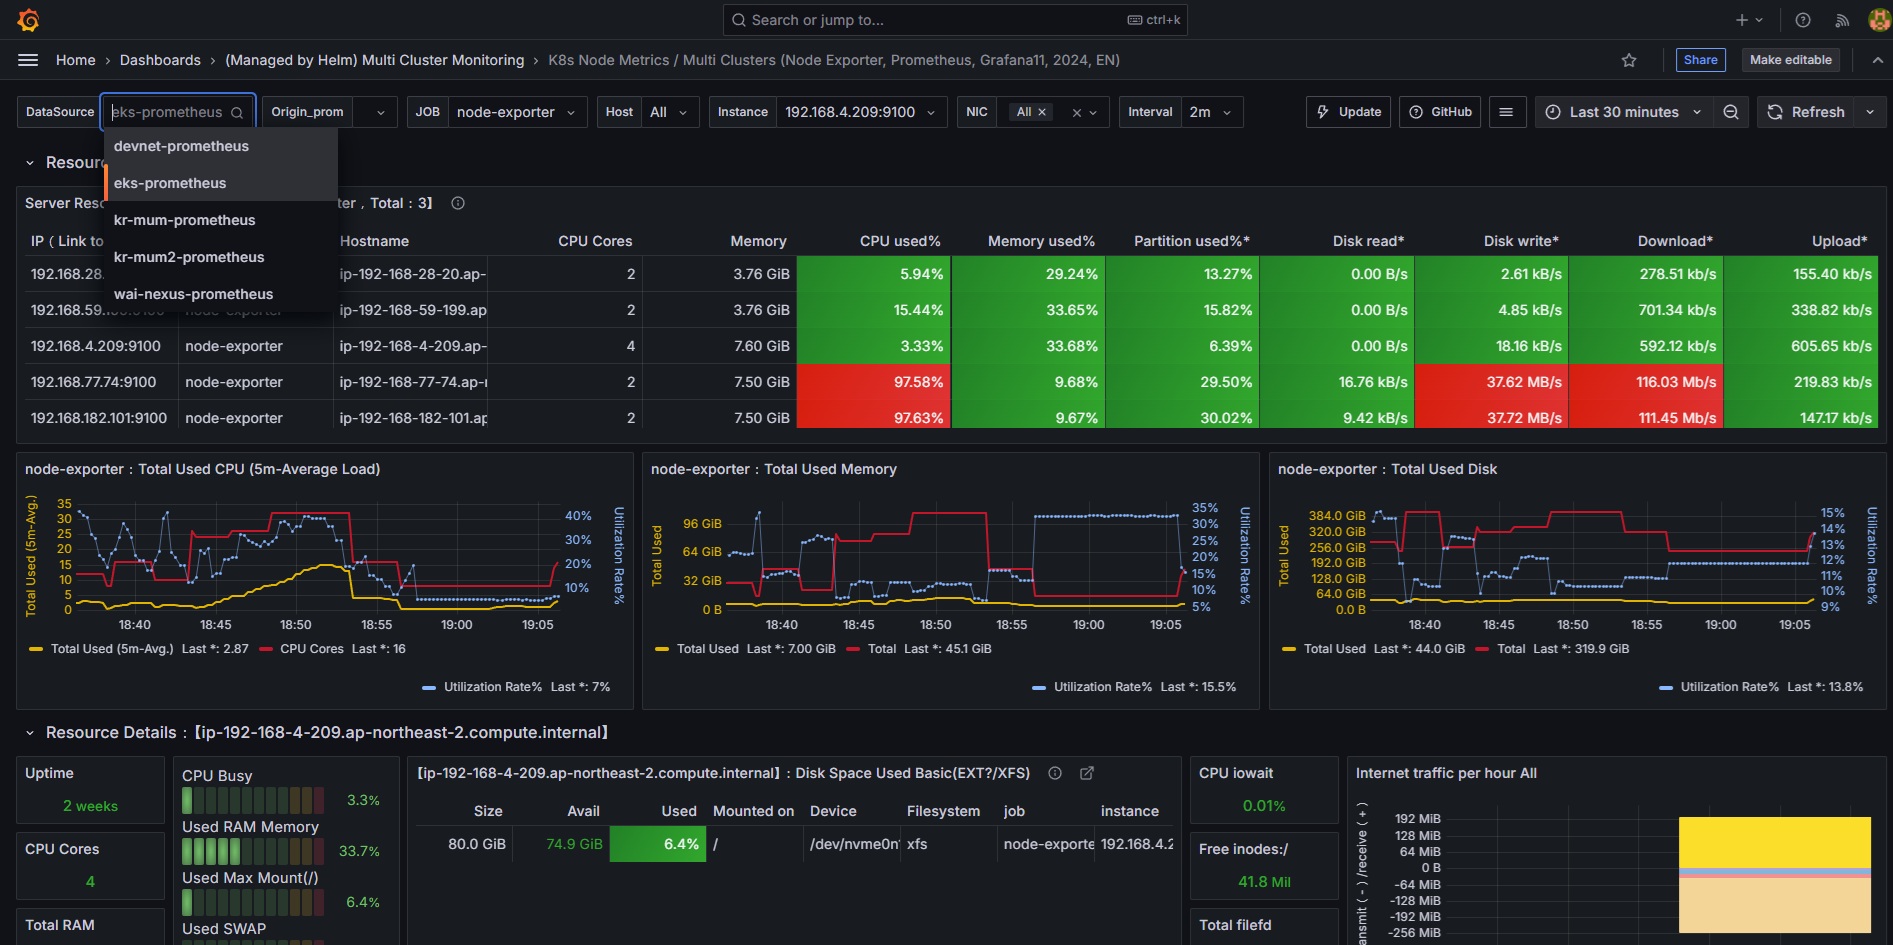
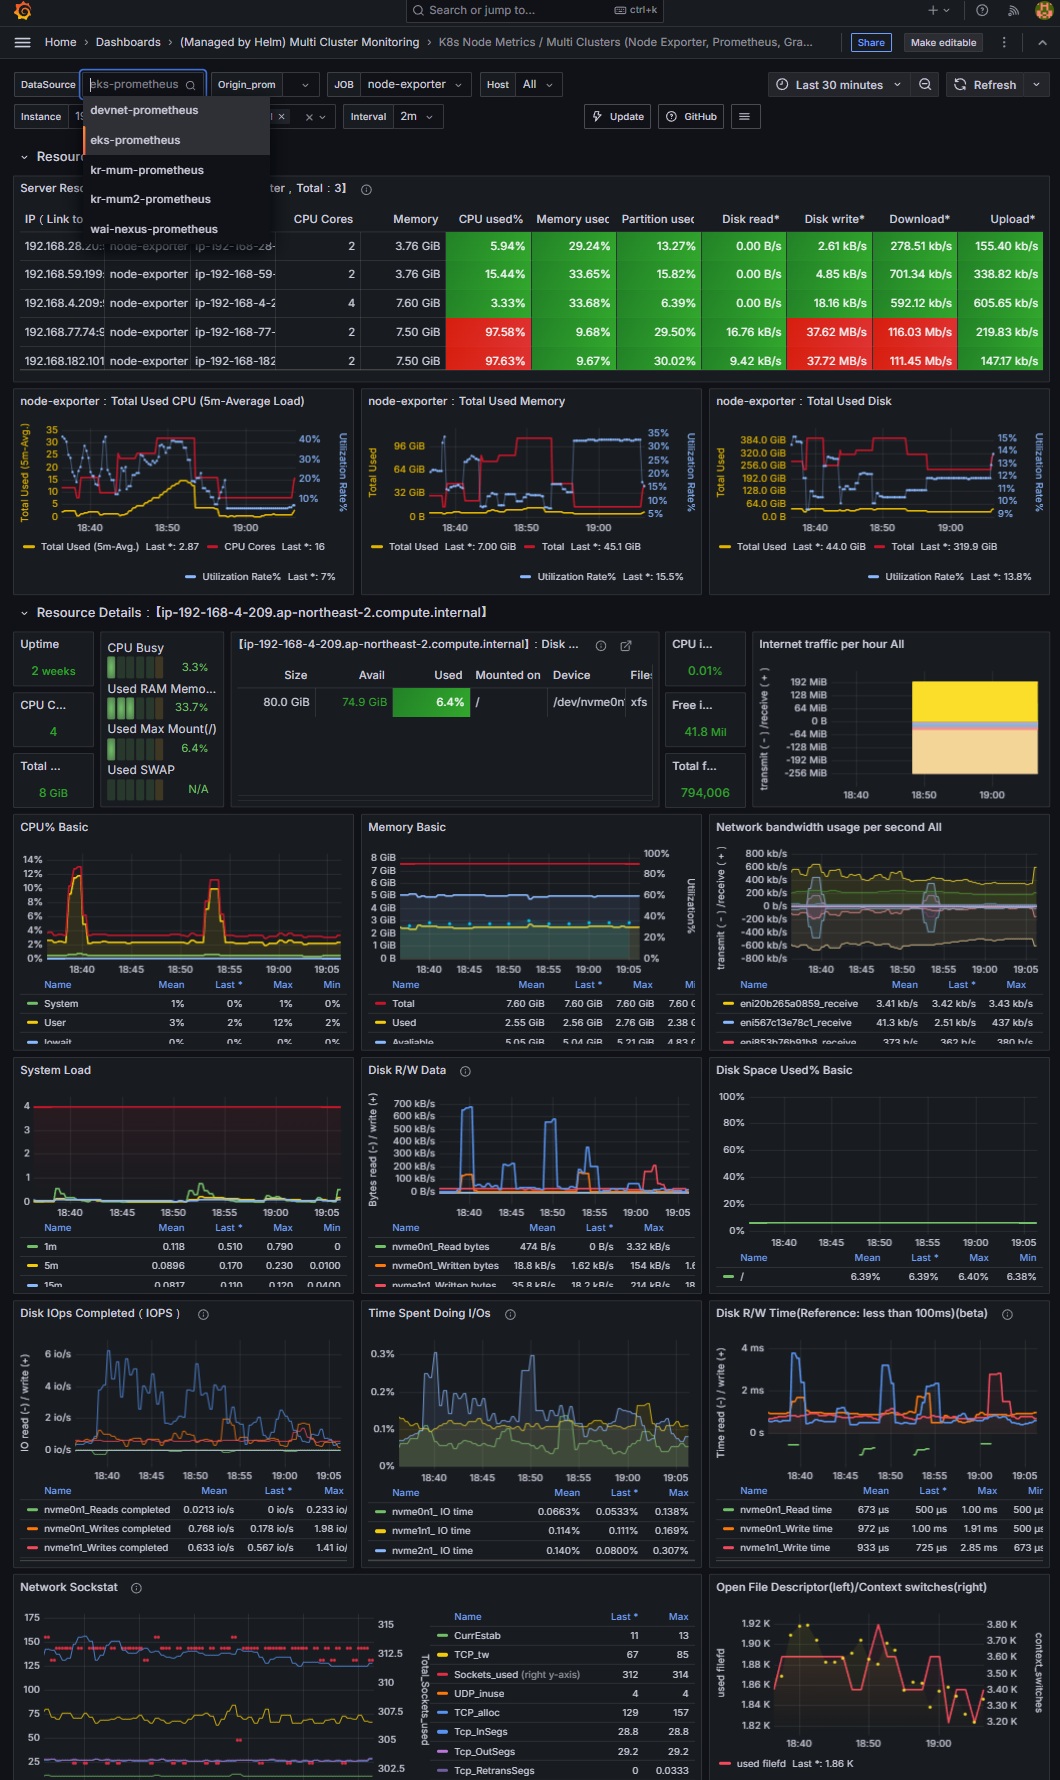
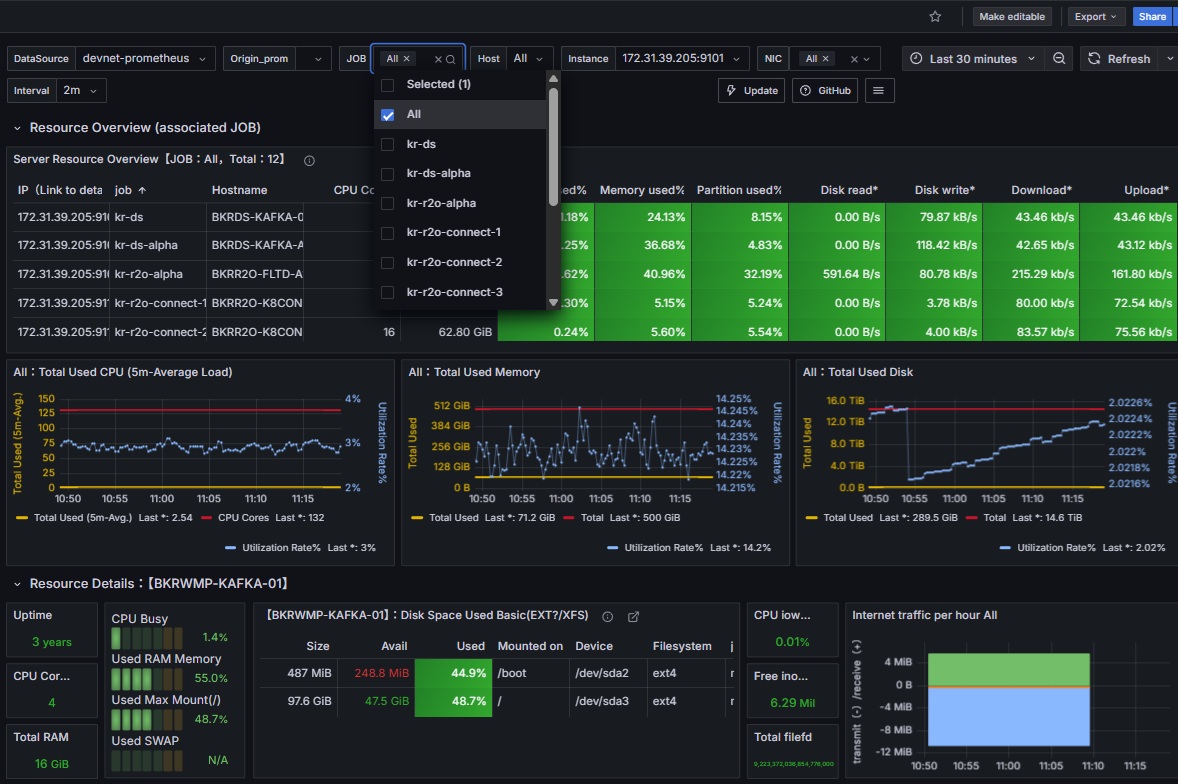
- Support Dynamic Selection for Multi-DataSource(Prometheus)
- Support English
- 11074's style is very useful. Also, 11074's publisher supports other advanced dashboards(like 16098)
- BUT, they only support Chinese in the latest Grafana.
- Default Settings of Table minWidth for Vertical Mode
- Modify the design of some panels
- Total CPU, Total Memory, Total Disk
- Delete Links
- Redirection via Link URL is unstable in the latest Grafana. Please just use label selection.
UseCase
- We are operating multiple Kubernetes clusters, and have deployed node-exporter and prometheus to each cluster using the kube-prometheus-stack helm chart.
- We want to monitor metrics of multiple clusters in a centralized monitoring environment(1 dashboard, 1 Grafana).
Data source config
Collector type:
Collector plugins:
Collector config:
Revisions
Upload an updated version of an exported dashboard.json file from Grafana
| Revision | Description | Created | |
|---|---|---|---|
| Download |
Kubernetes
Monitor your Kubernetes deployment with prebuilt visualizations that allow you to drill down from a high-level cluster overview to pod-specific details in minutes.
Learn more