Temperature and Humidity Monitor
This Grafana dashboard provides temperature and humidity metrics using Prometheus, and is a reference sample for the sensor-data-monitoring-grafana project.
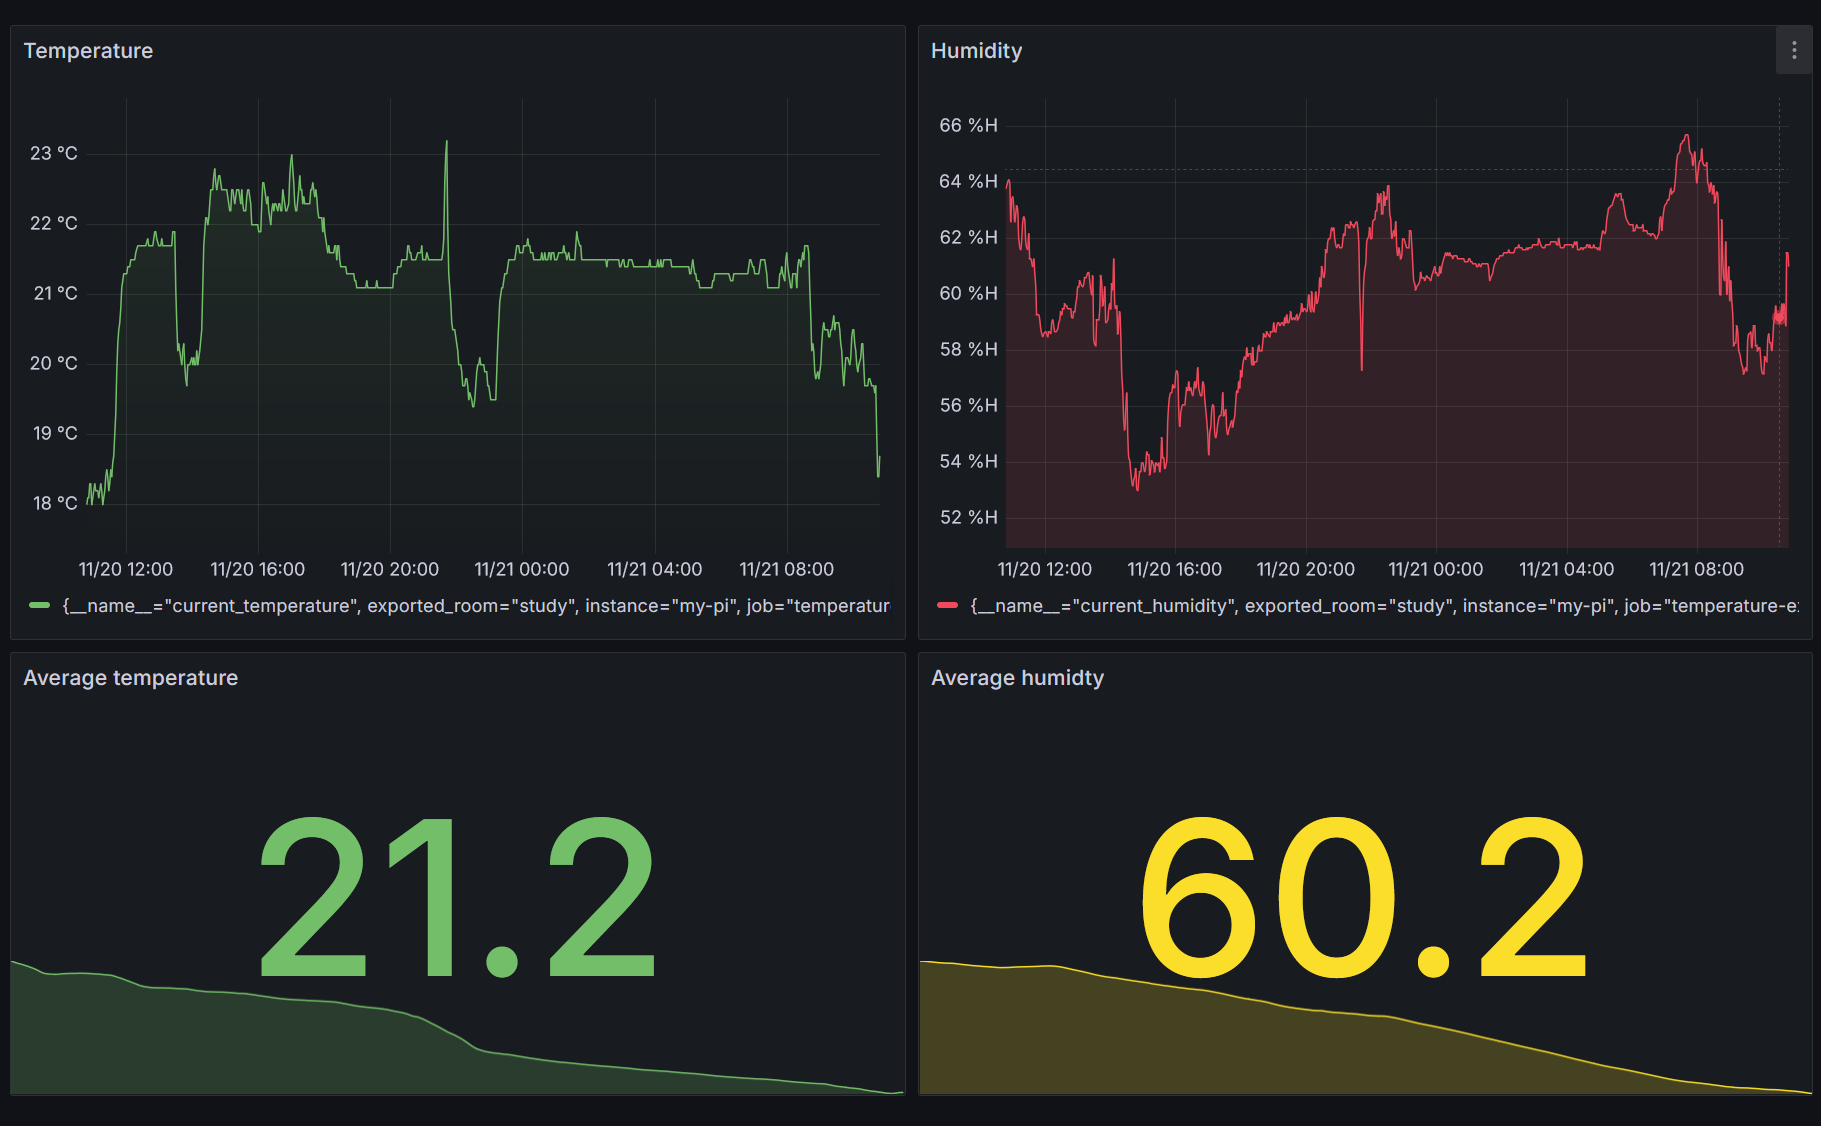
This Grafana dashboard provides a comprehensive overview of temperature and humidity metrics and uses Prometheus as the data source. It is a reference sample from the GitHub project sensor-data-monitoring-grafana and is specifically designed to work within that context.
Data source config
Collector type:
Collector plugins:
Collector config:
Revisions
Upload an updated version of an exported dashboard.json file from Grafana
| Revision | Description | Created | |
|---|---|---|---|
| Download |