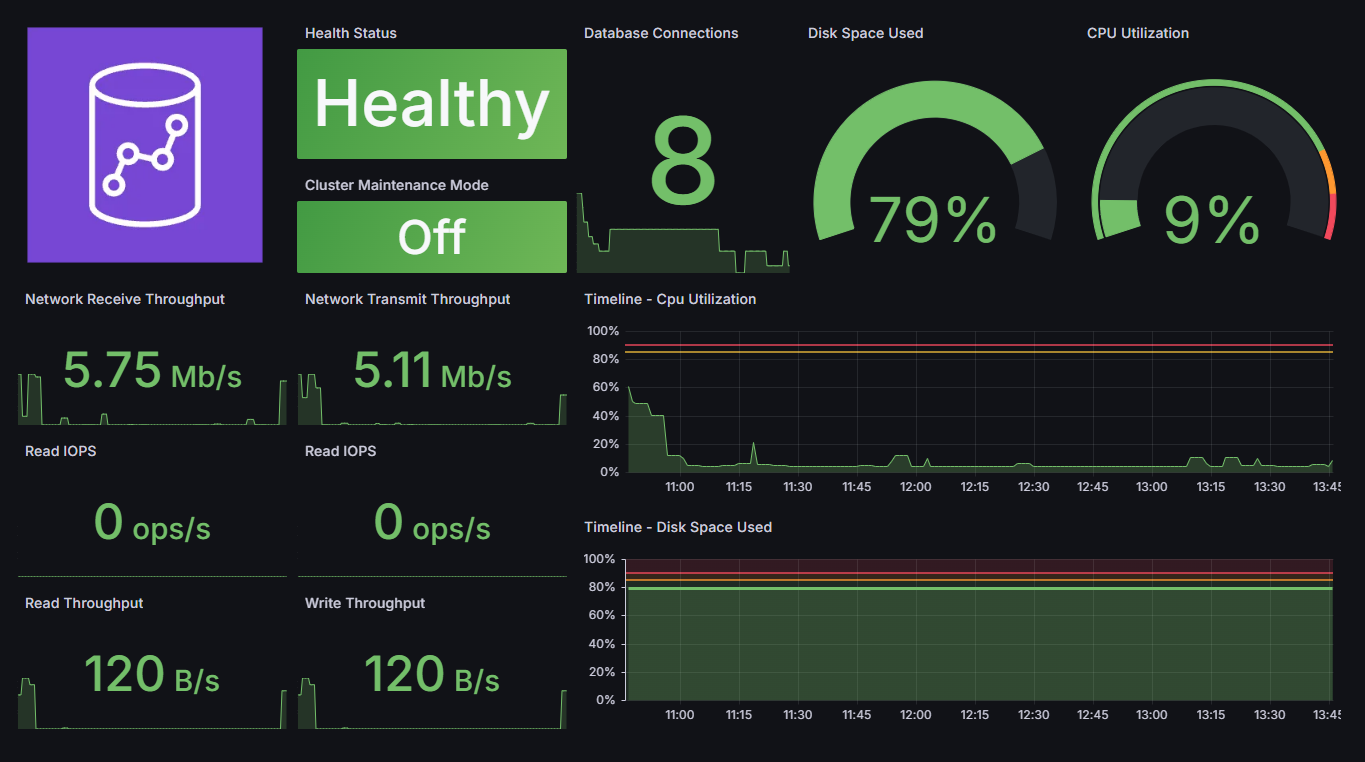
AWS Redshift - Dashboard
Redshift metrics using Python and Zabbix.
Configure the variables within the graphs according to your environment or employ the use of variables within grafana if you have multiple redshift clusters.
Data source config
Collector type:
Collector plugins:
Collector config:
Revisions
Upload an updated version of an exported dashboard.json file from Grafana
| Revision | Description | Created | |
|---|---|---|---|
| Download |
AWS
Easily visualize and alert on more than 60 Amazon Web Services (AWS) resources using the fully managed Grafana Cloud platform.
Learn more