Gigamon Troubleshooting Dashboard
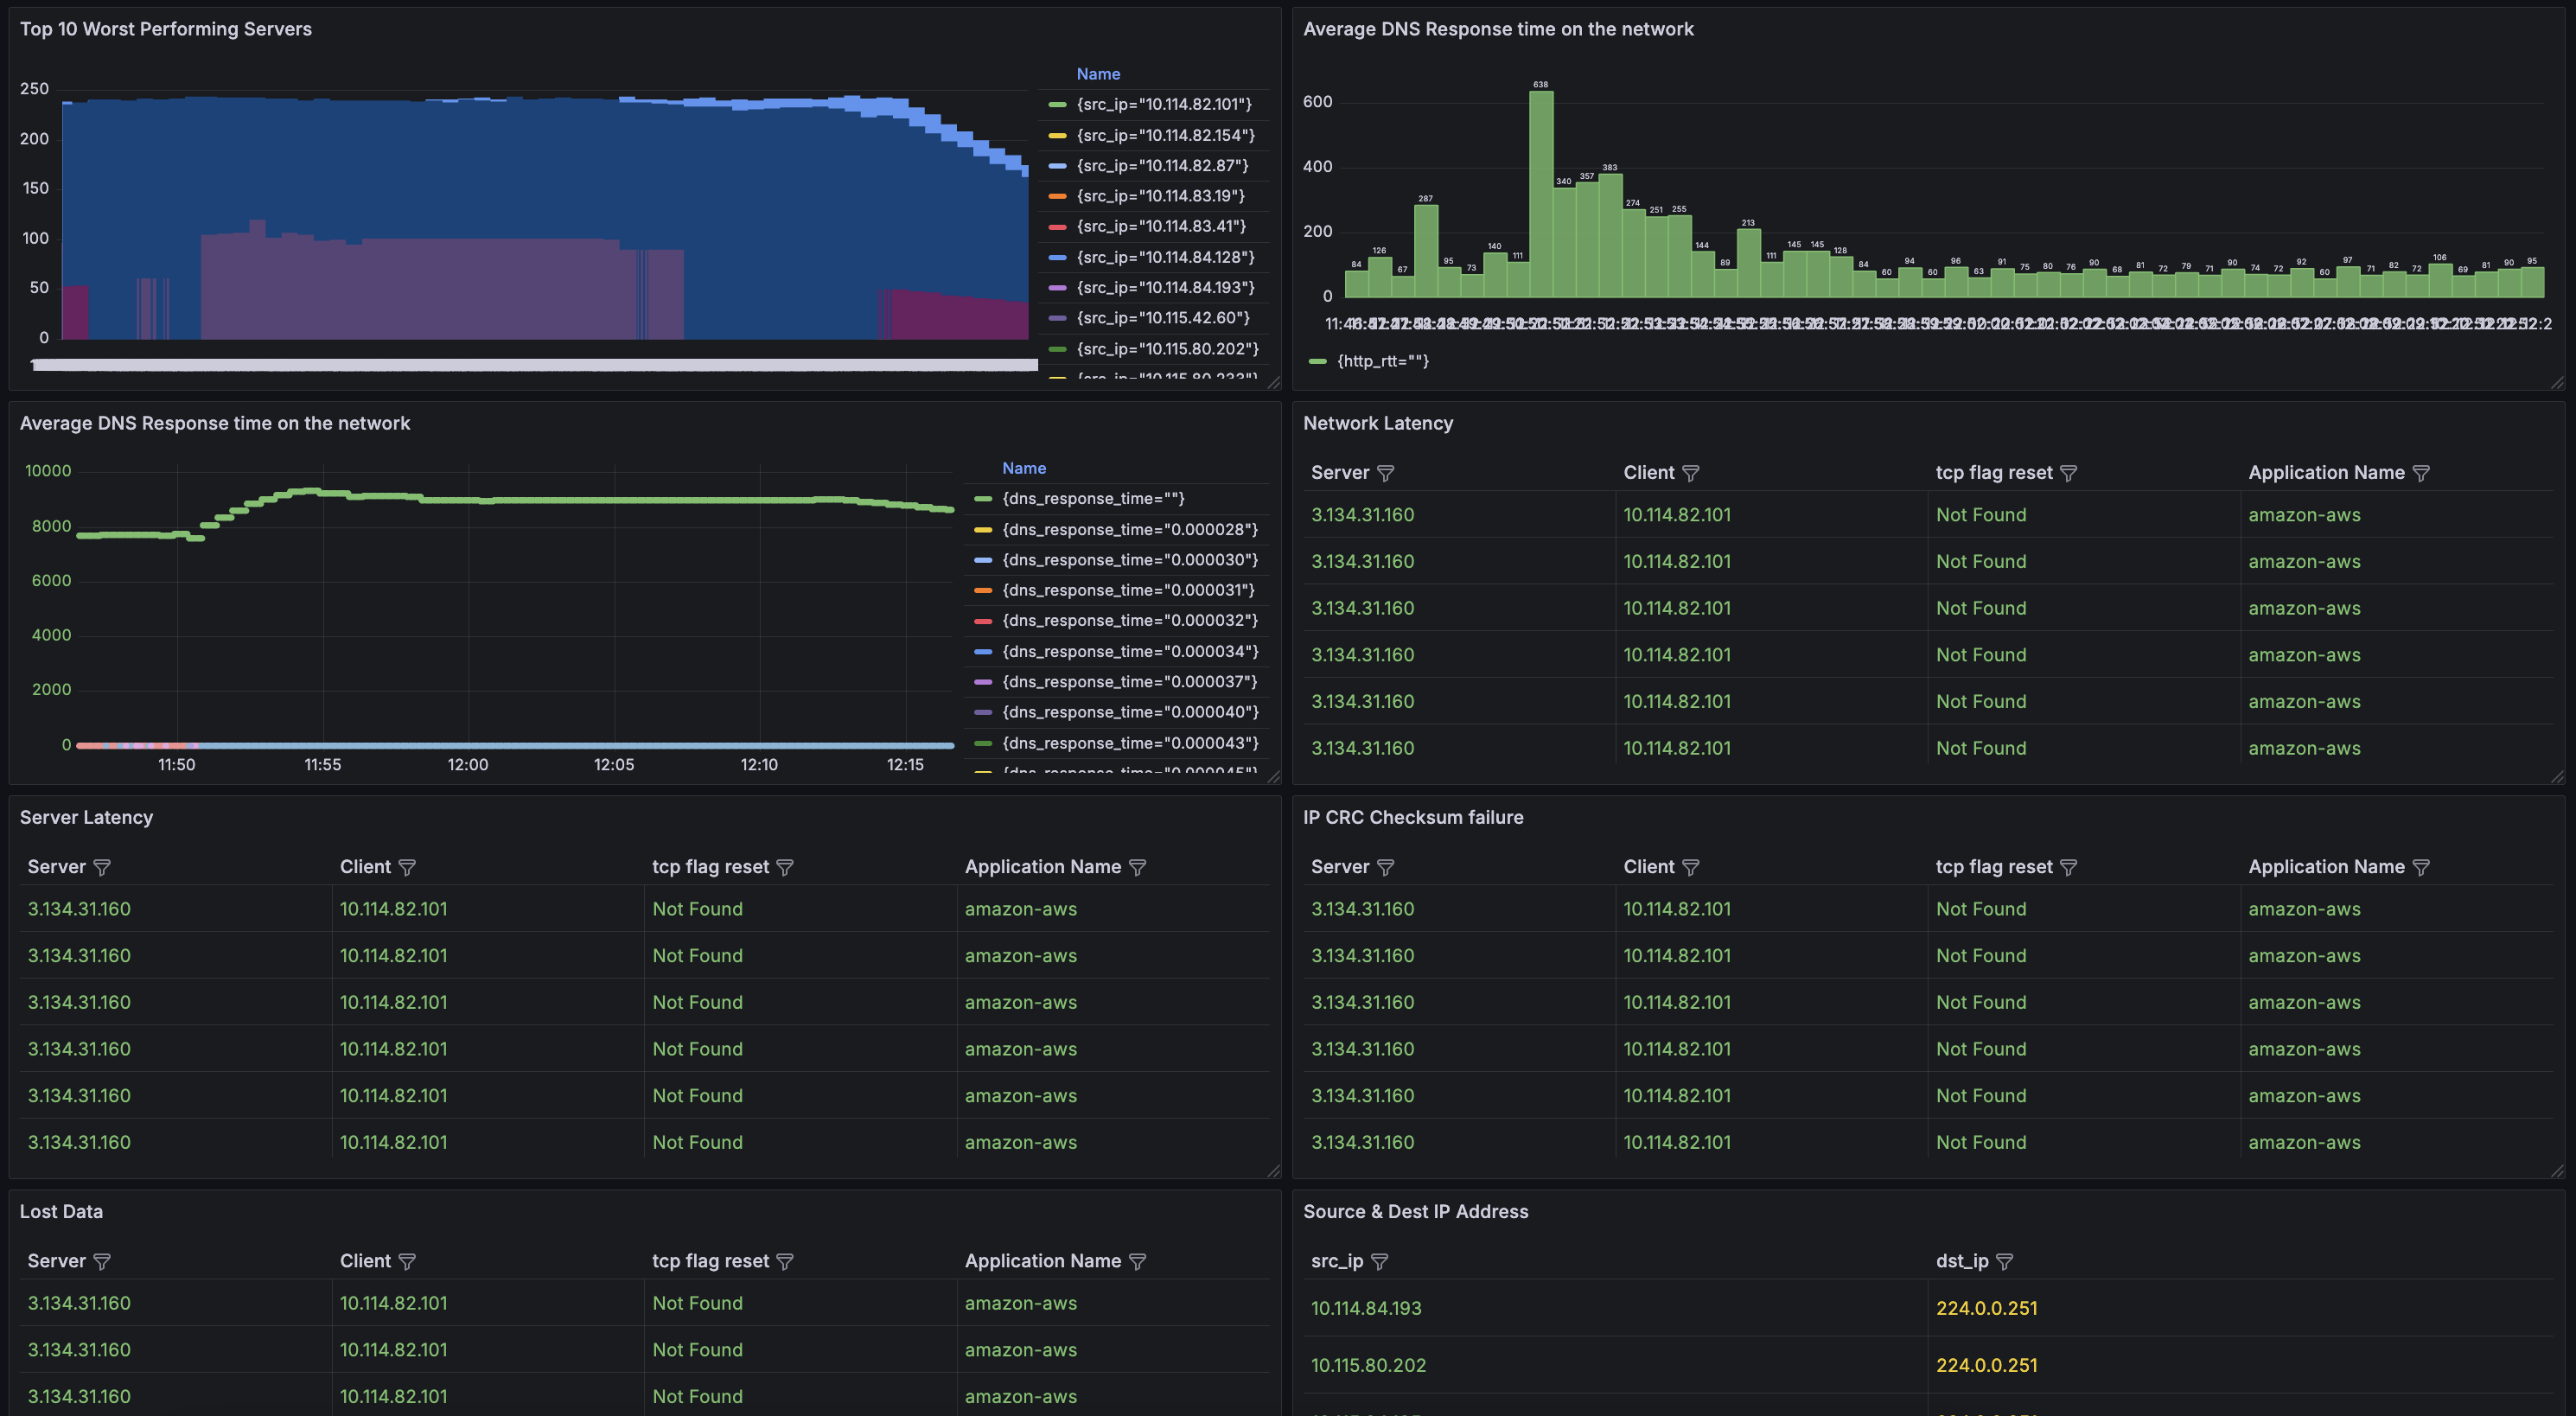
The Top Troubleshooting Dashboards provide essential metrics to help identify and resolve performance issues within your network. Key features include a view of the top worst-performing servers, enabling quick identification of servers that may require attention. The dashboard also monitors average web and DNS response times, offering insights into potential delays affecting user experience.
The Top Troubleshooting Dashboards provide essential metrics to help identify and resolve performance issues within your network. Key features include a view of the top worst-performing servers, enabling quick identification of servers that may require attention. The dashboard also monitors average web and DNS response times, offering insights into potential delays affecting user experience.
Data source config
Collector config:
Upload an updated version of an exported dashboard.json file from Grafana
| Revision | Description | Created | |
|---|---|---|---|
| Download |