Qnap NAS
Grafana dashboard designed for monitoring QNAP NAS systems using Telegraf with SNMP input and Prometheus storage.
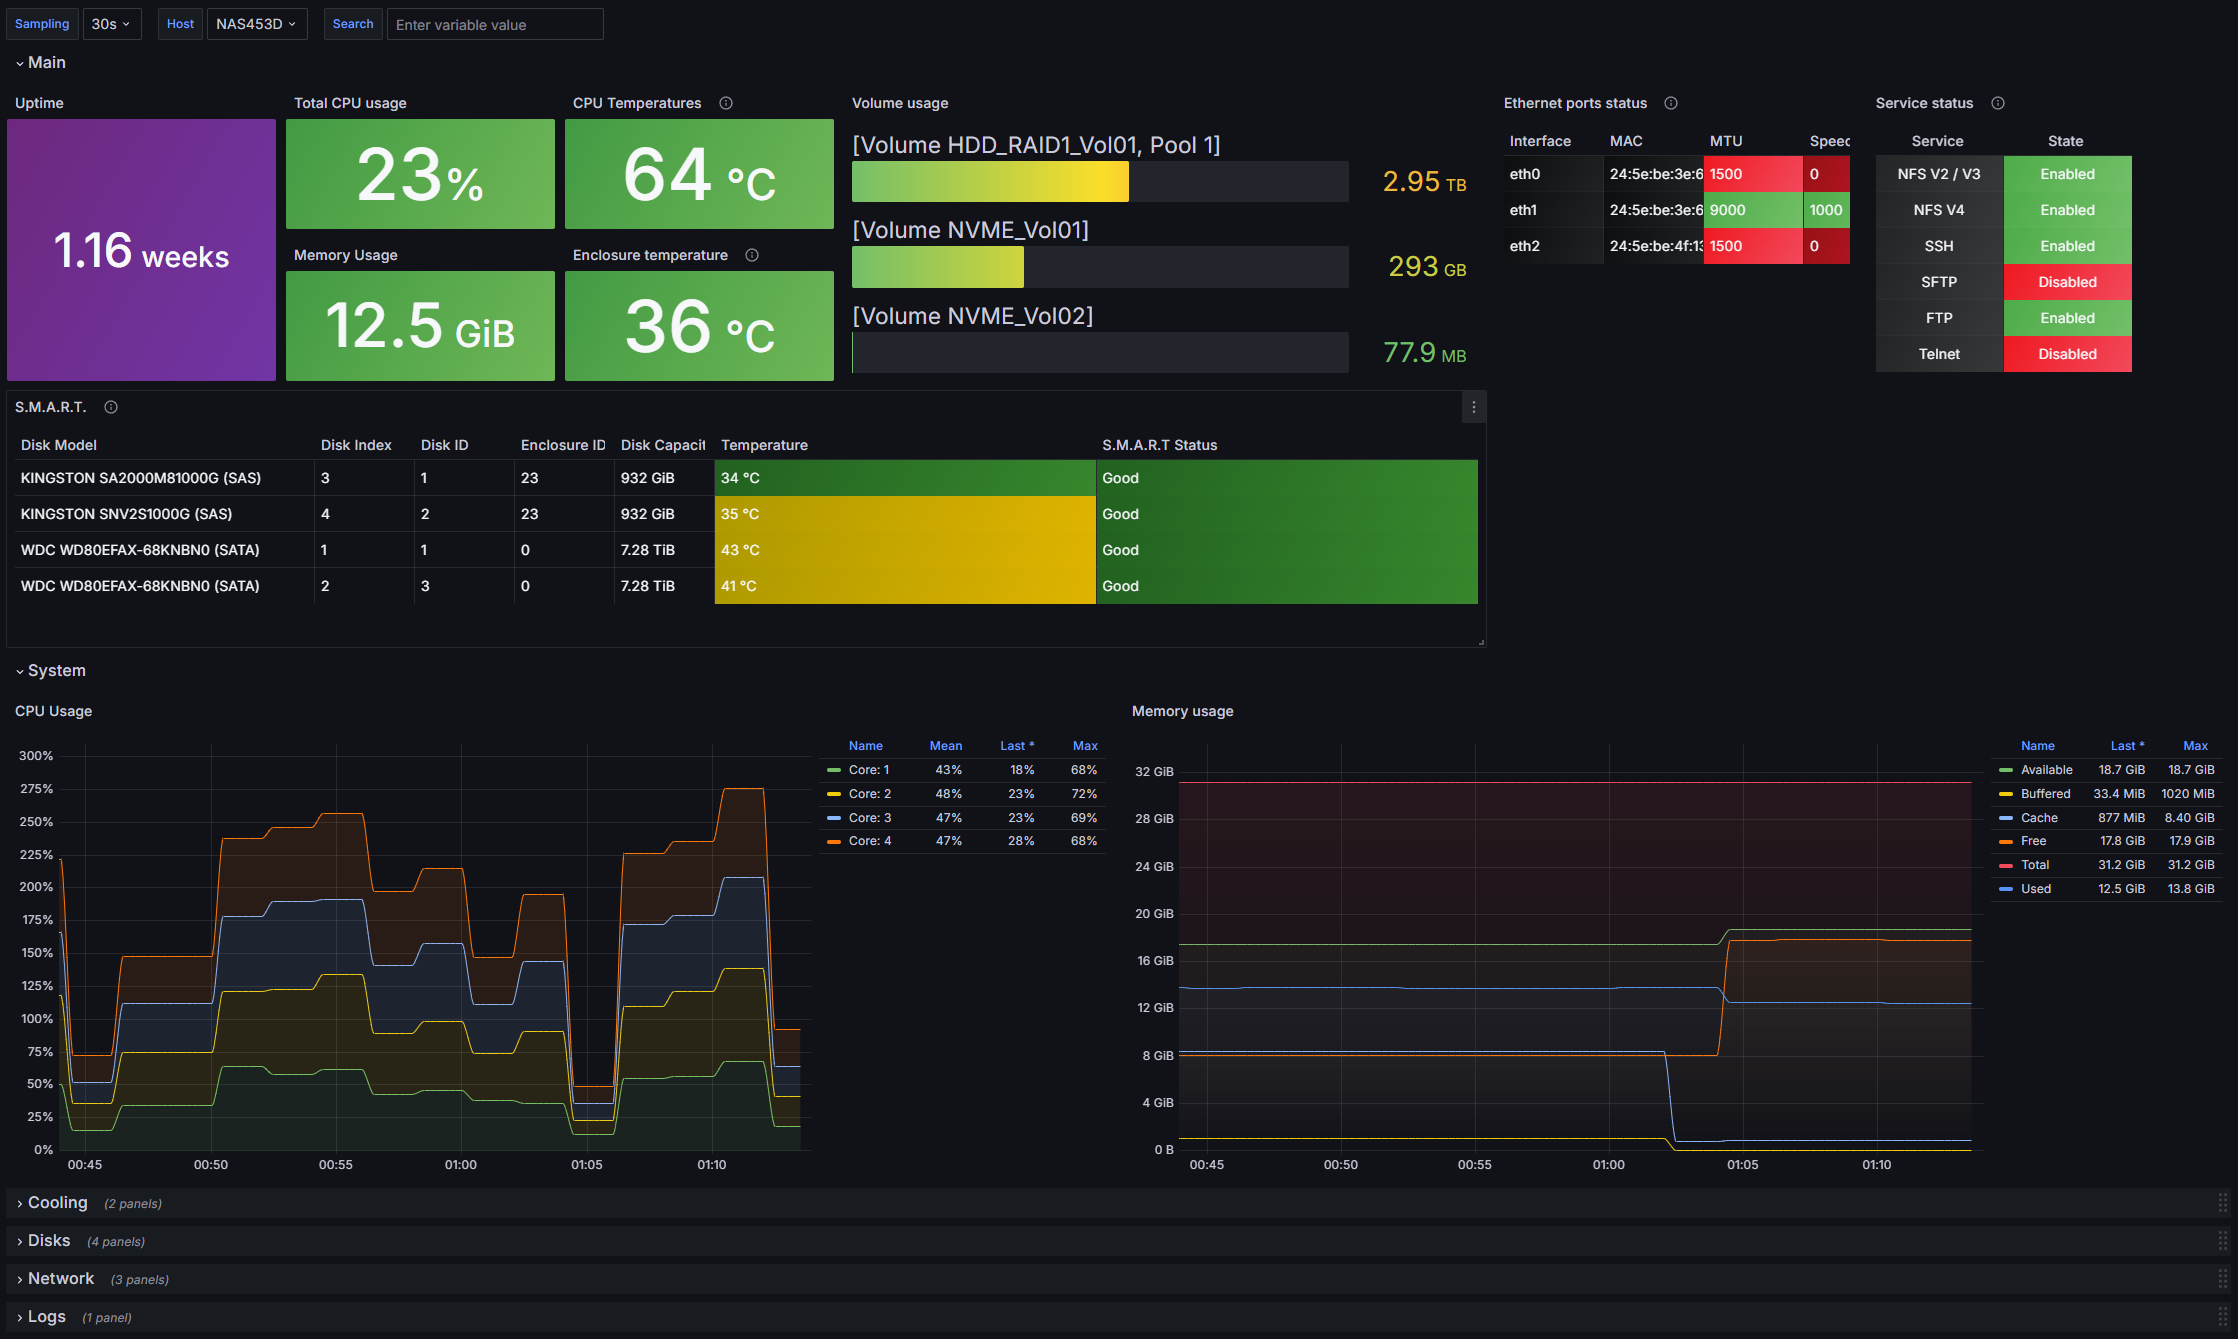
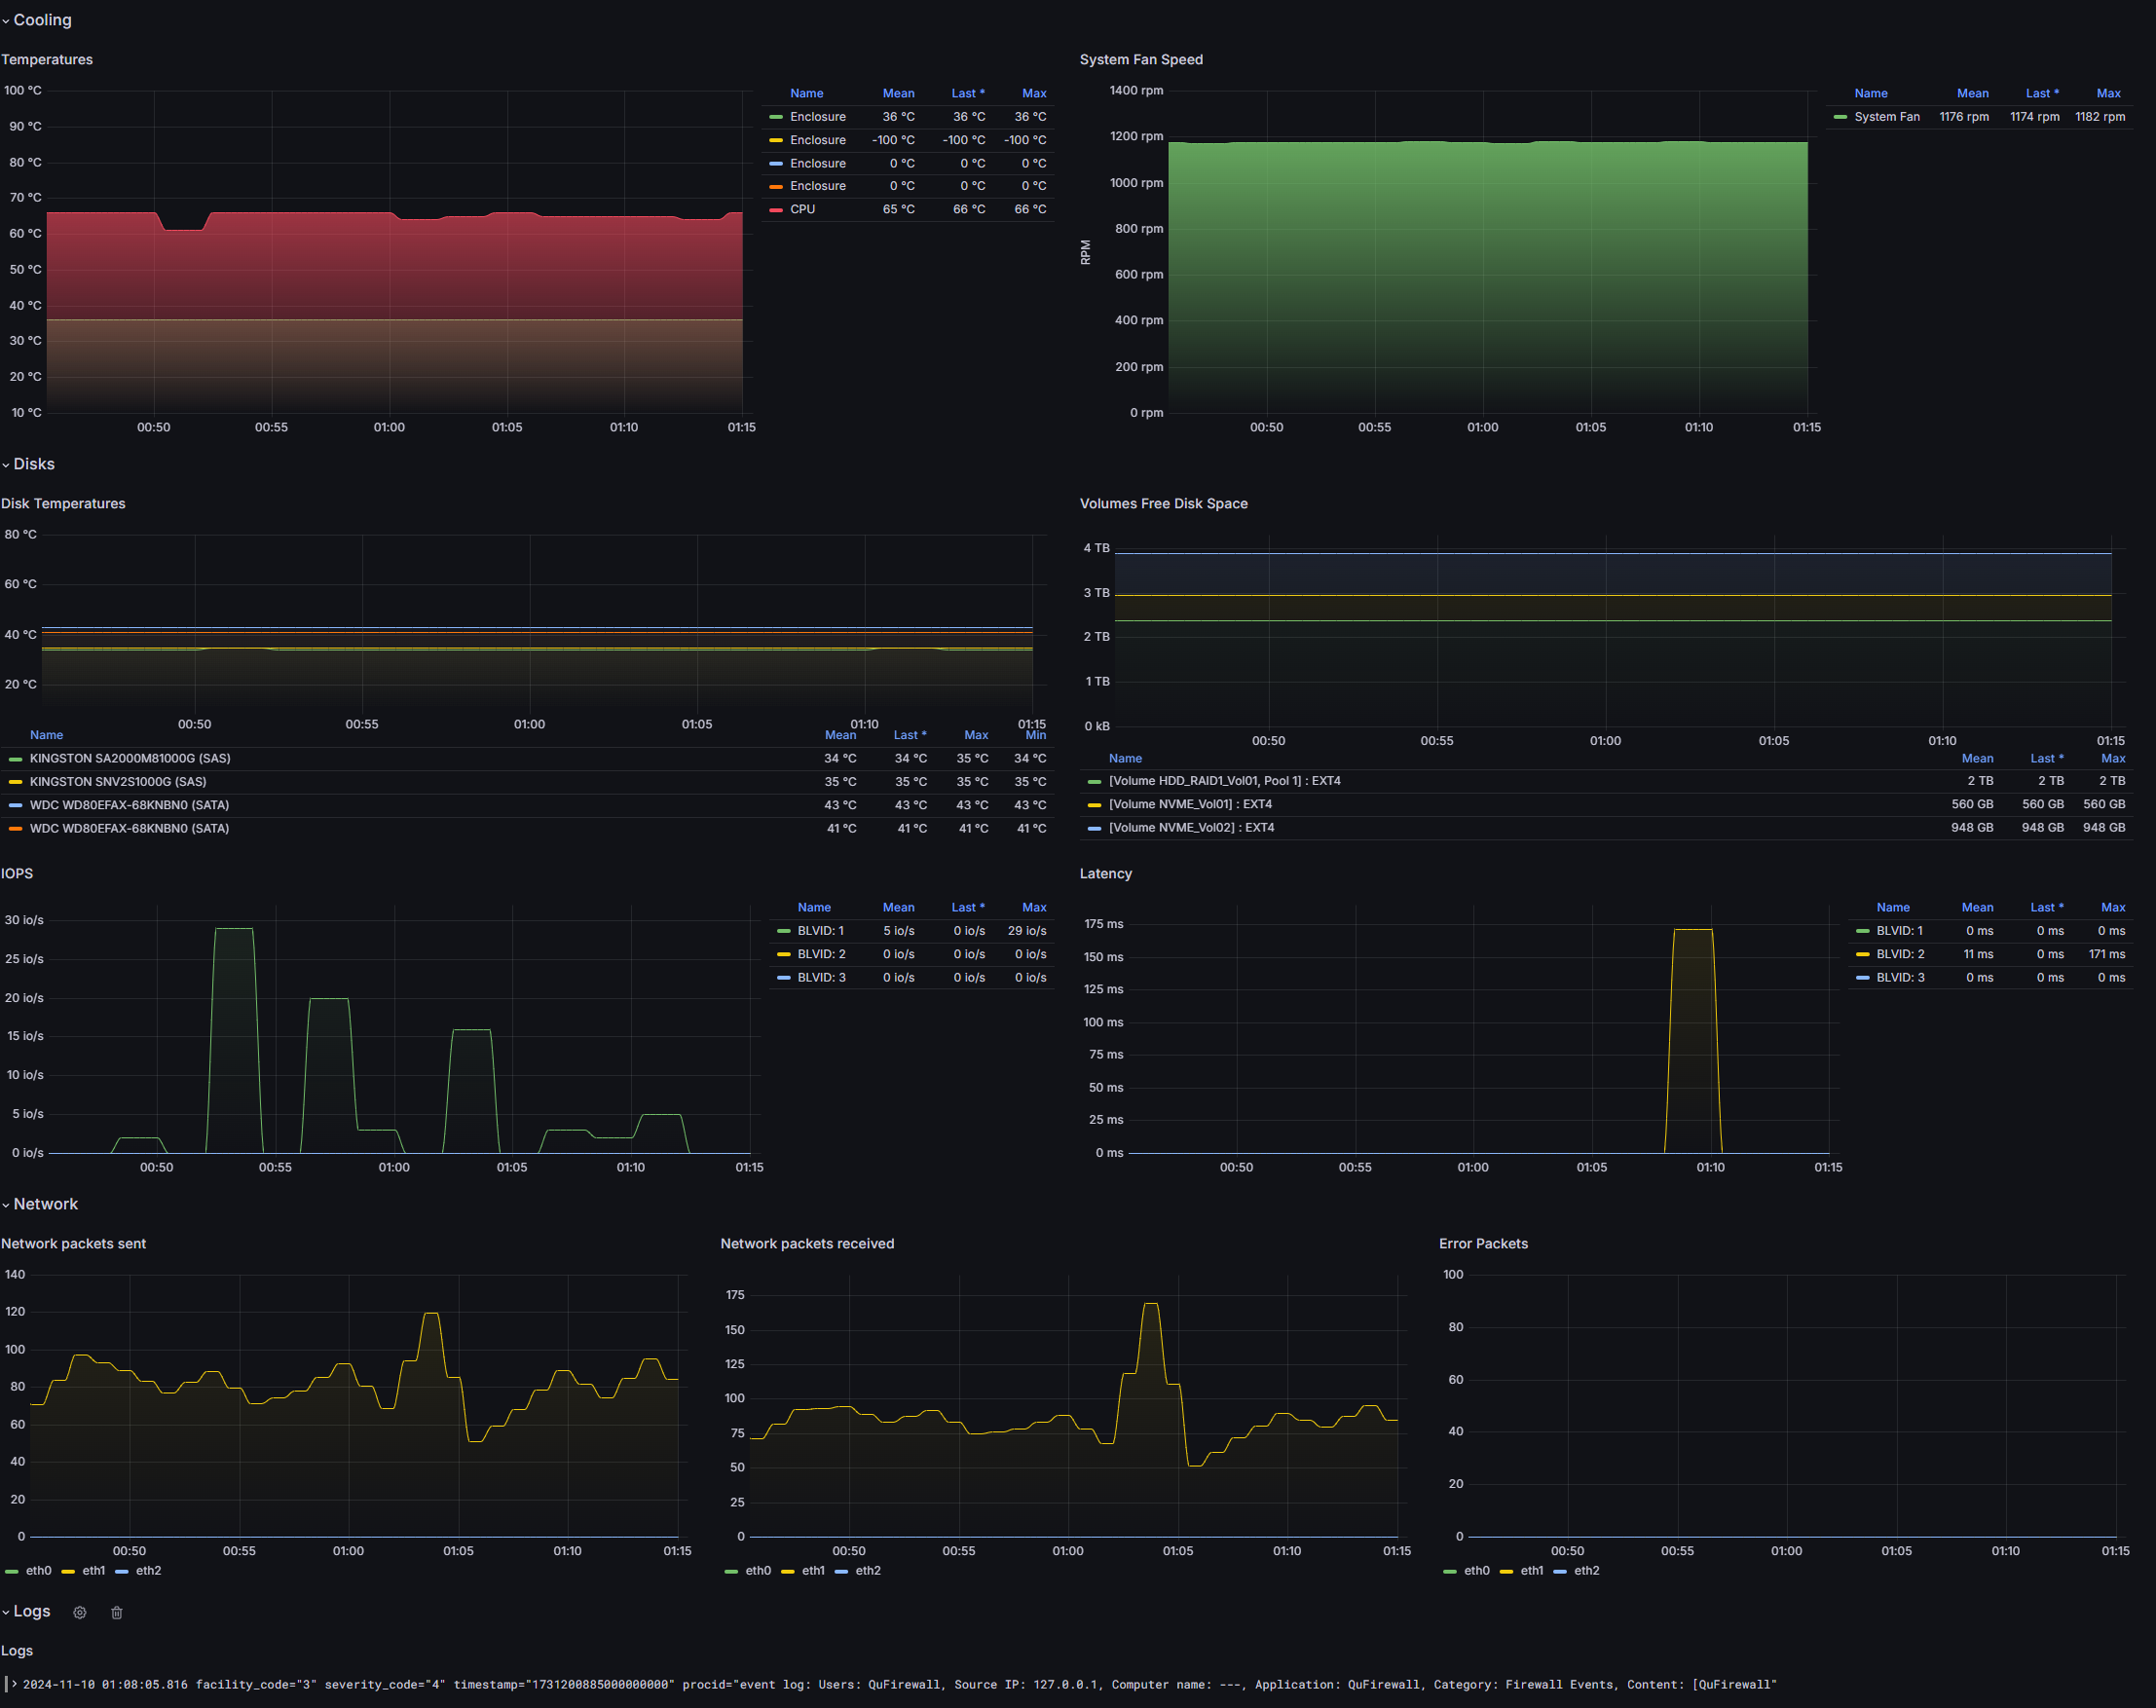
This Grafana dashboard is designed to monitor QNAP NAS systems using Telegraf with SNMP input and Prometheus database. It provides real-time insights and metrics to ensure optimal performance and health of your network attached storage.
It uses Telegraf with SNMP input to collect detailed hardware and system metrics from your QNAP NAS and send them to Prometheus.
Dashboards also support viewing logs from Loki, but currently, you need to send logs from Qnap to Loki yourself.
Helm chart is provided for the collector and Grafana dashboard.
Link to the source code: https://github.com/bsosnowski/qnap-exporter
Data source config
Collector config:
Upload an updated version of an exported dashboard.json file from Grafana
| Revision | Description | Created | |
|---|---|---|---|
| Download |