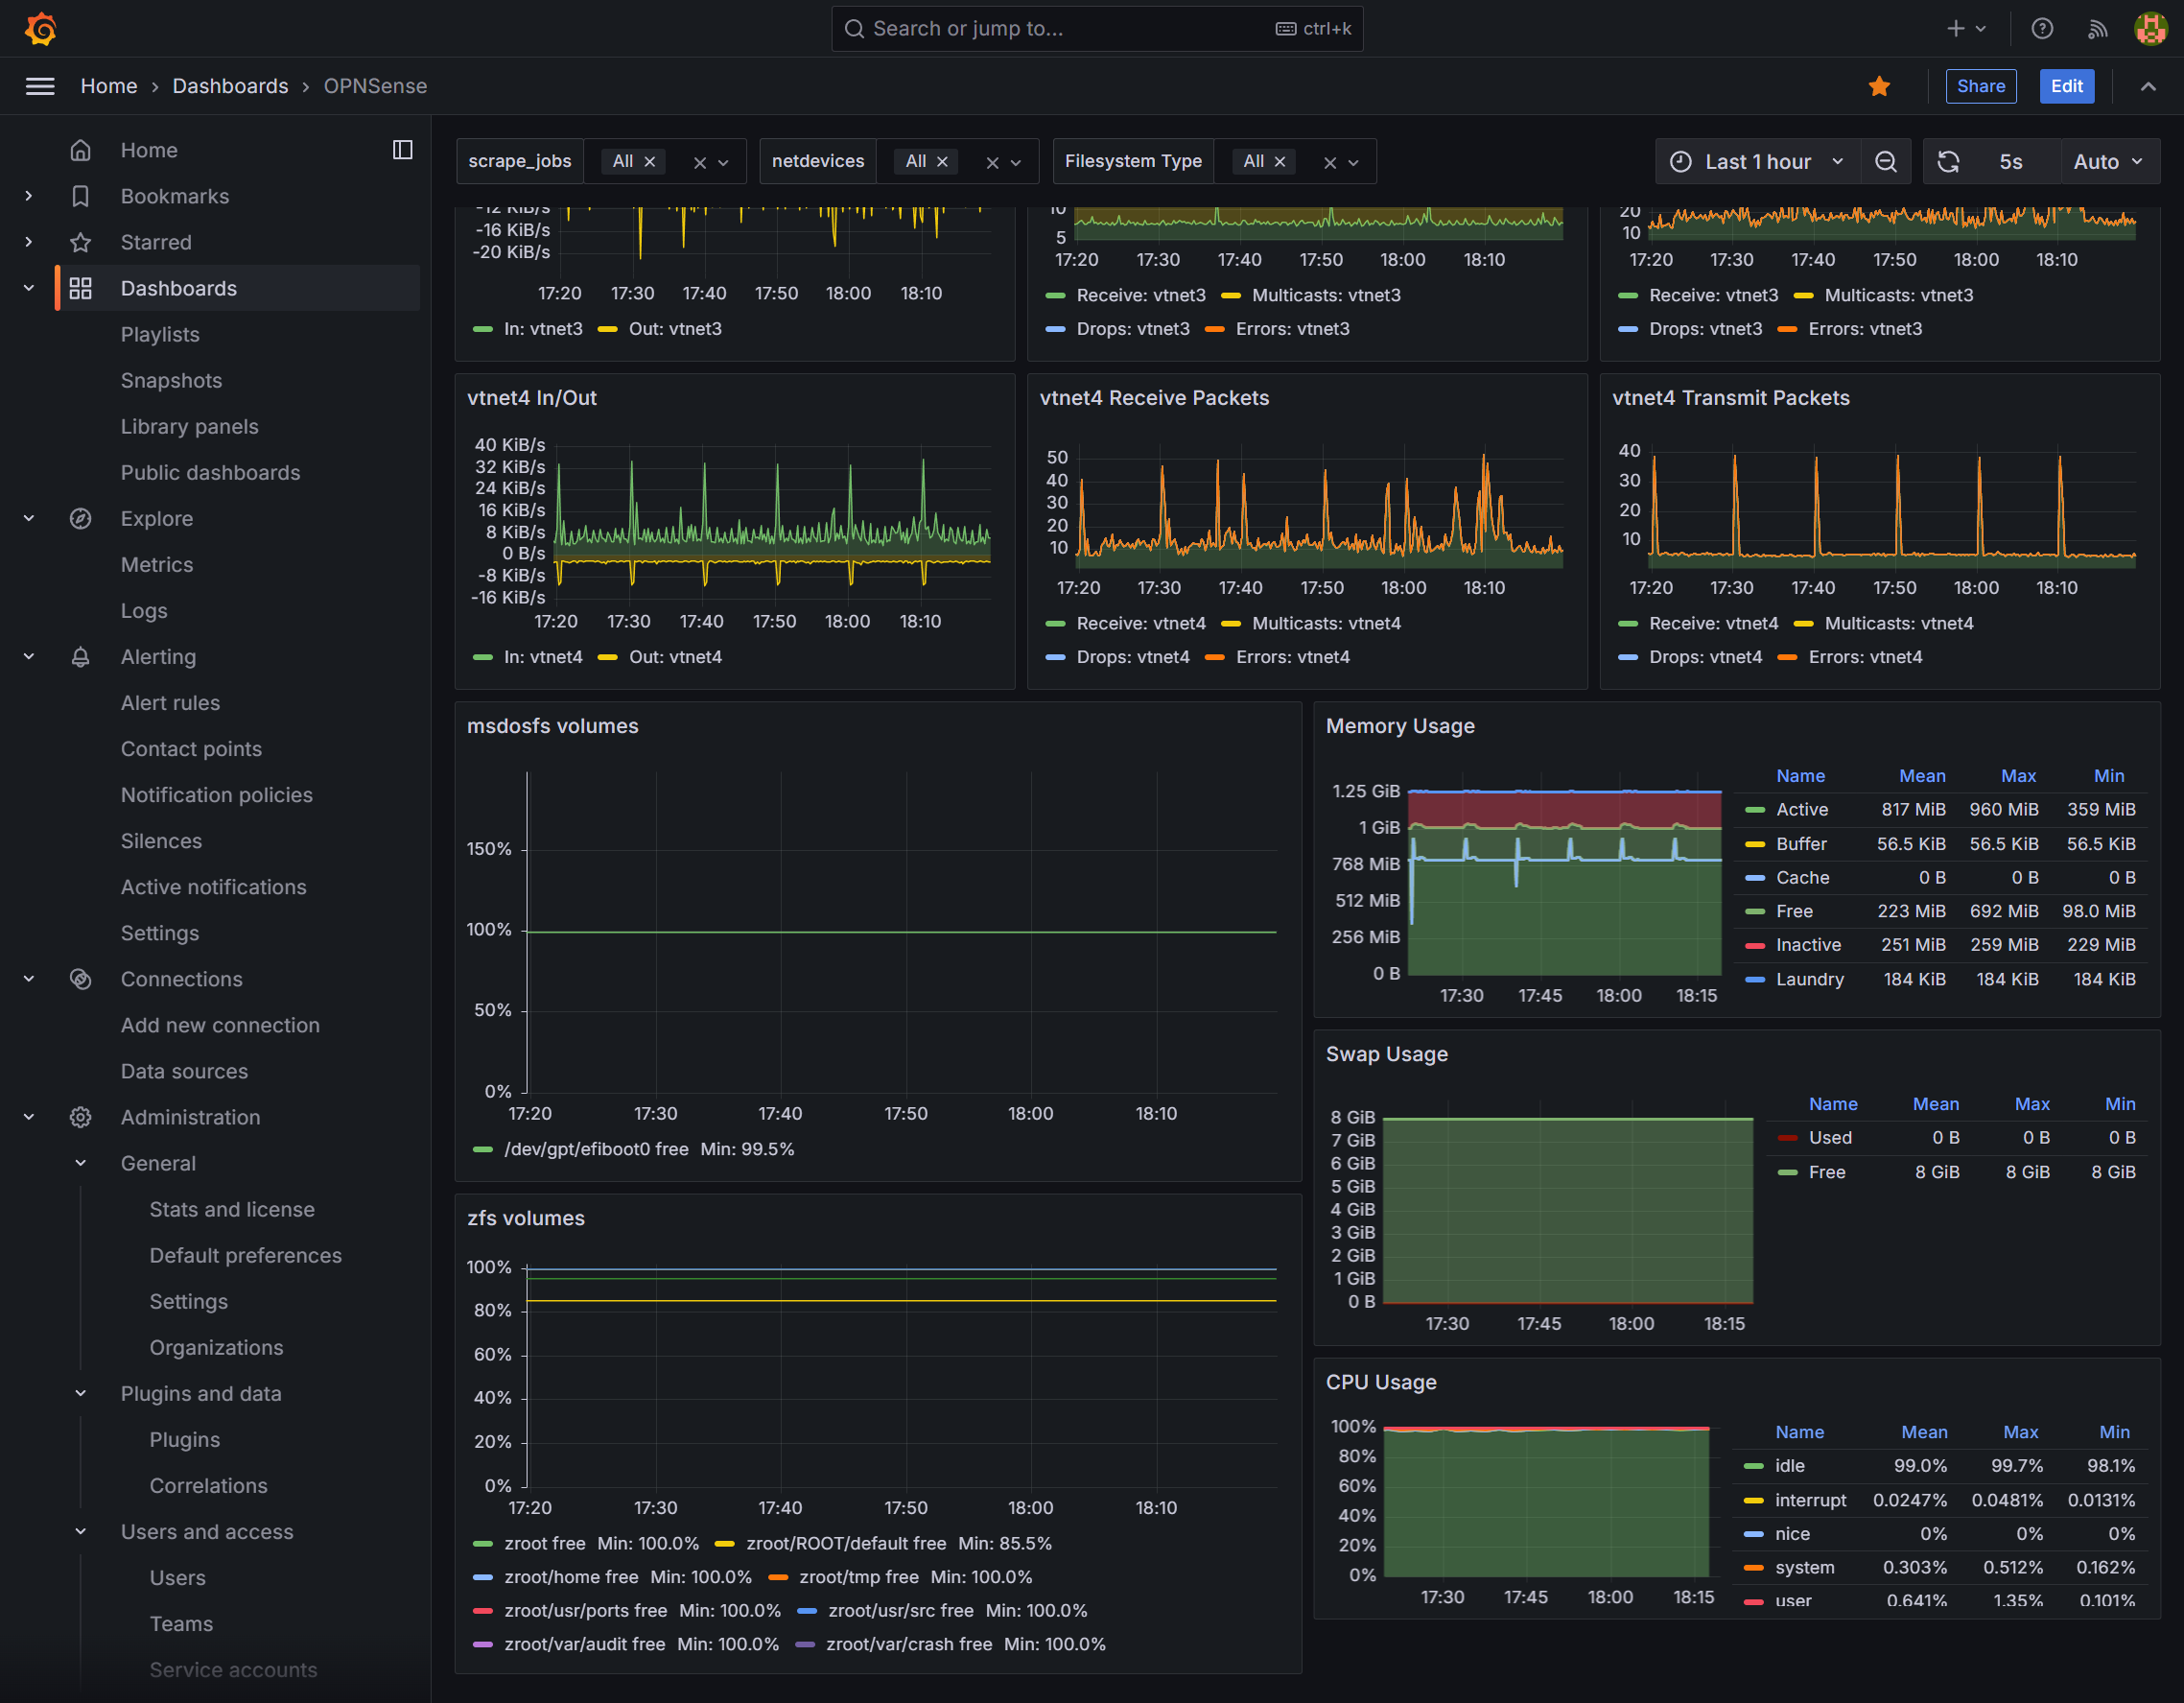
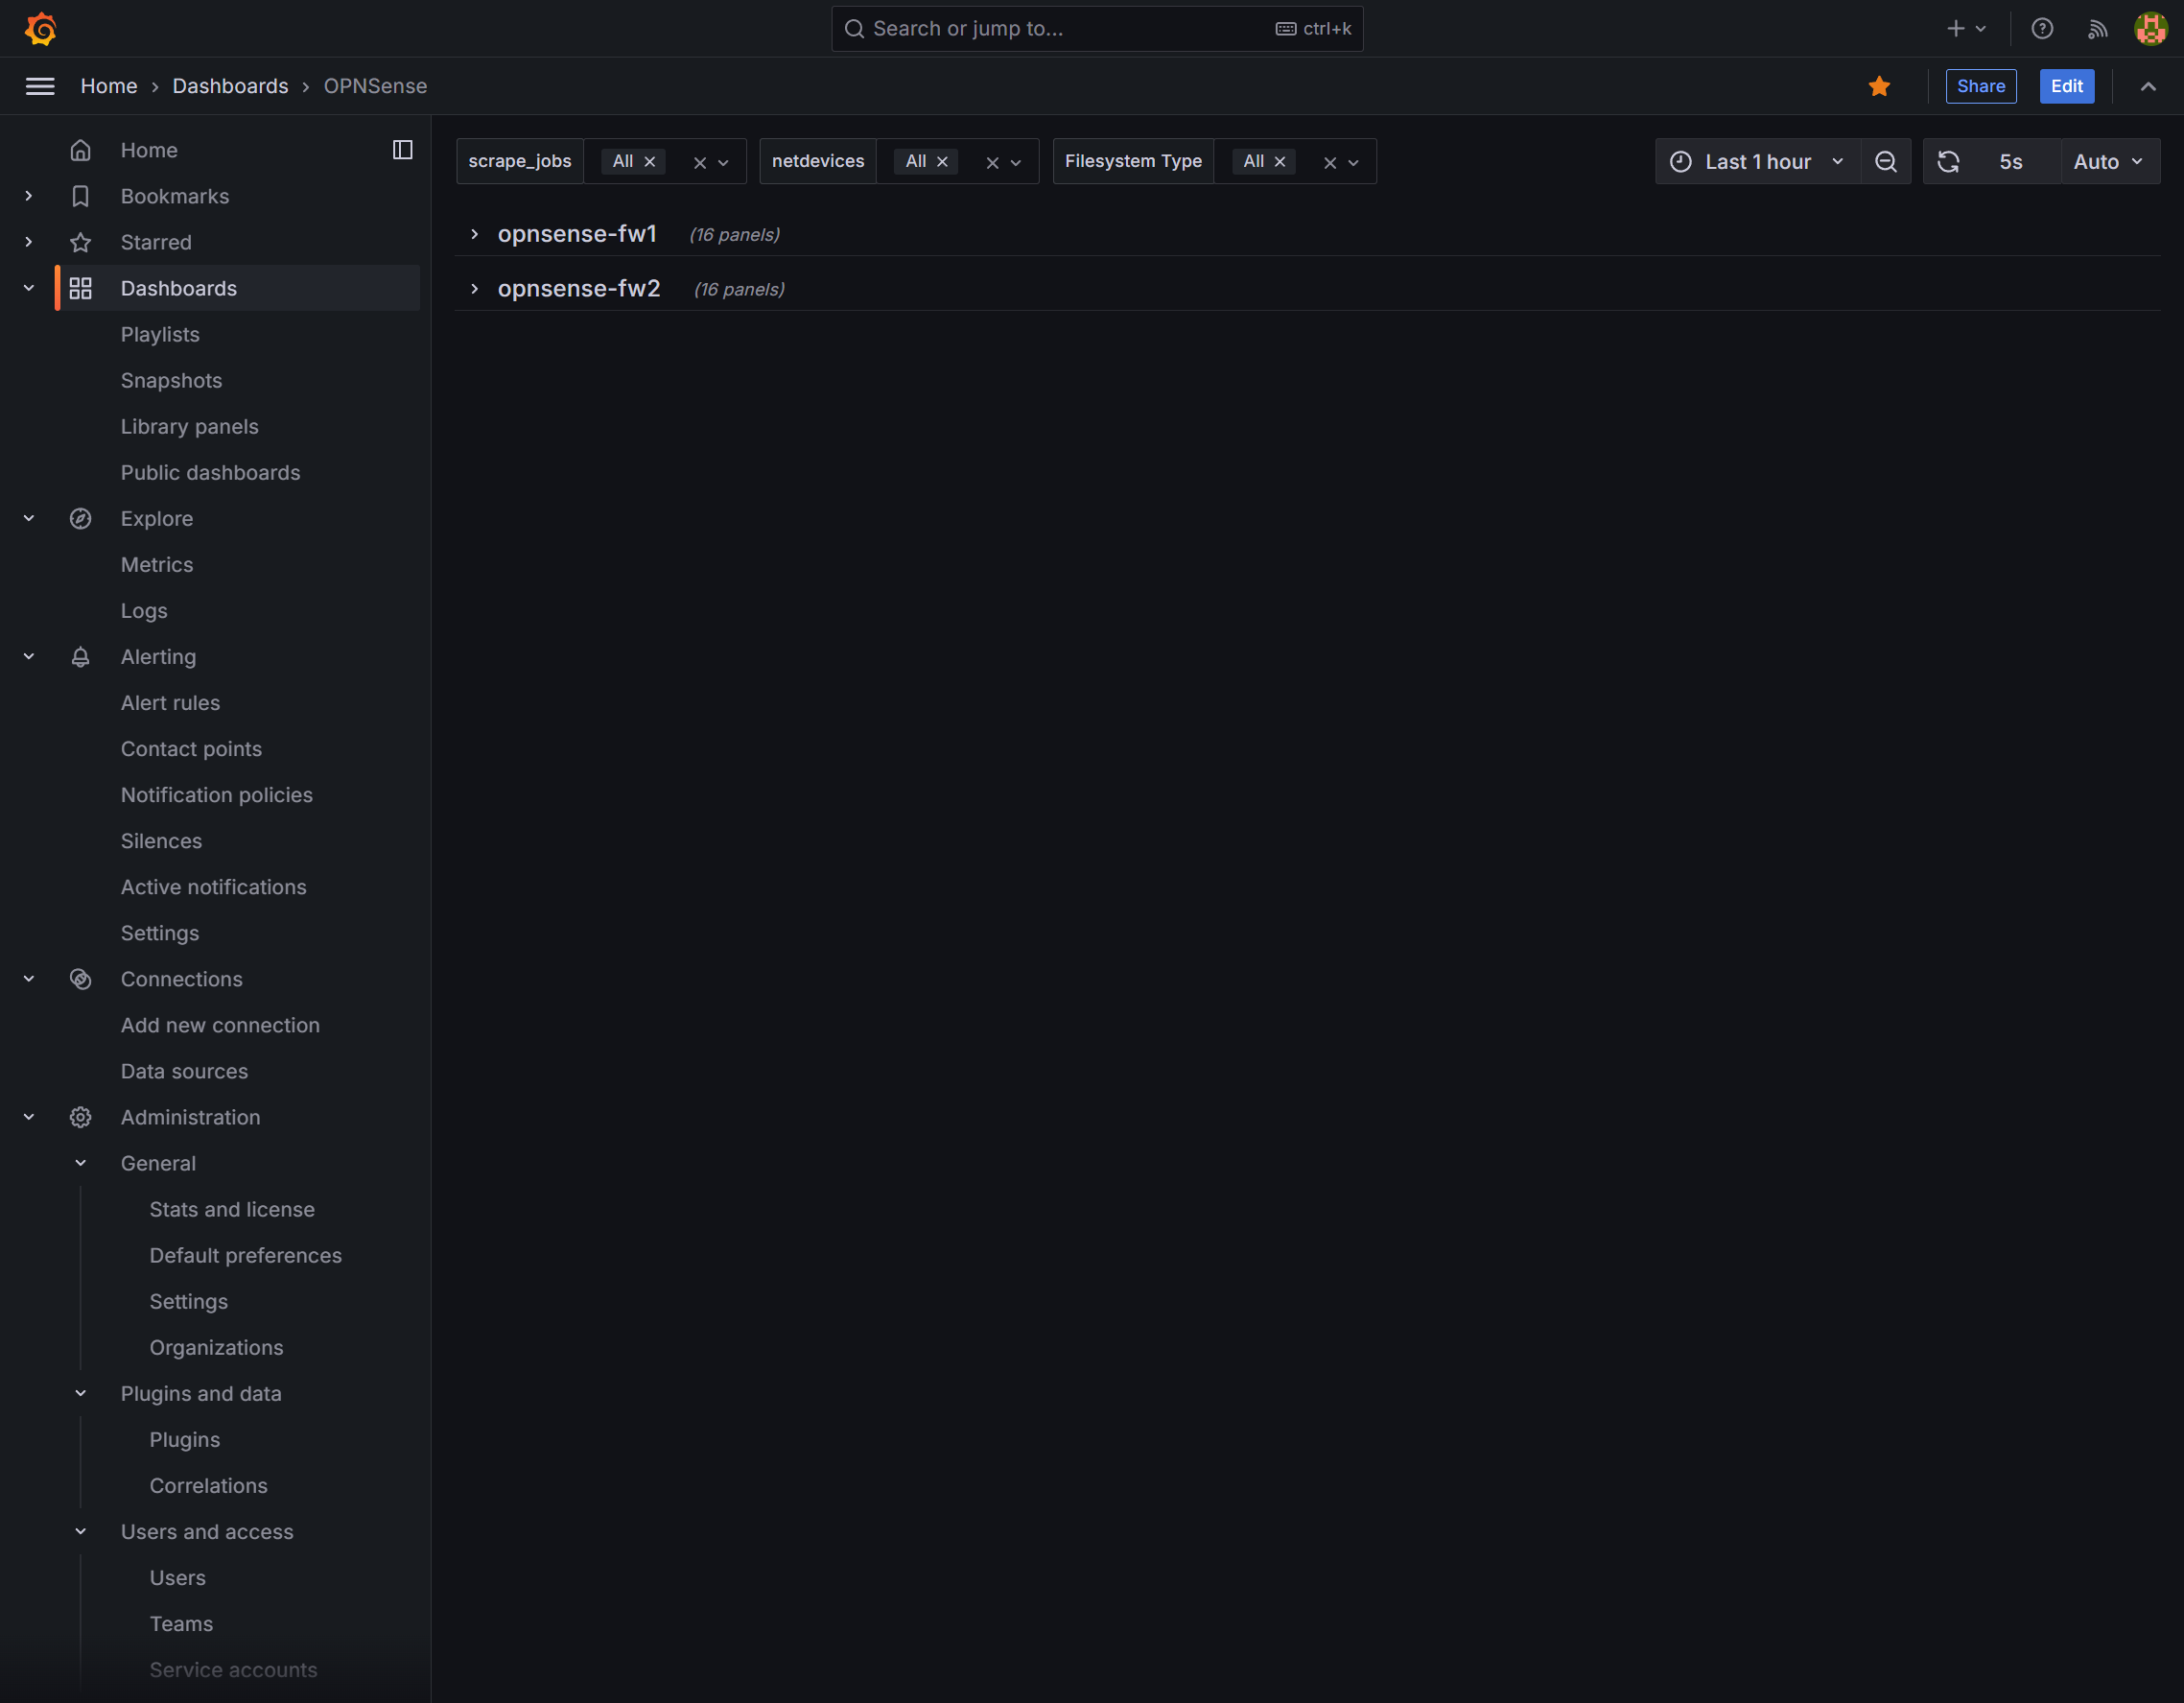
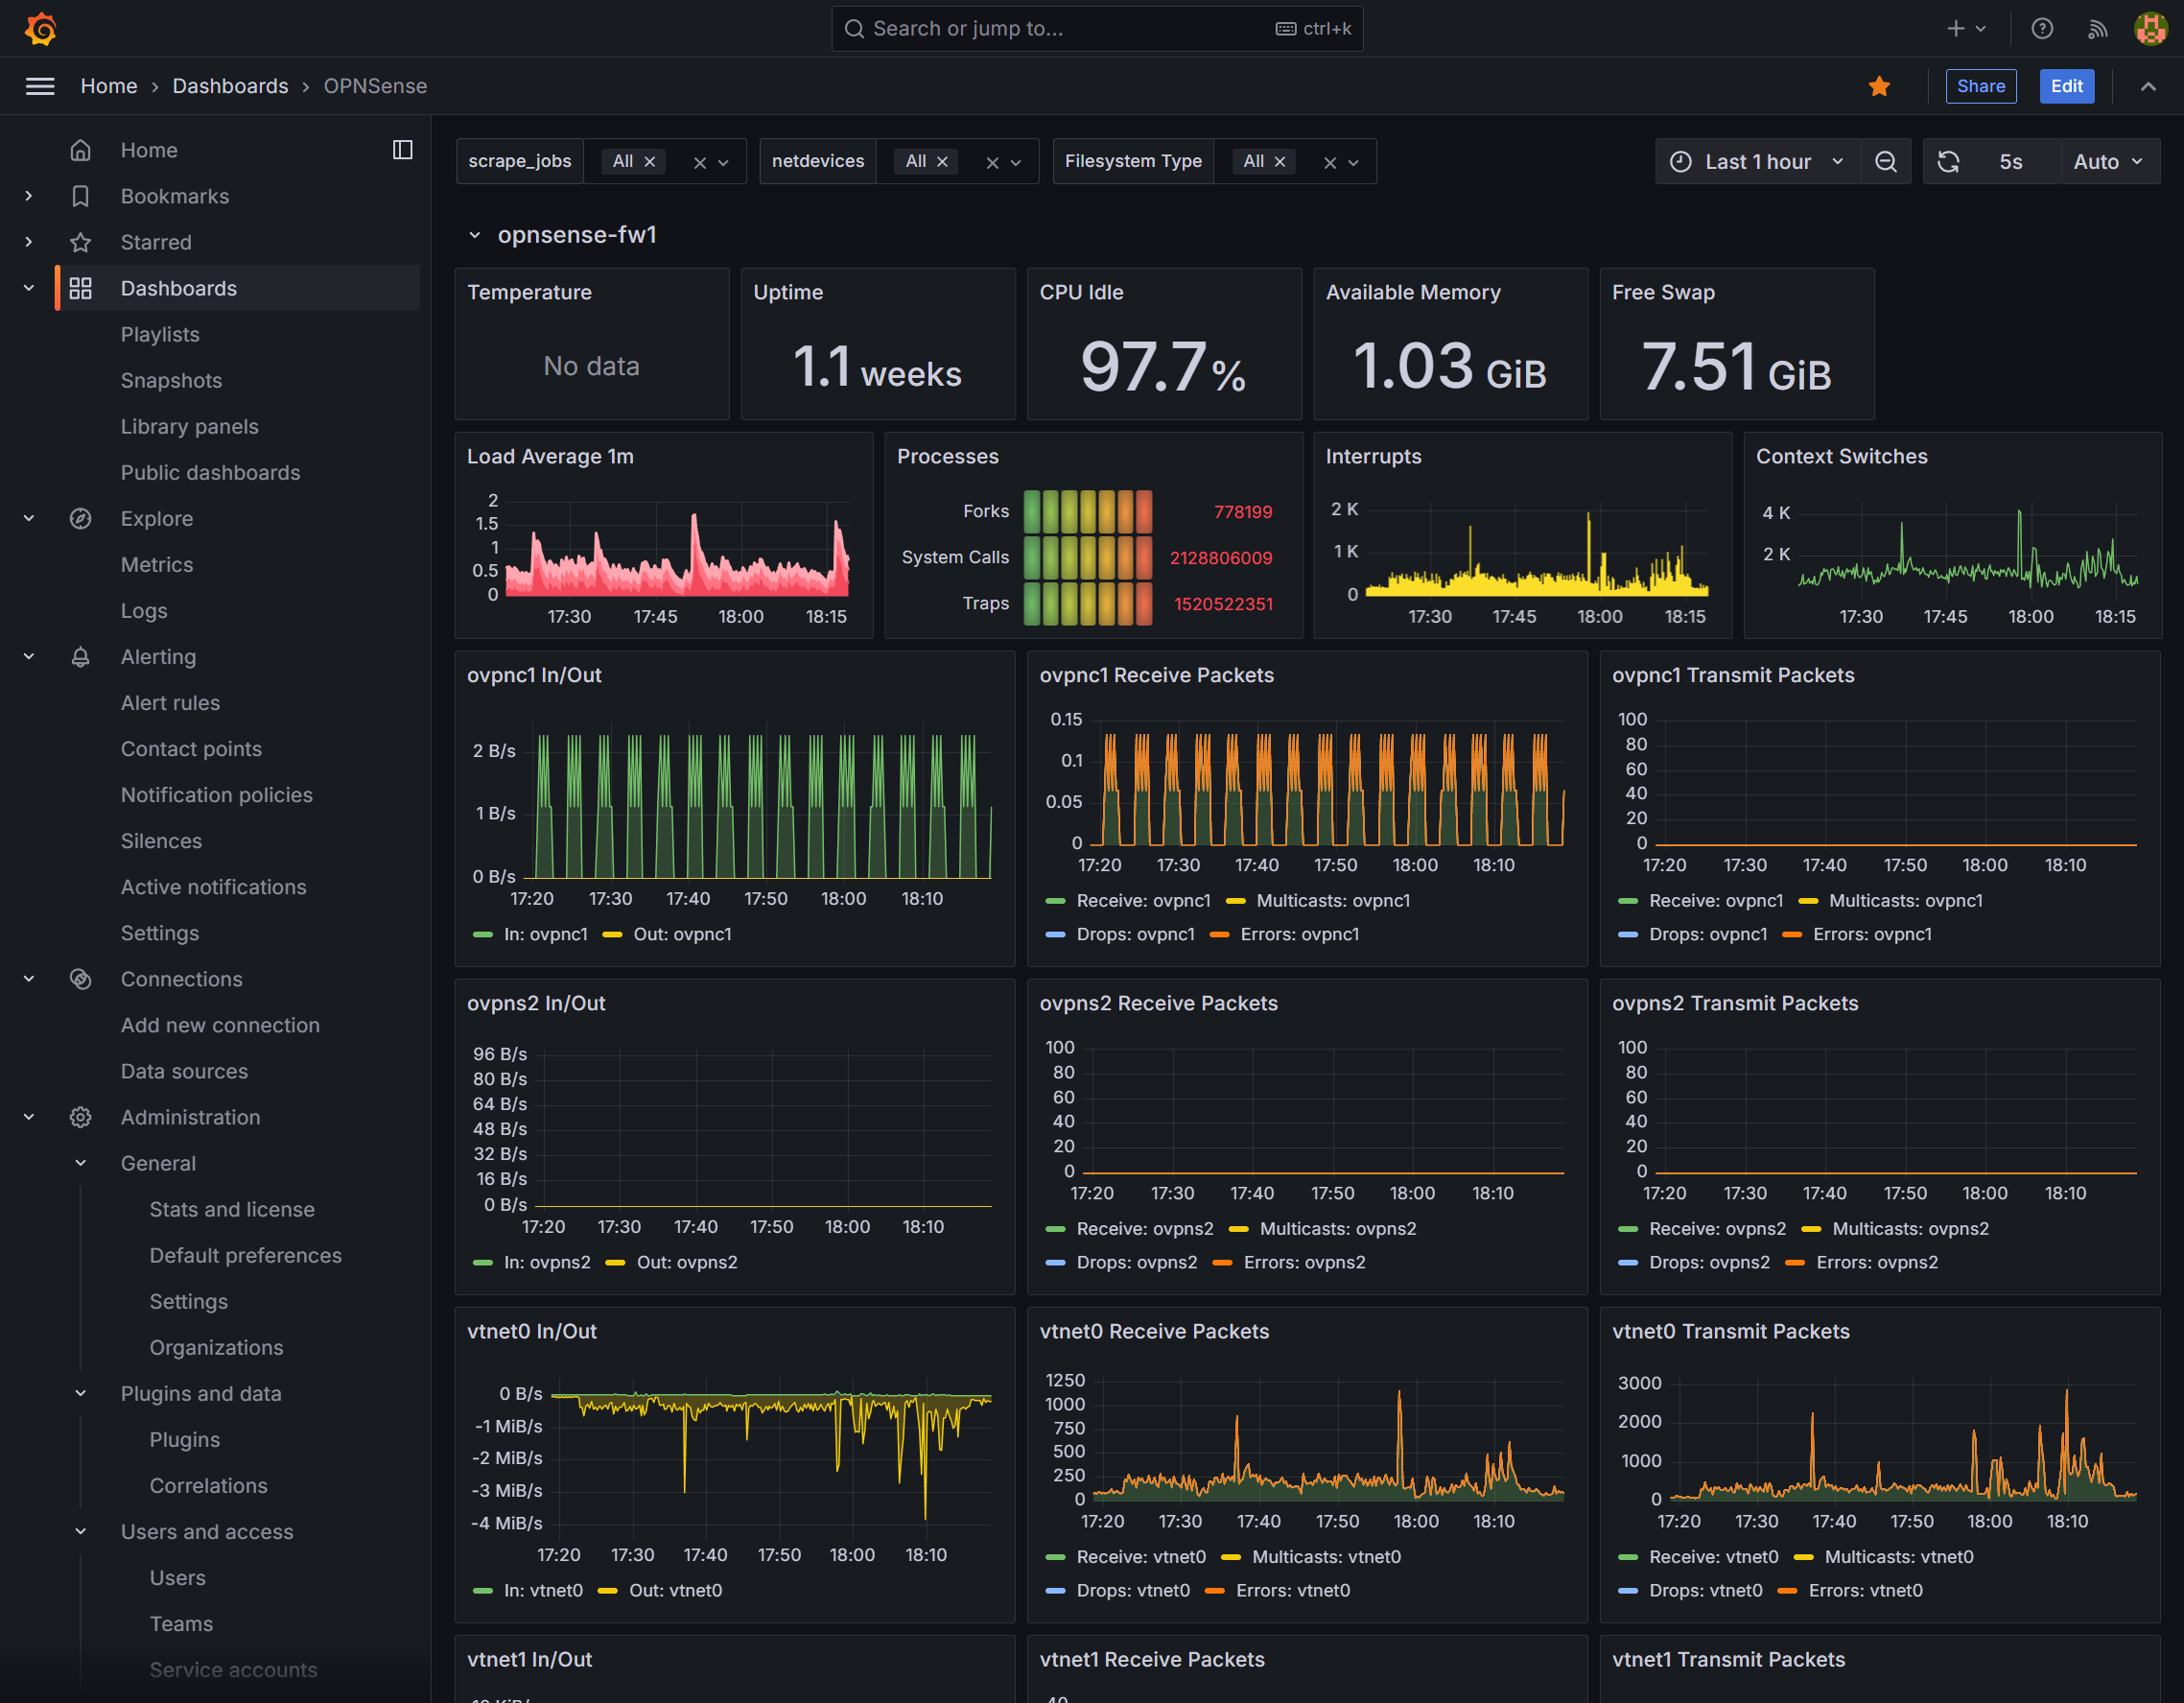
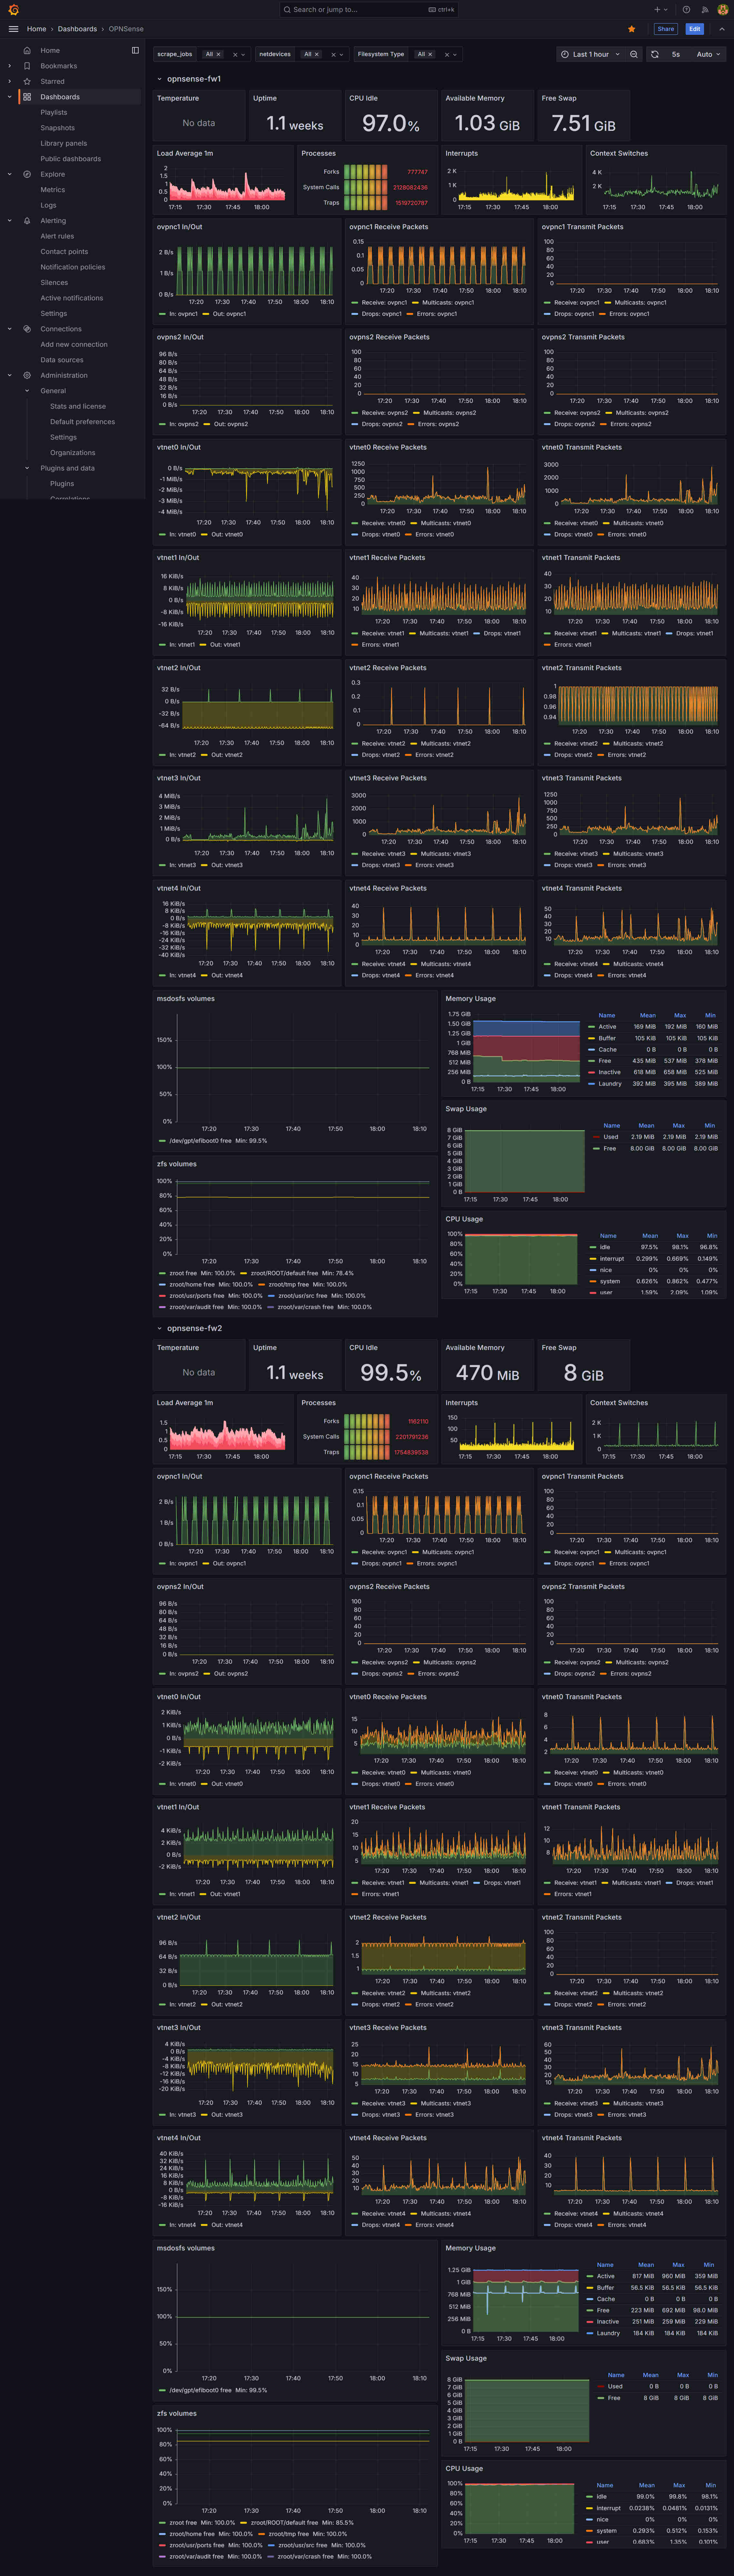
OPNSense
OPNSense basic metrics
Install in three easy steps
Install Prometheus Node Exporter Plugin on OPNSense
Add Scrape Config to Prometheus
- job_name: opnsense-<OPNSense NAME> static_configs: - targets: [<OPNSense IP/FQDN>:9100]- job_name have to start with "opnsense"
- to be substituted by firewall name (you can have all your firewalls visible on one dashboard at once, so they need to have unique names)
- <OPNSense IP/FQDN> to be substituted by IP or FQDN of the firewall
Add Dashboard to Grafana.
Data source config
Collector type:
Collector plugins:
Collector config:
Revisions
Upload an updated version of an exported dashboard.json file from Grafana
| Revision | Description | Created | |
|---|---|---|---|
| Download |