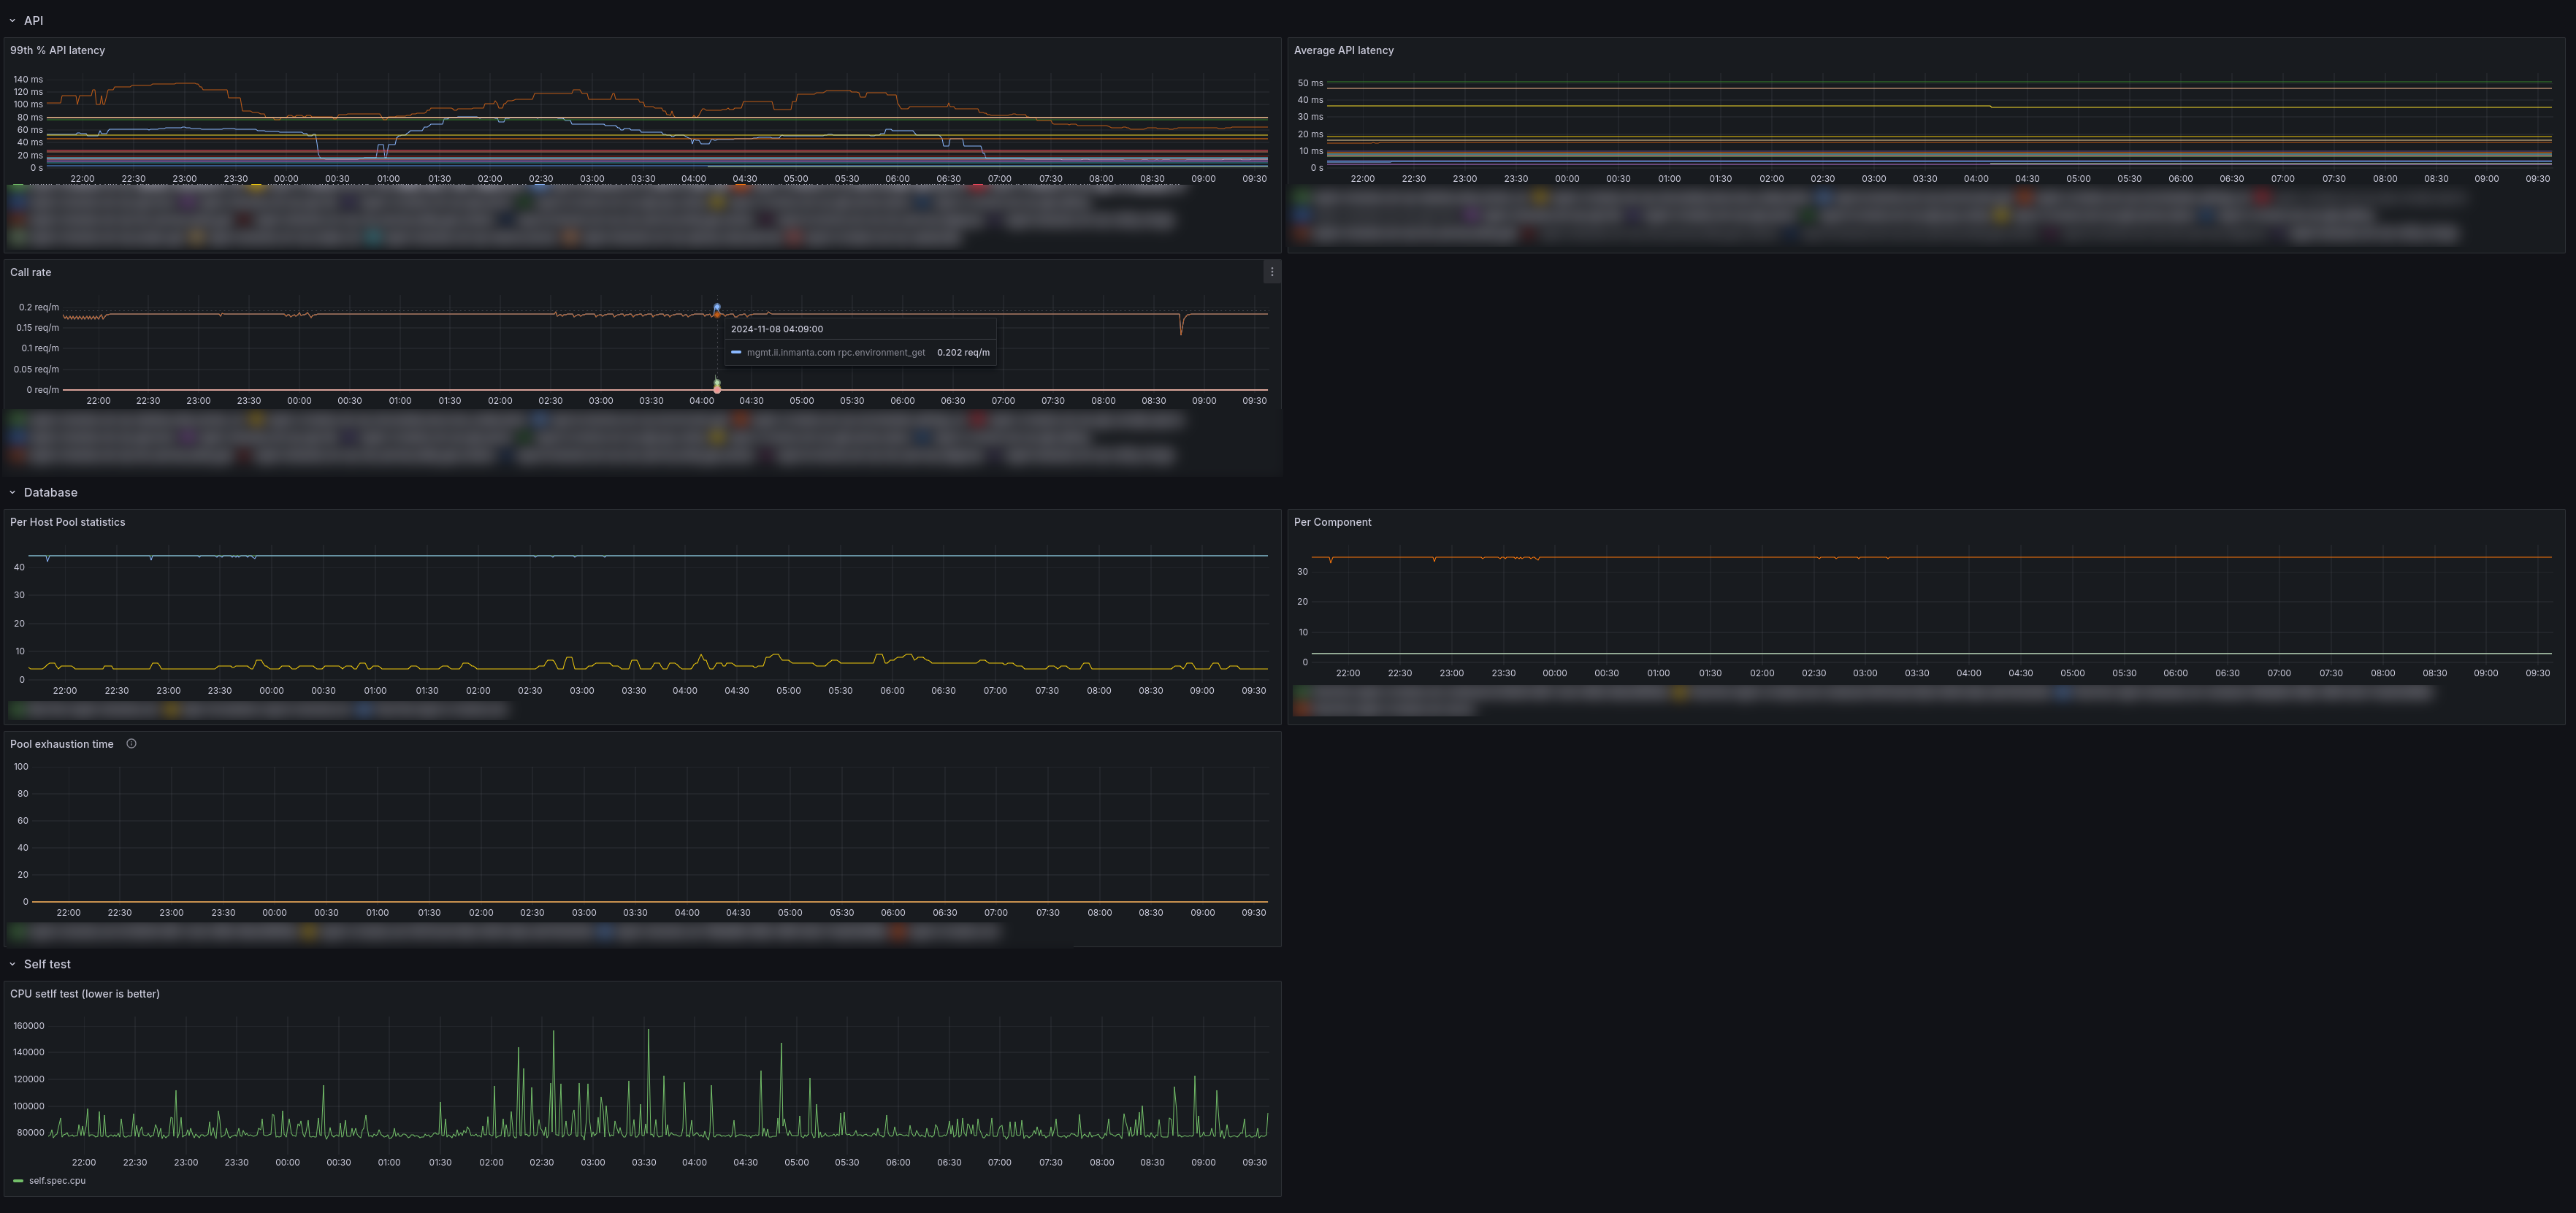
Inmanta API Performance Prometheus
To use this dashboard:
- set up prometheus
- set up telegraf to report to prometheus
[[outputs.http]]
  url = "http://myprometheus:9090/api/v1/push"
  data_format = "prometheusremotewrite"
- set up telegraf to listen for influxdb inputs
[[inputs.influxdb_listener]]
  ## Address and port to host HTTP listener on
  service_address = ":8186"
- connect inmanta to telegraf [influxdb]
The hostname of the influxdb server
Enable metering by setting this value
host = 127.0.0.1
The port of the influxdb server
port = 8186
The name of the database on the influxdb server, ignored by prometheus
name = inmanta
A dict of tags to attach to all influxdb records
tags= host=myhost
[server]
Data source config
Collector type:
Collector plugins:
Collector config:
Revisions
Upload an updated version of an exported dashboard.json file from Grafana
| Revision | Description | Created | |
|---|---|---|---|
| Download |
Metrics Endpoint (Prometheus)
Easily monitor any Prometheus-compatible and publicly accessible metrics URL with Grafana Cloud's out-of-the-box monitoring solution.
Learn more