etcd
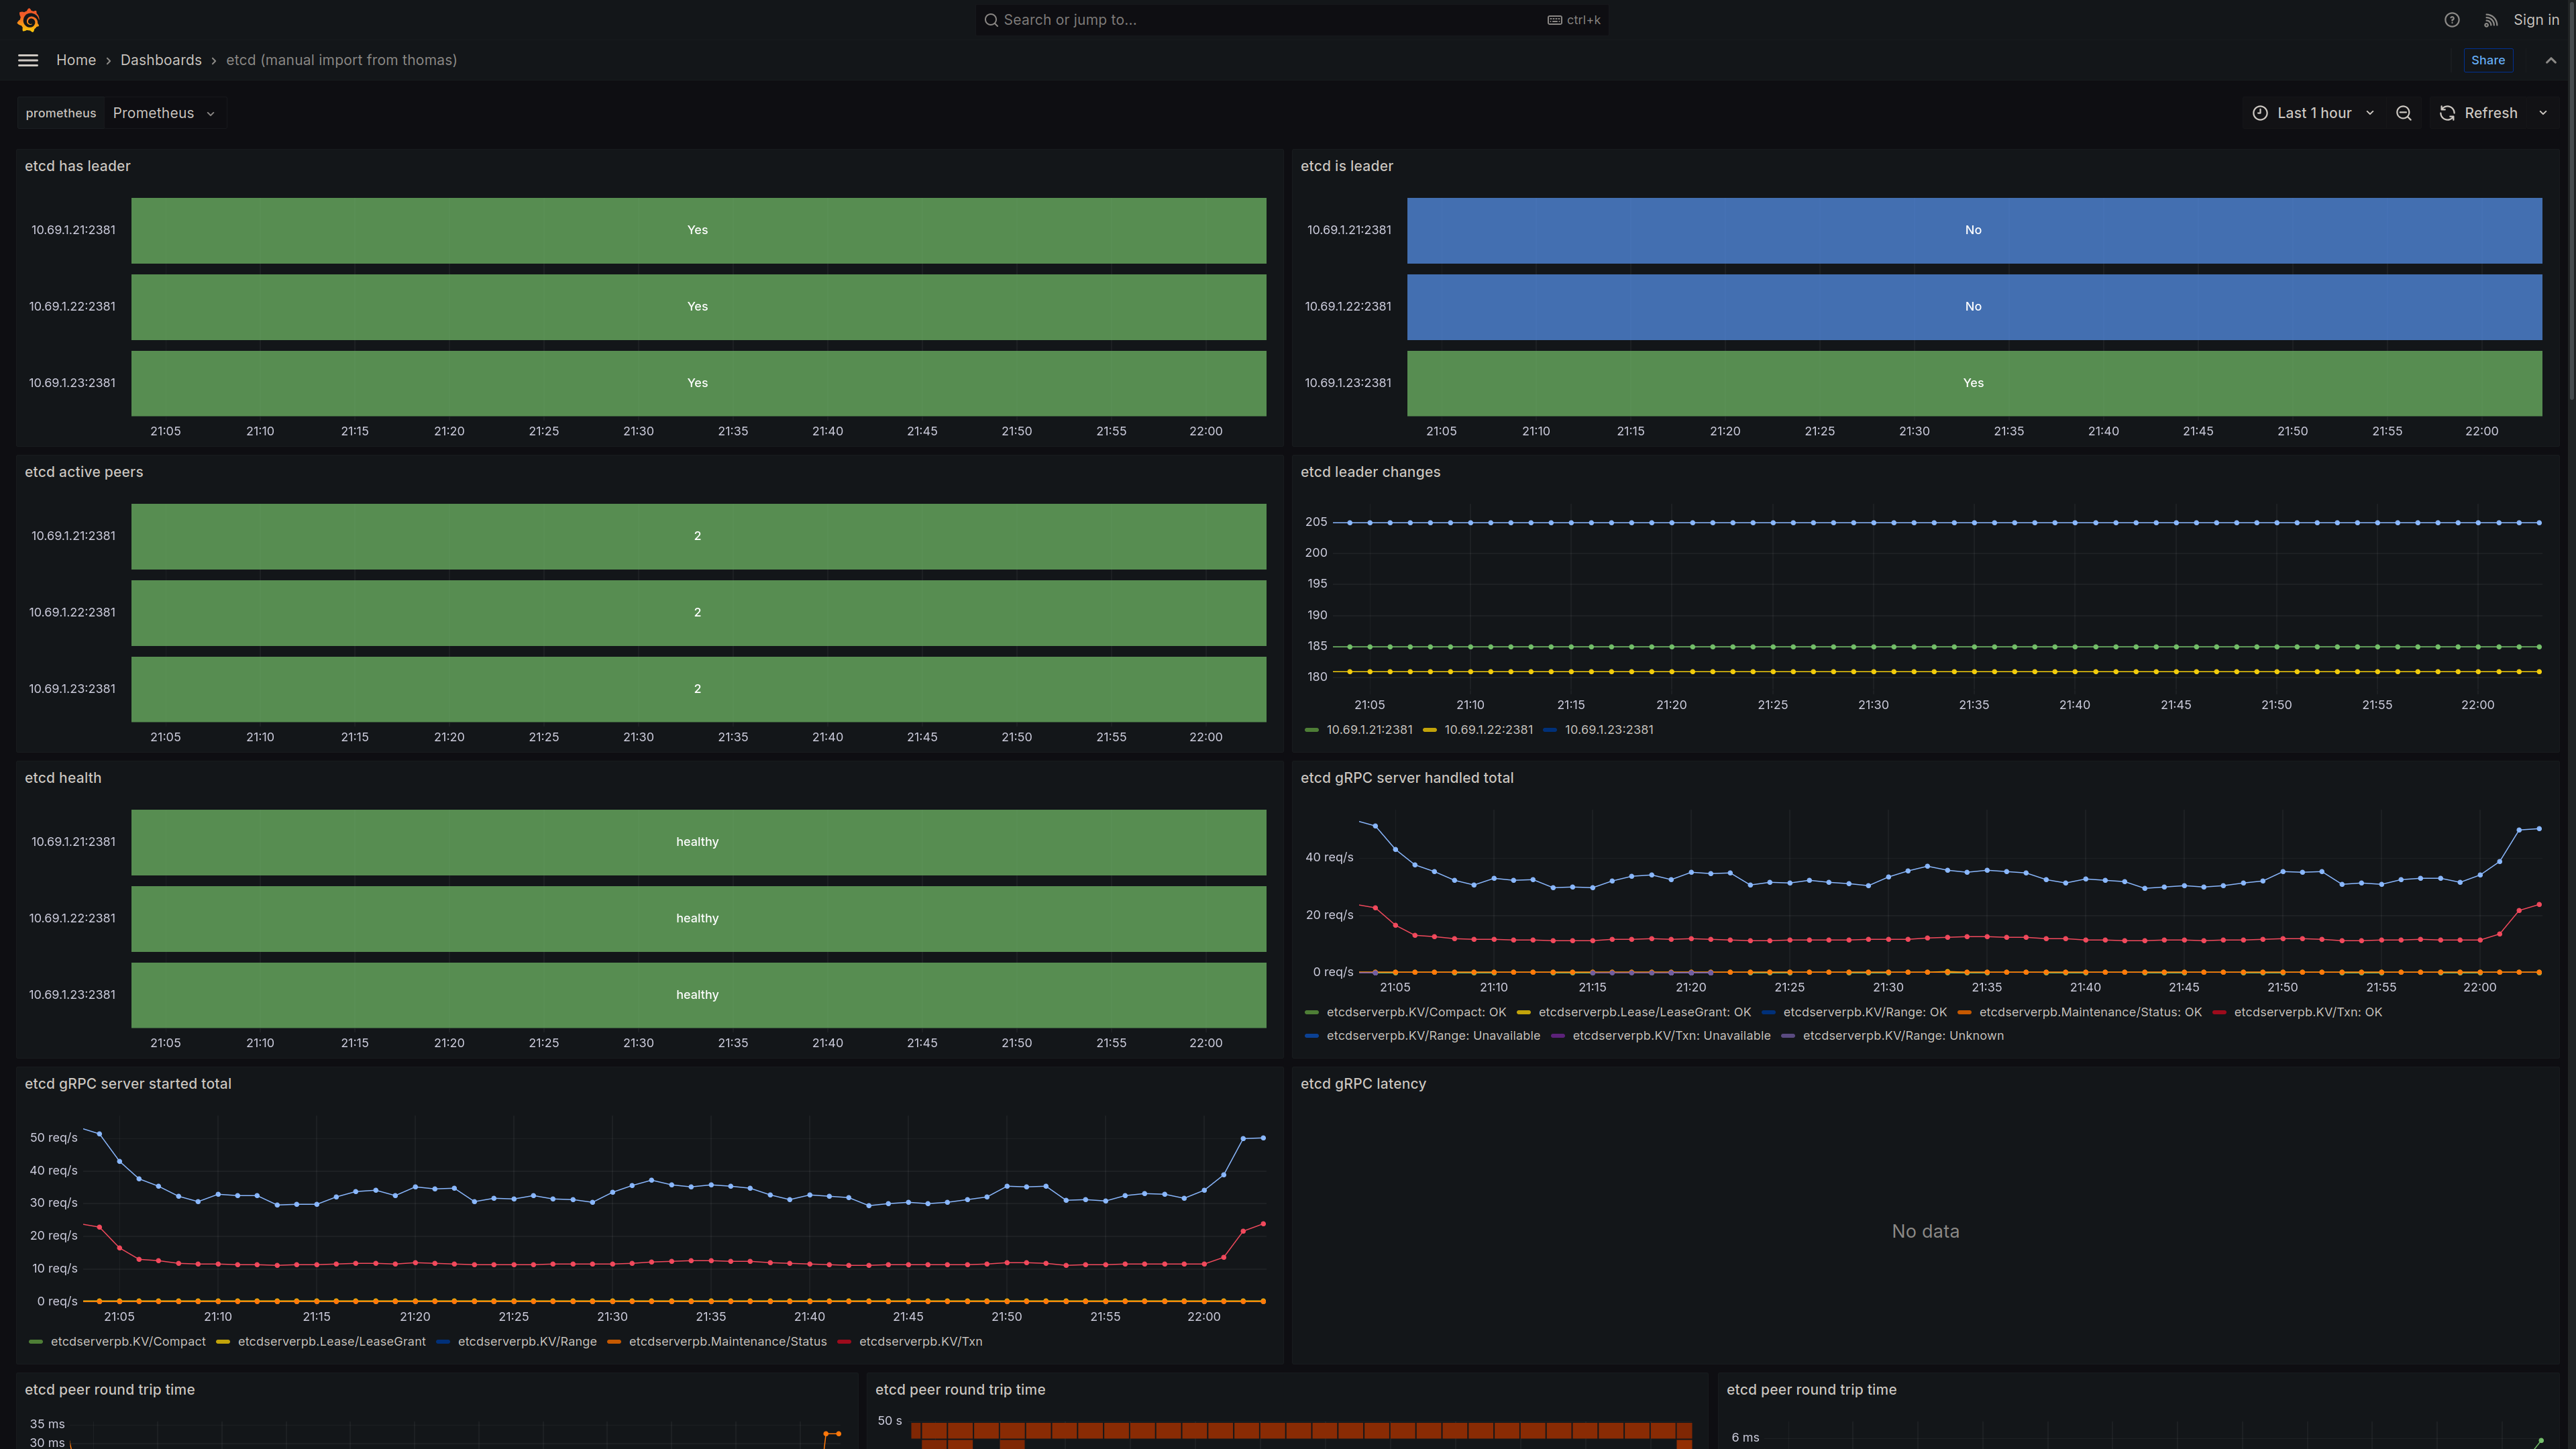
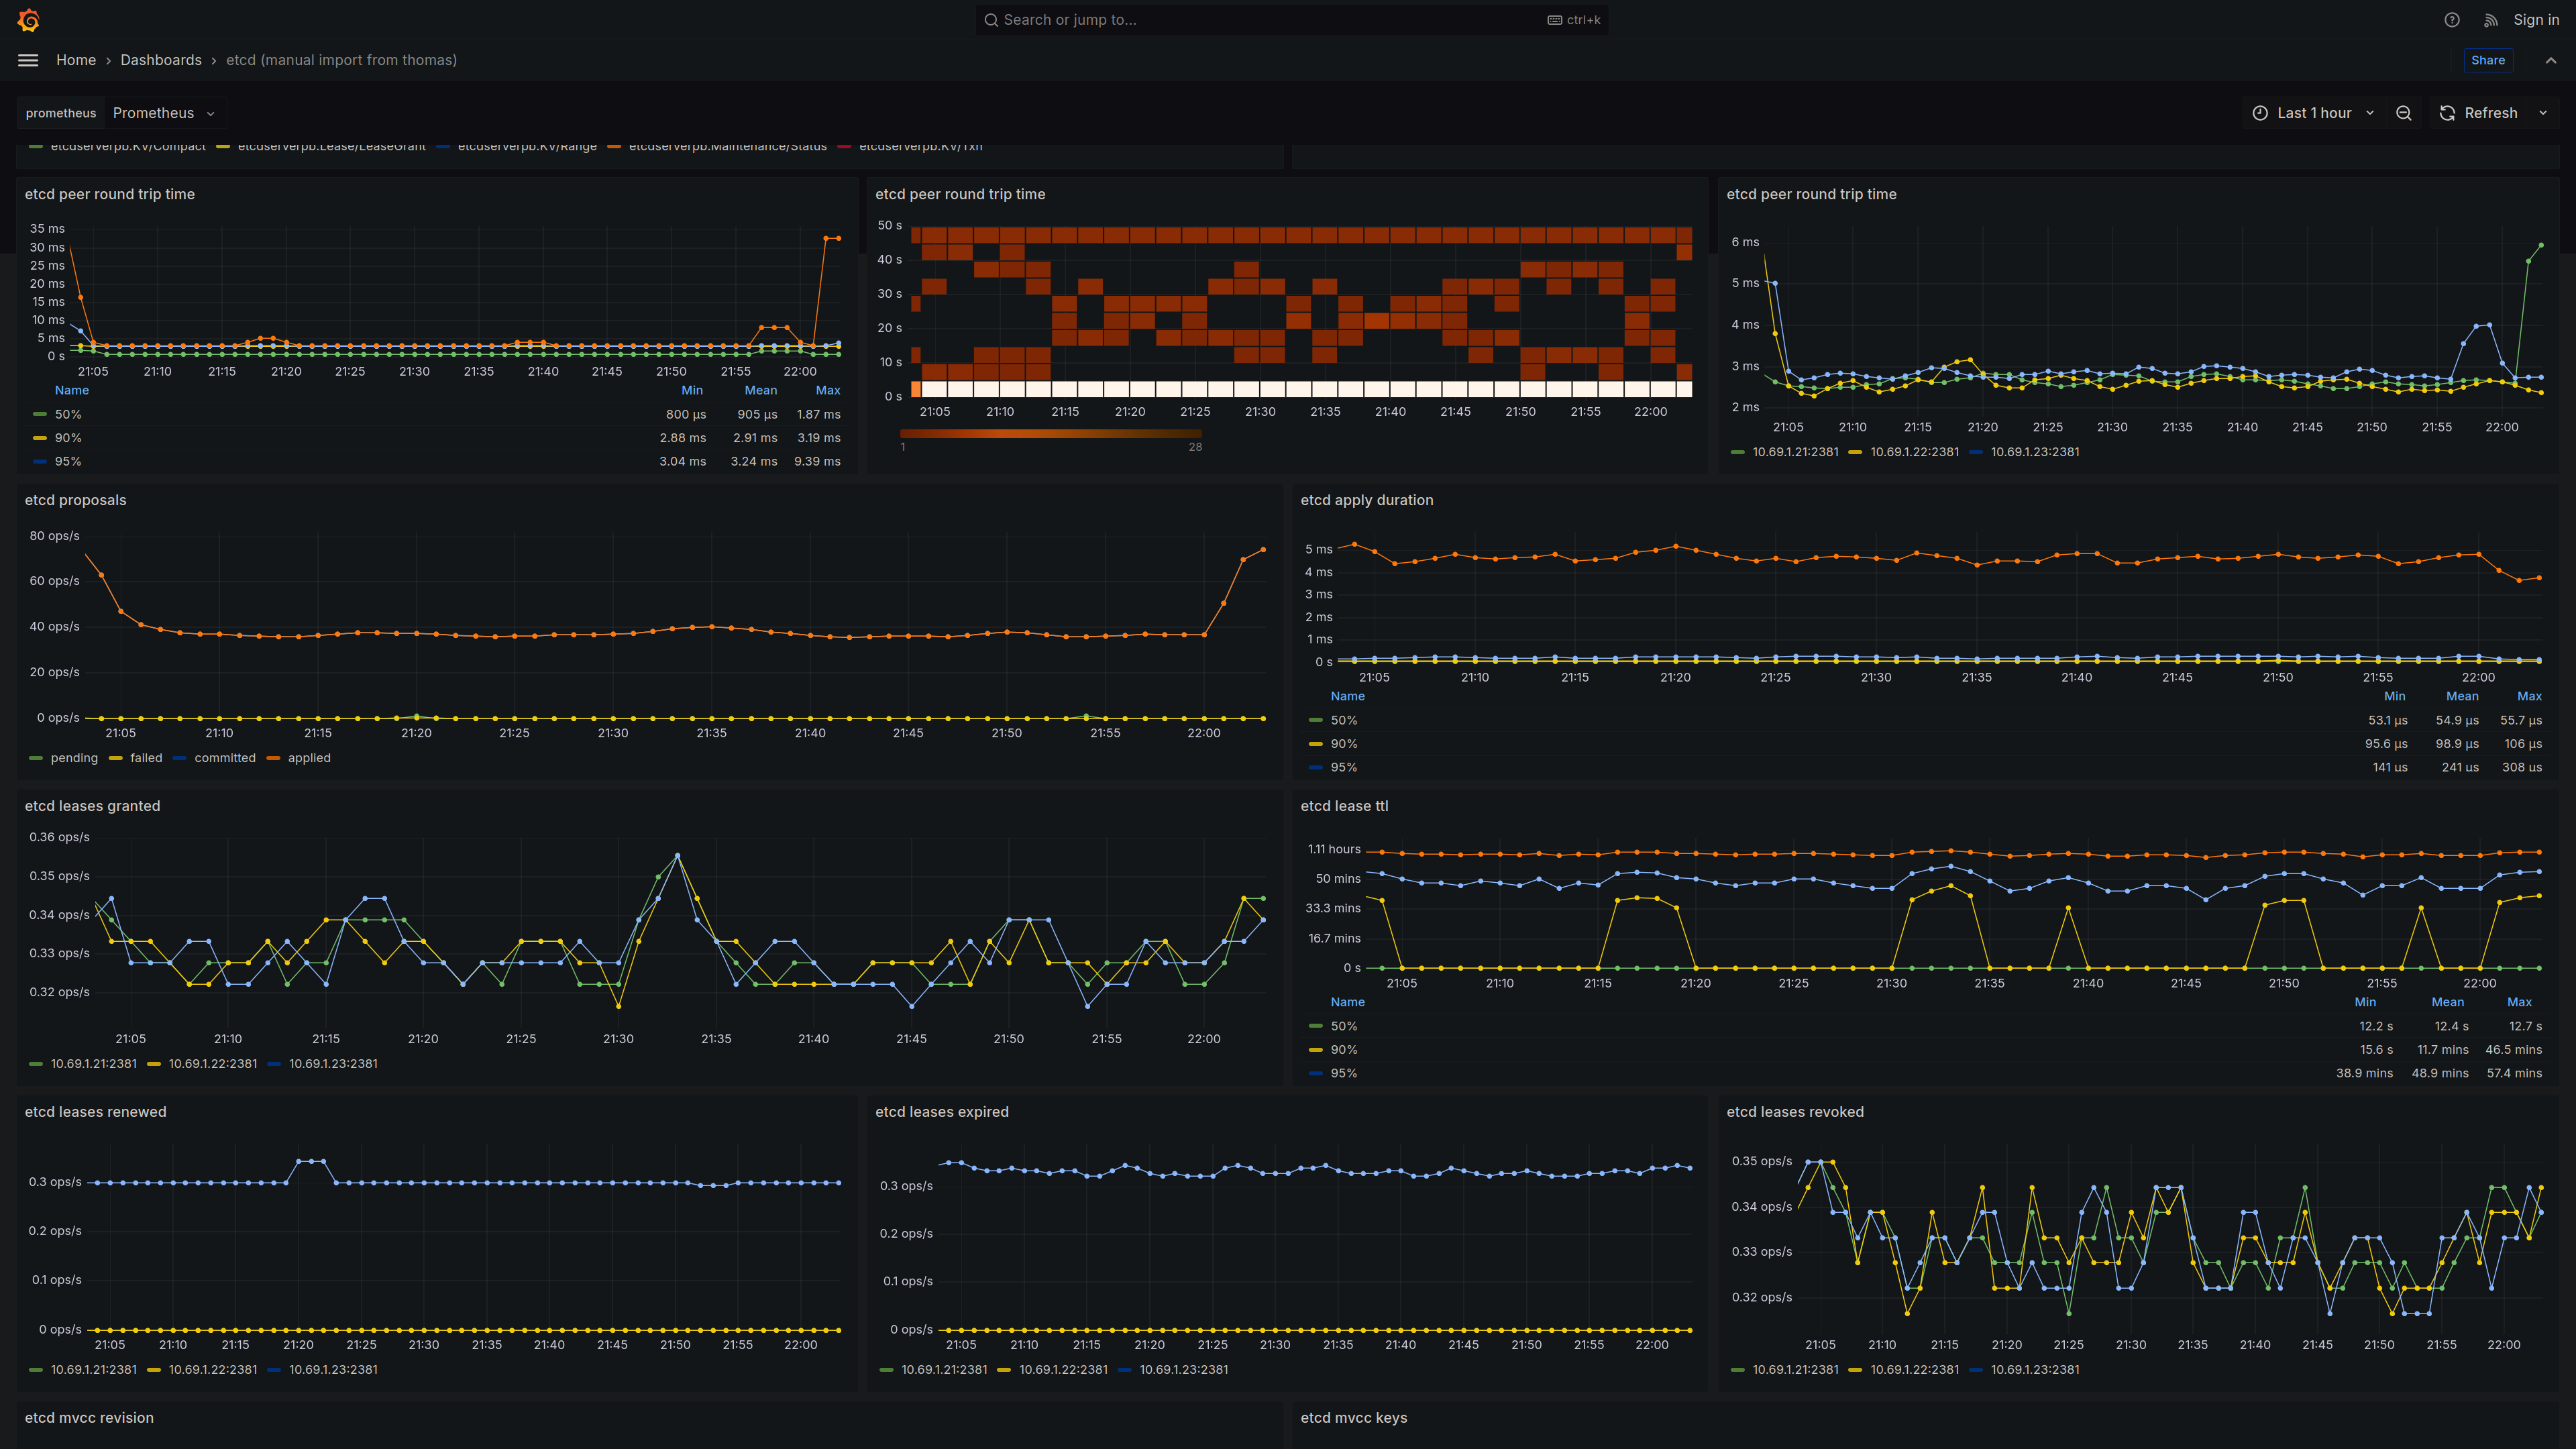
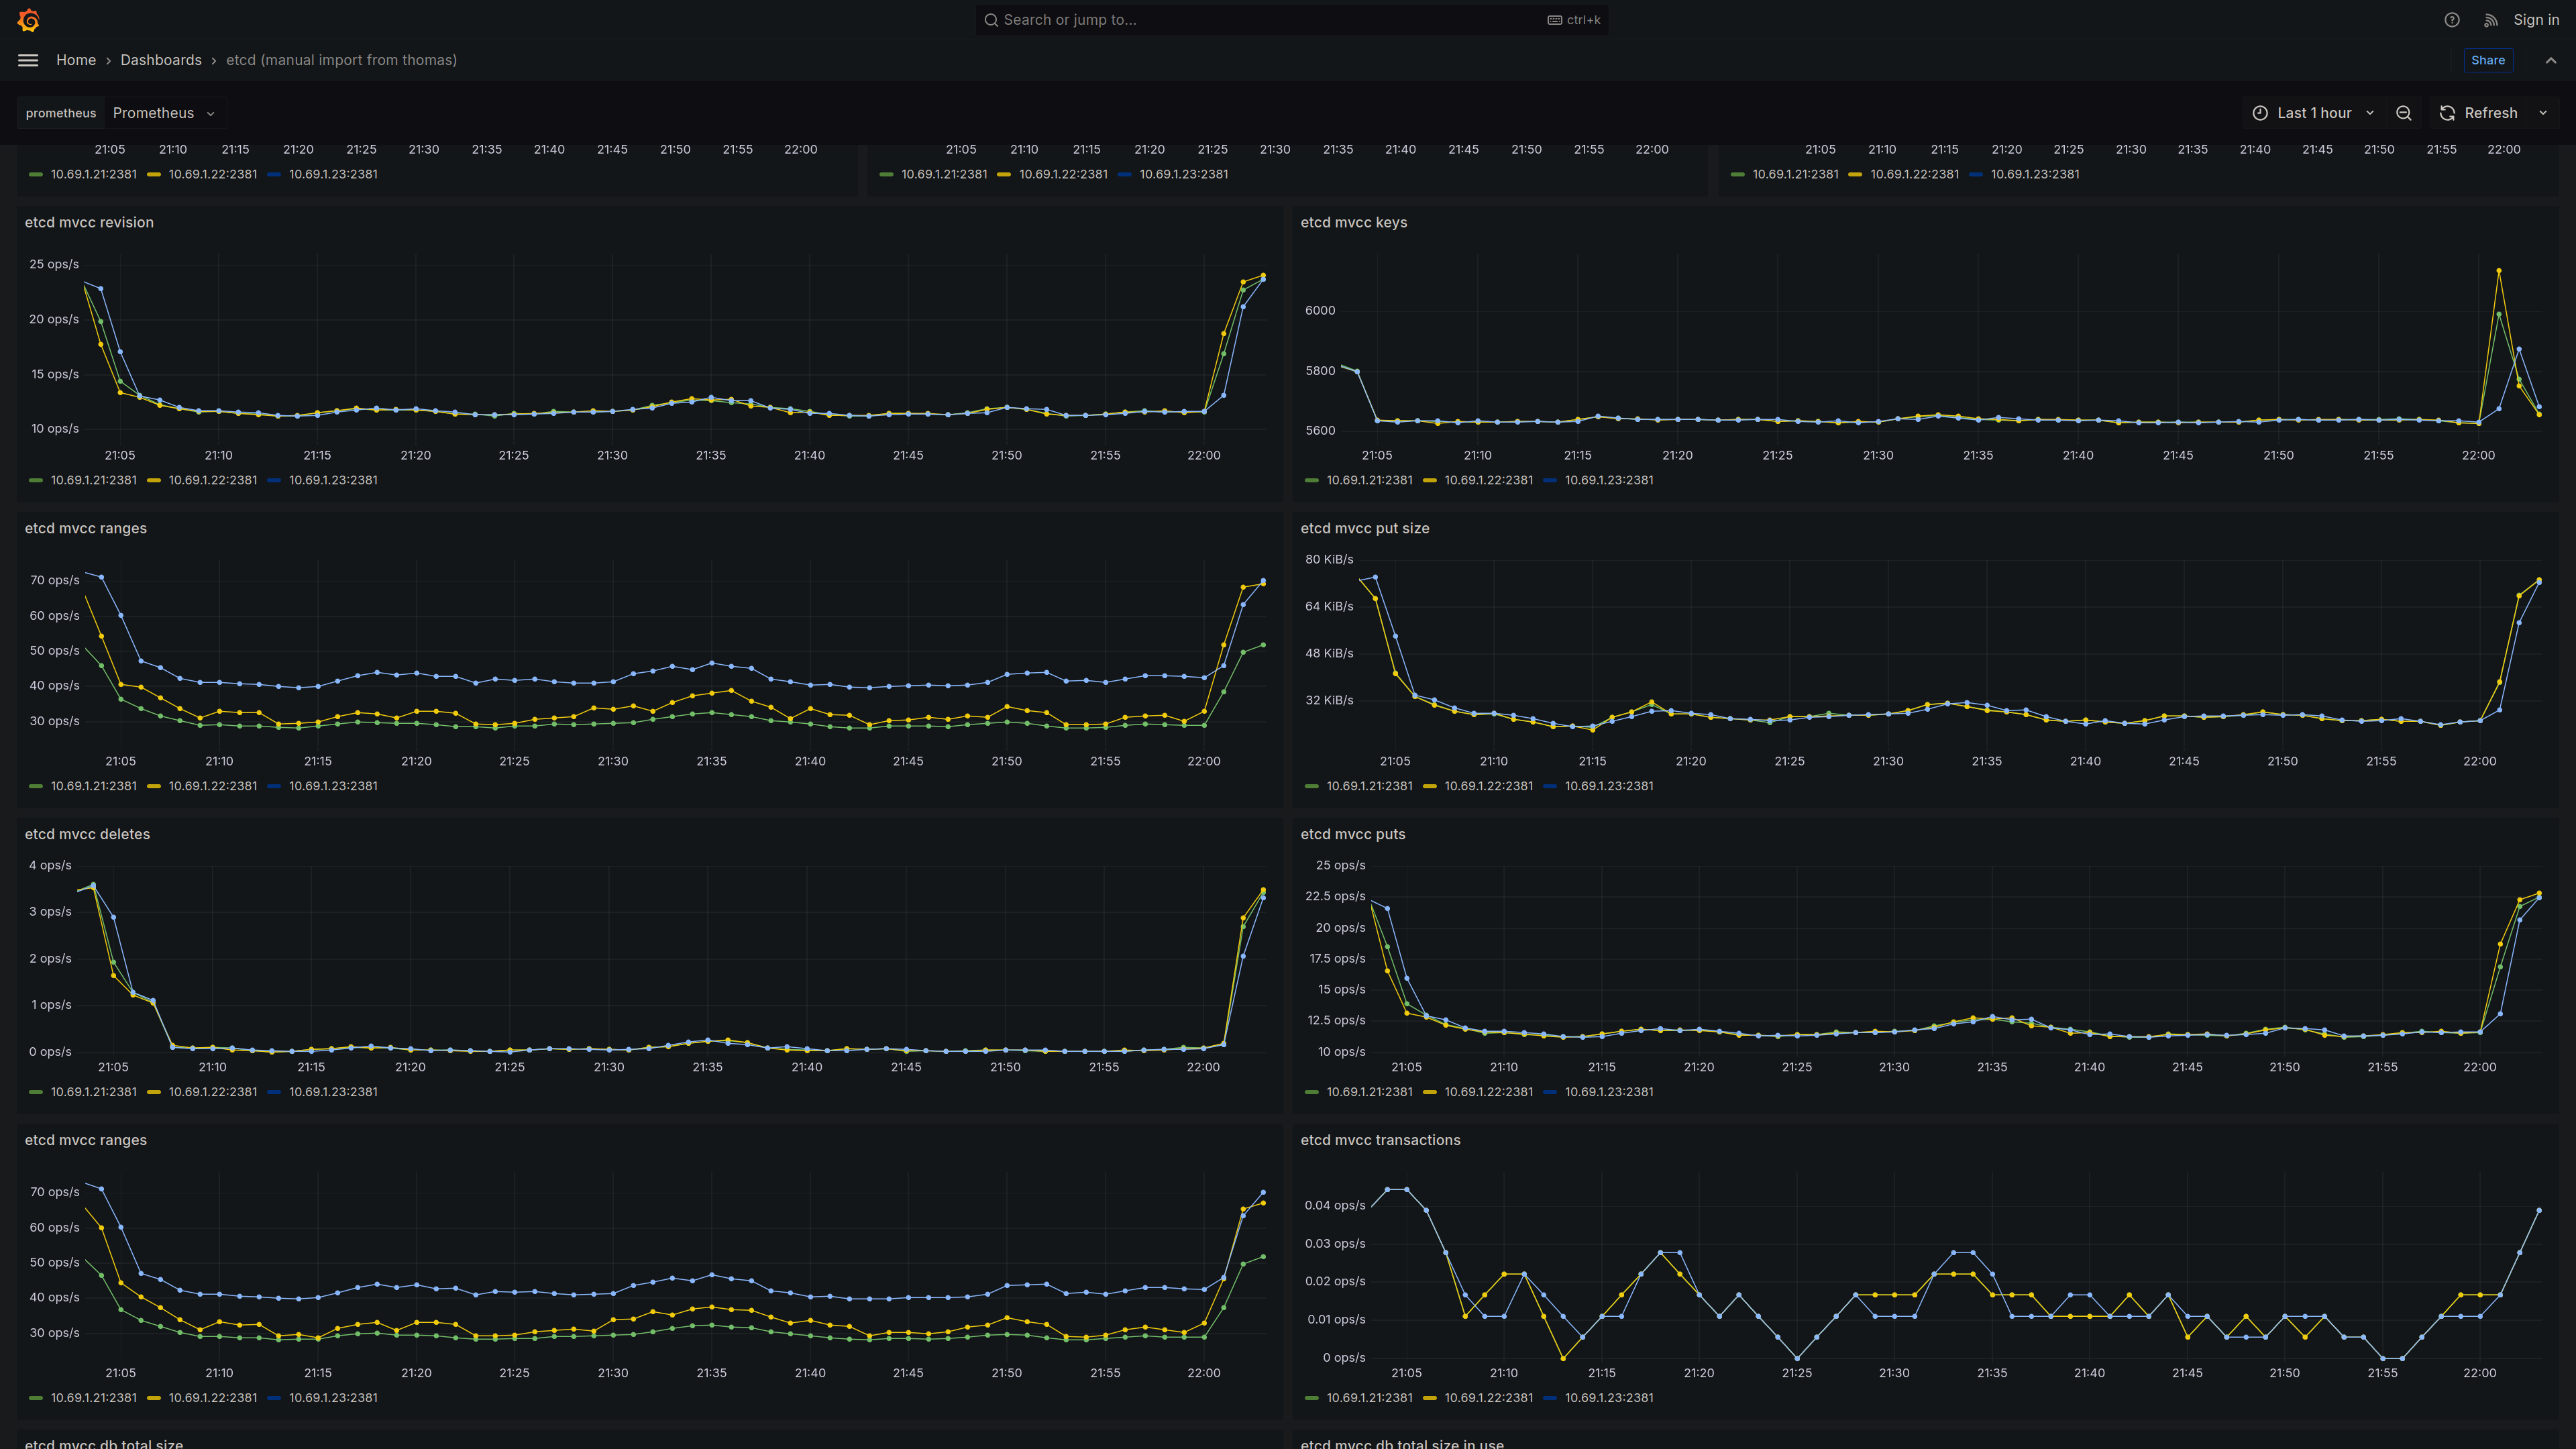
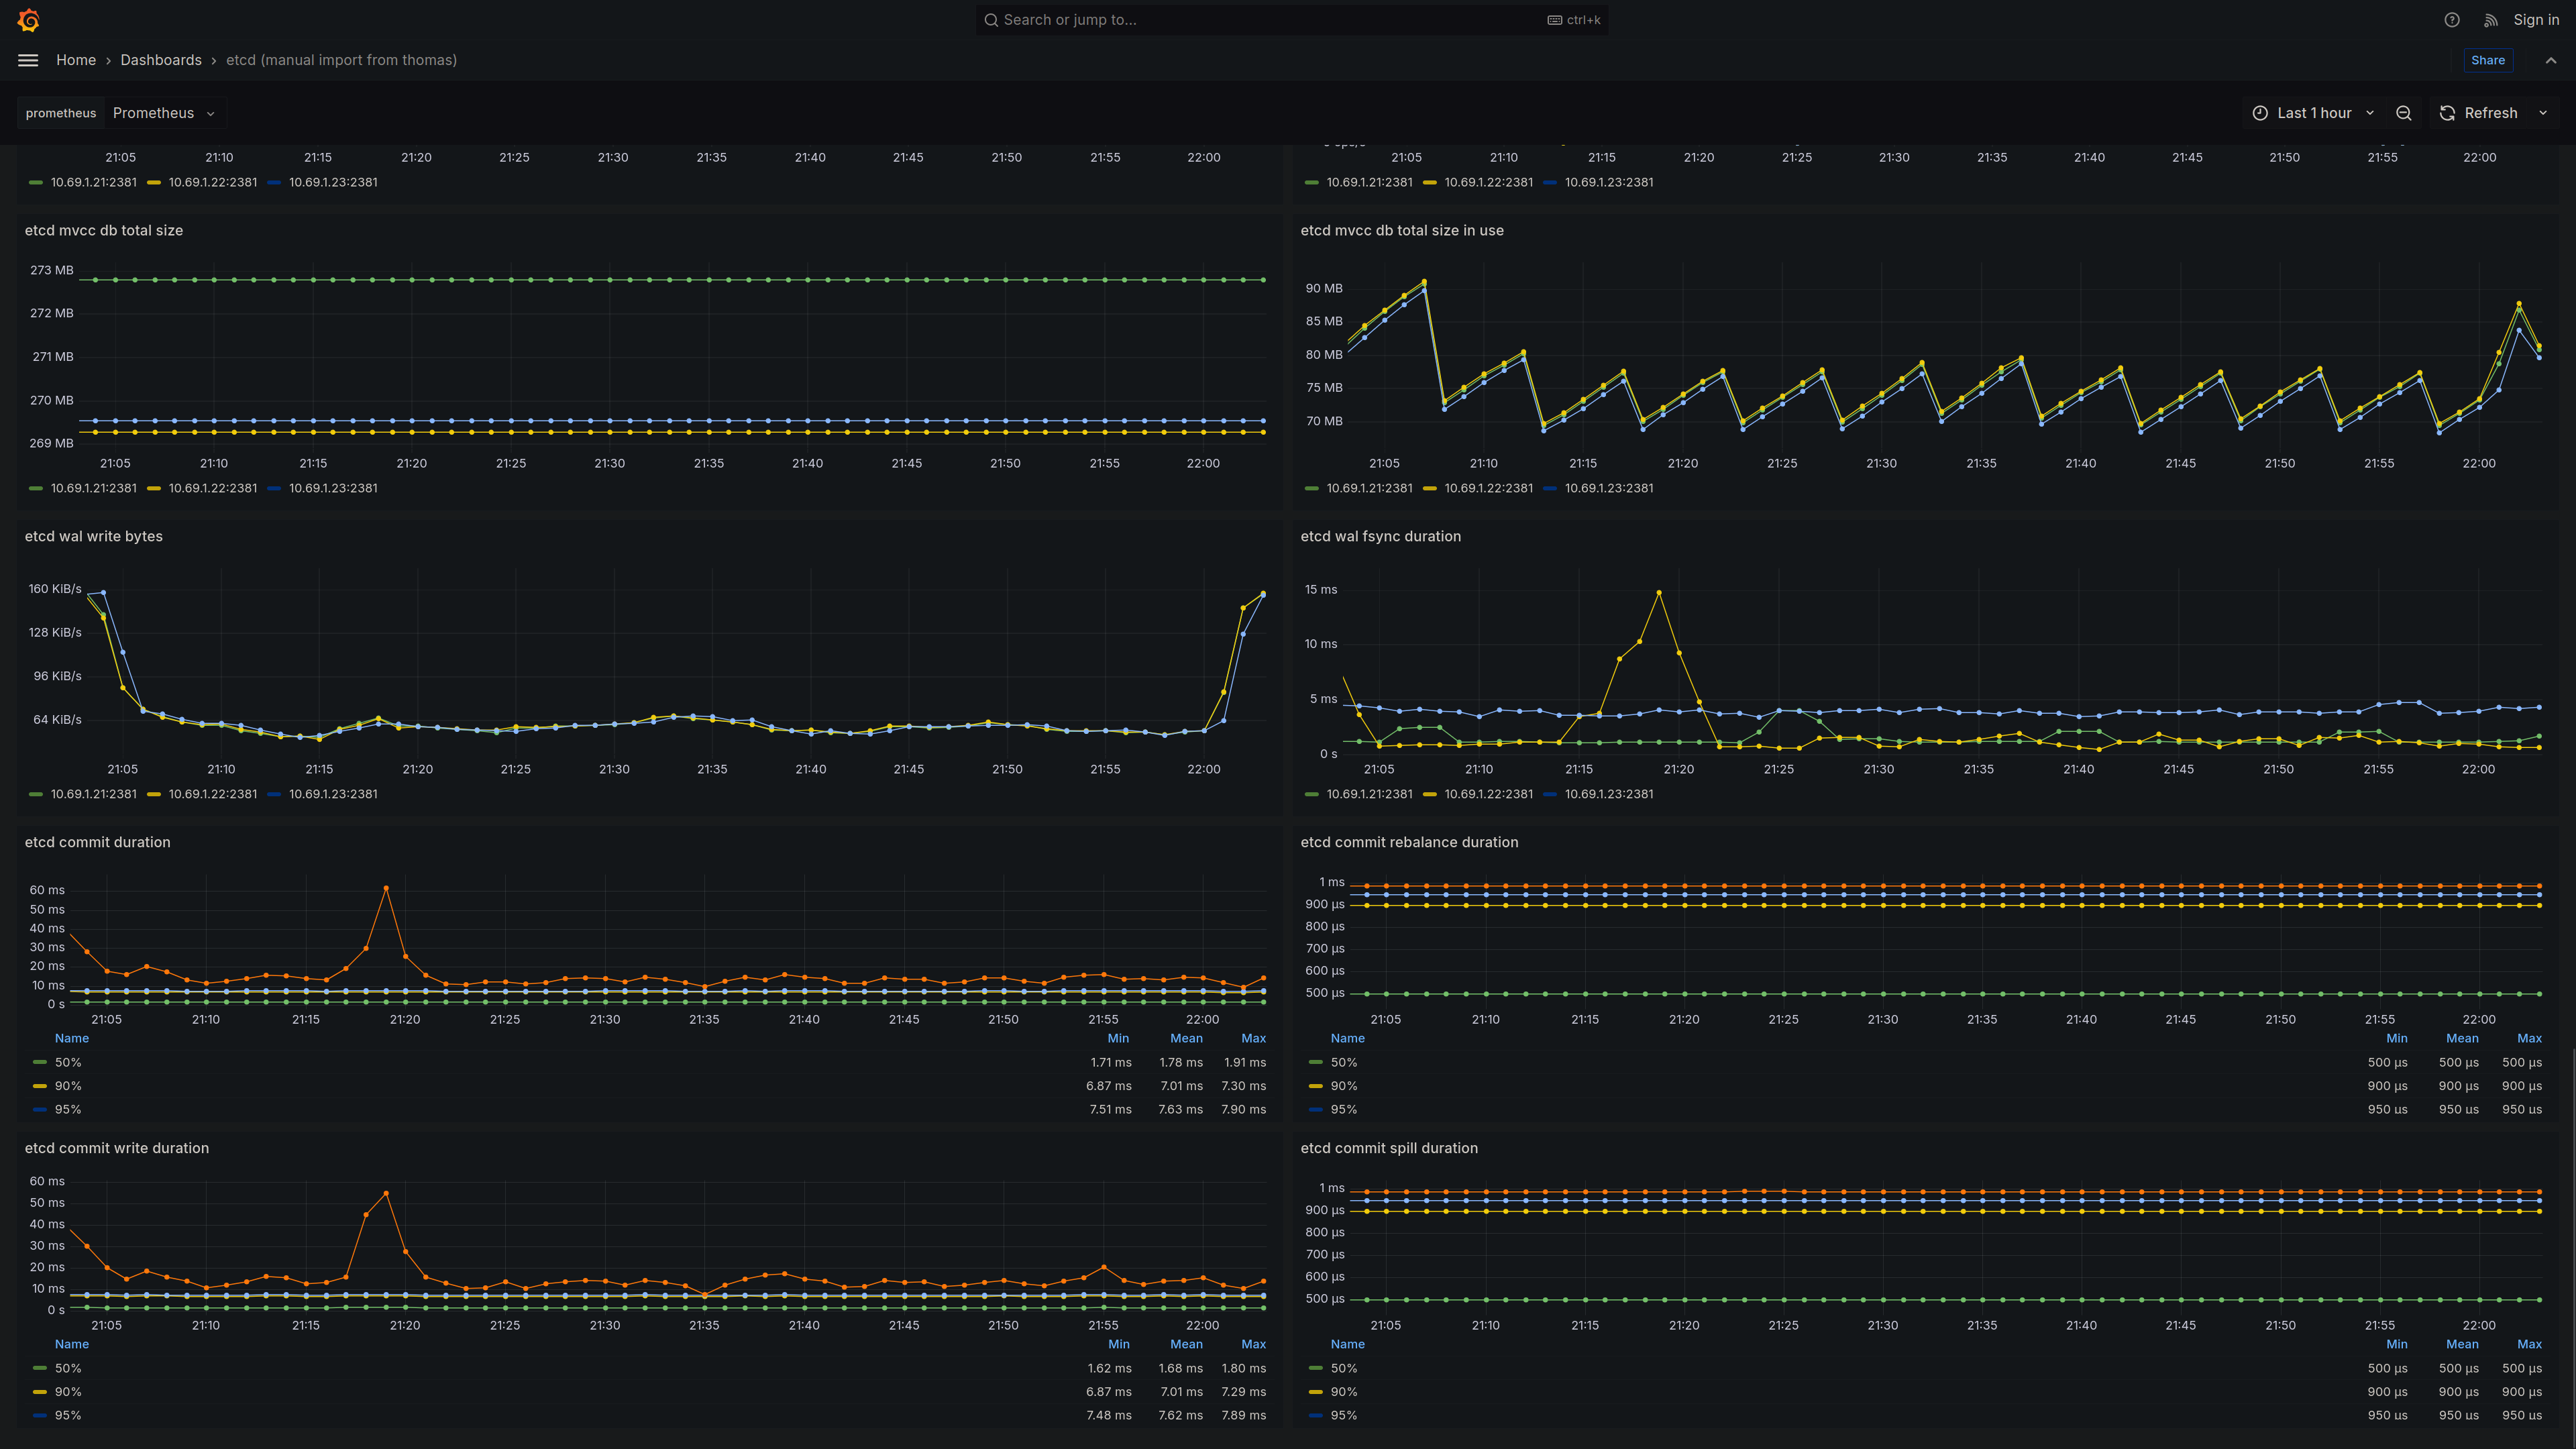
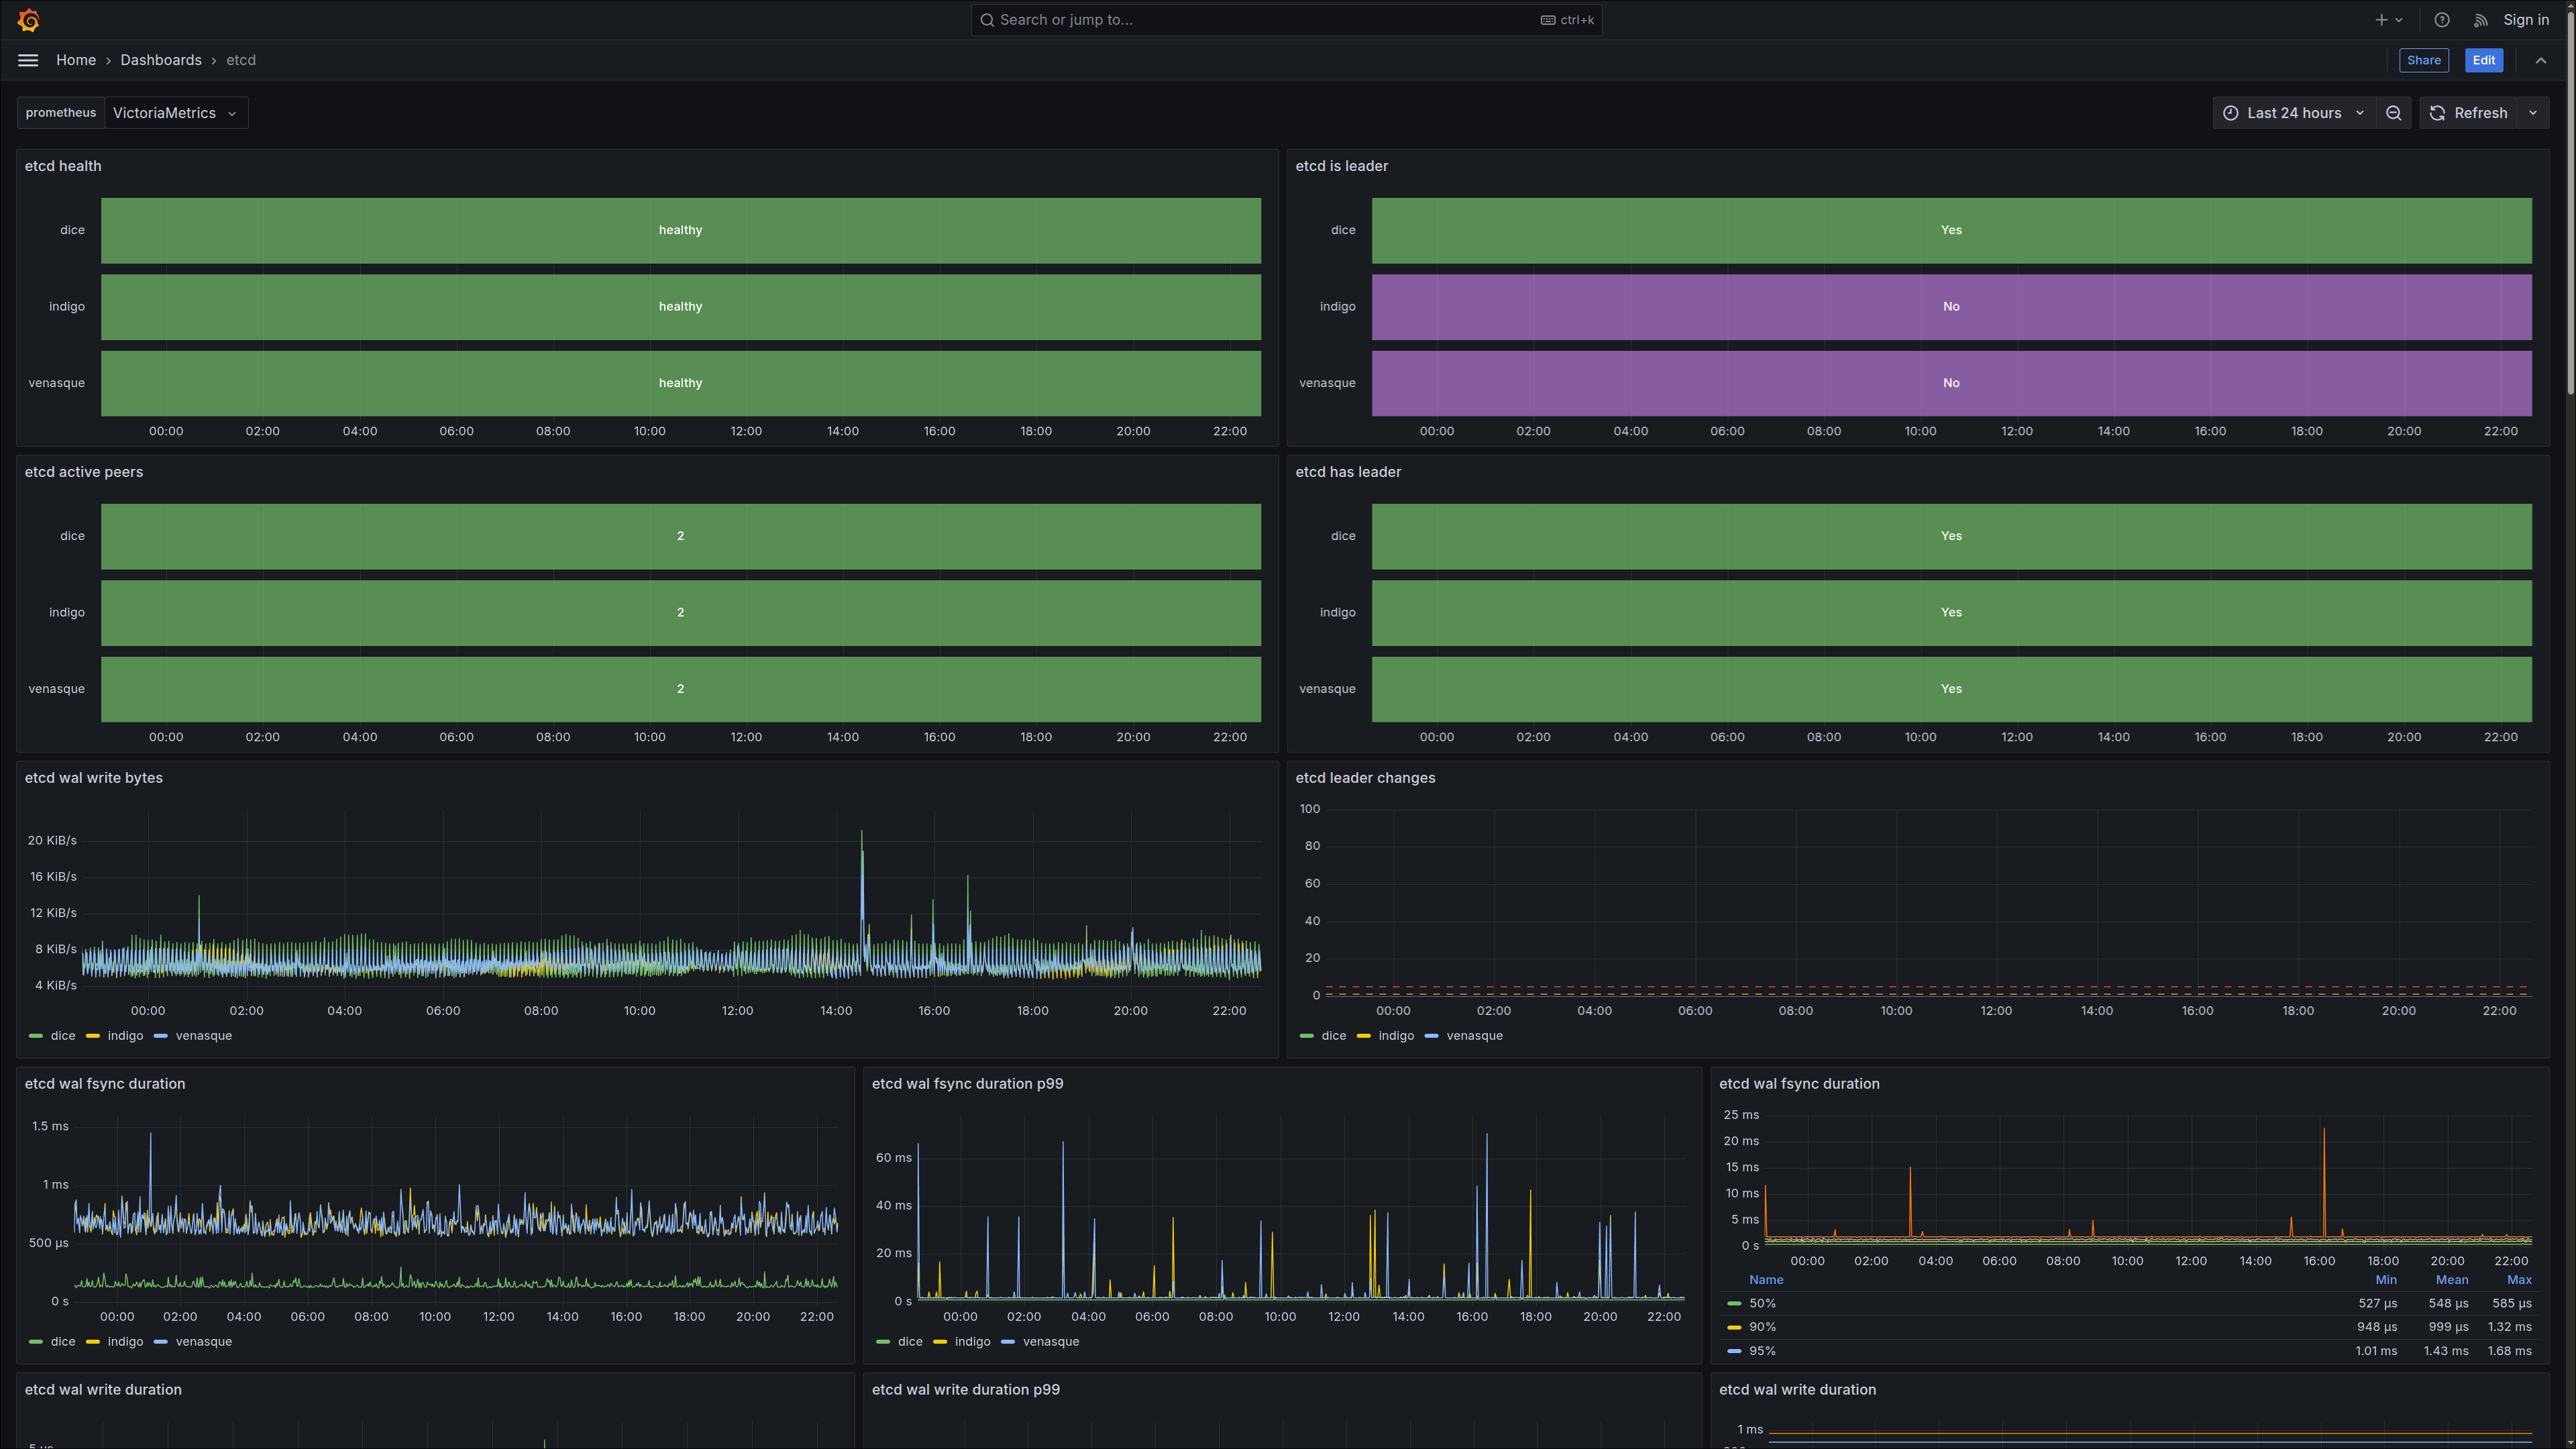
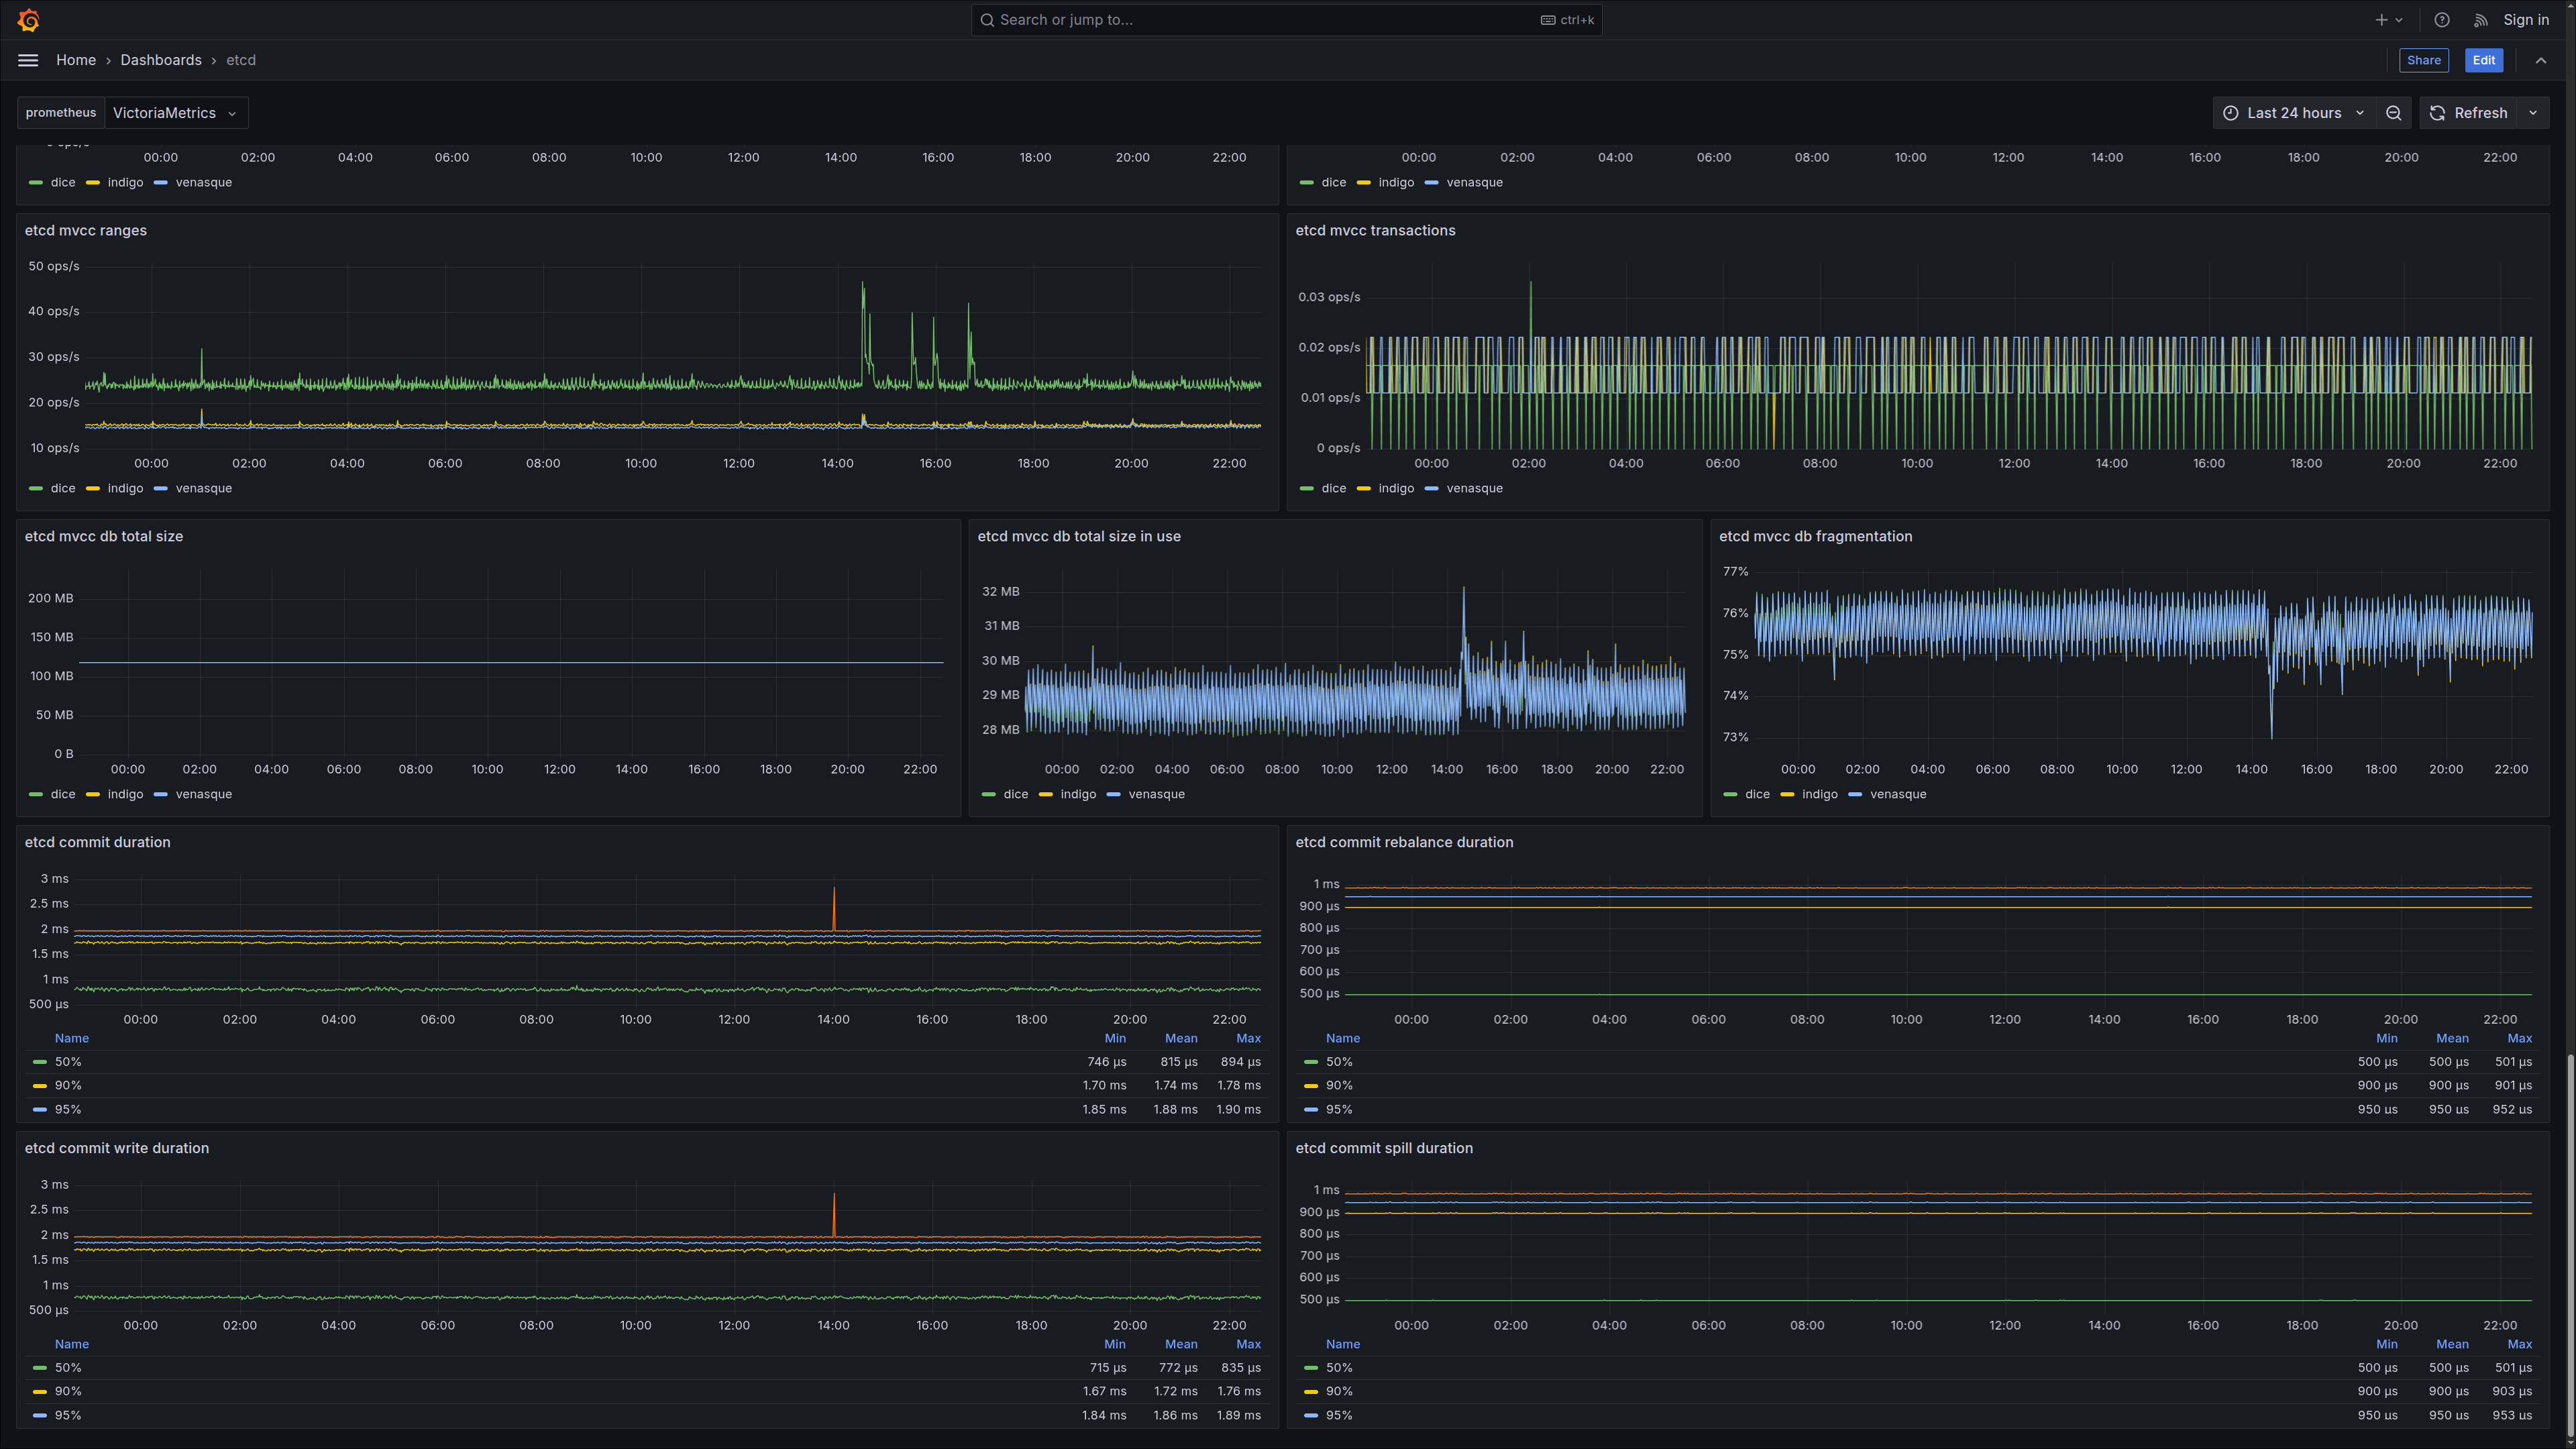
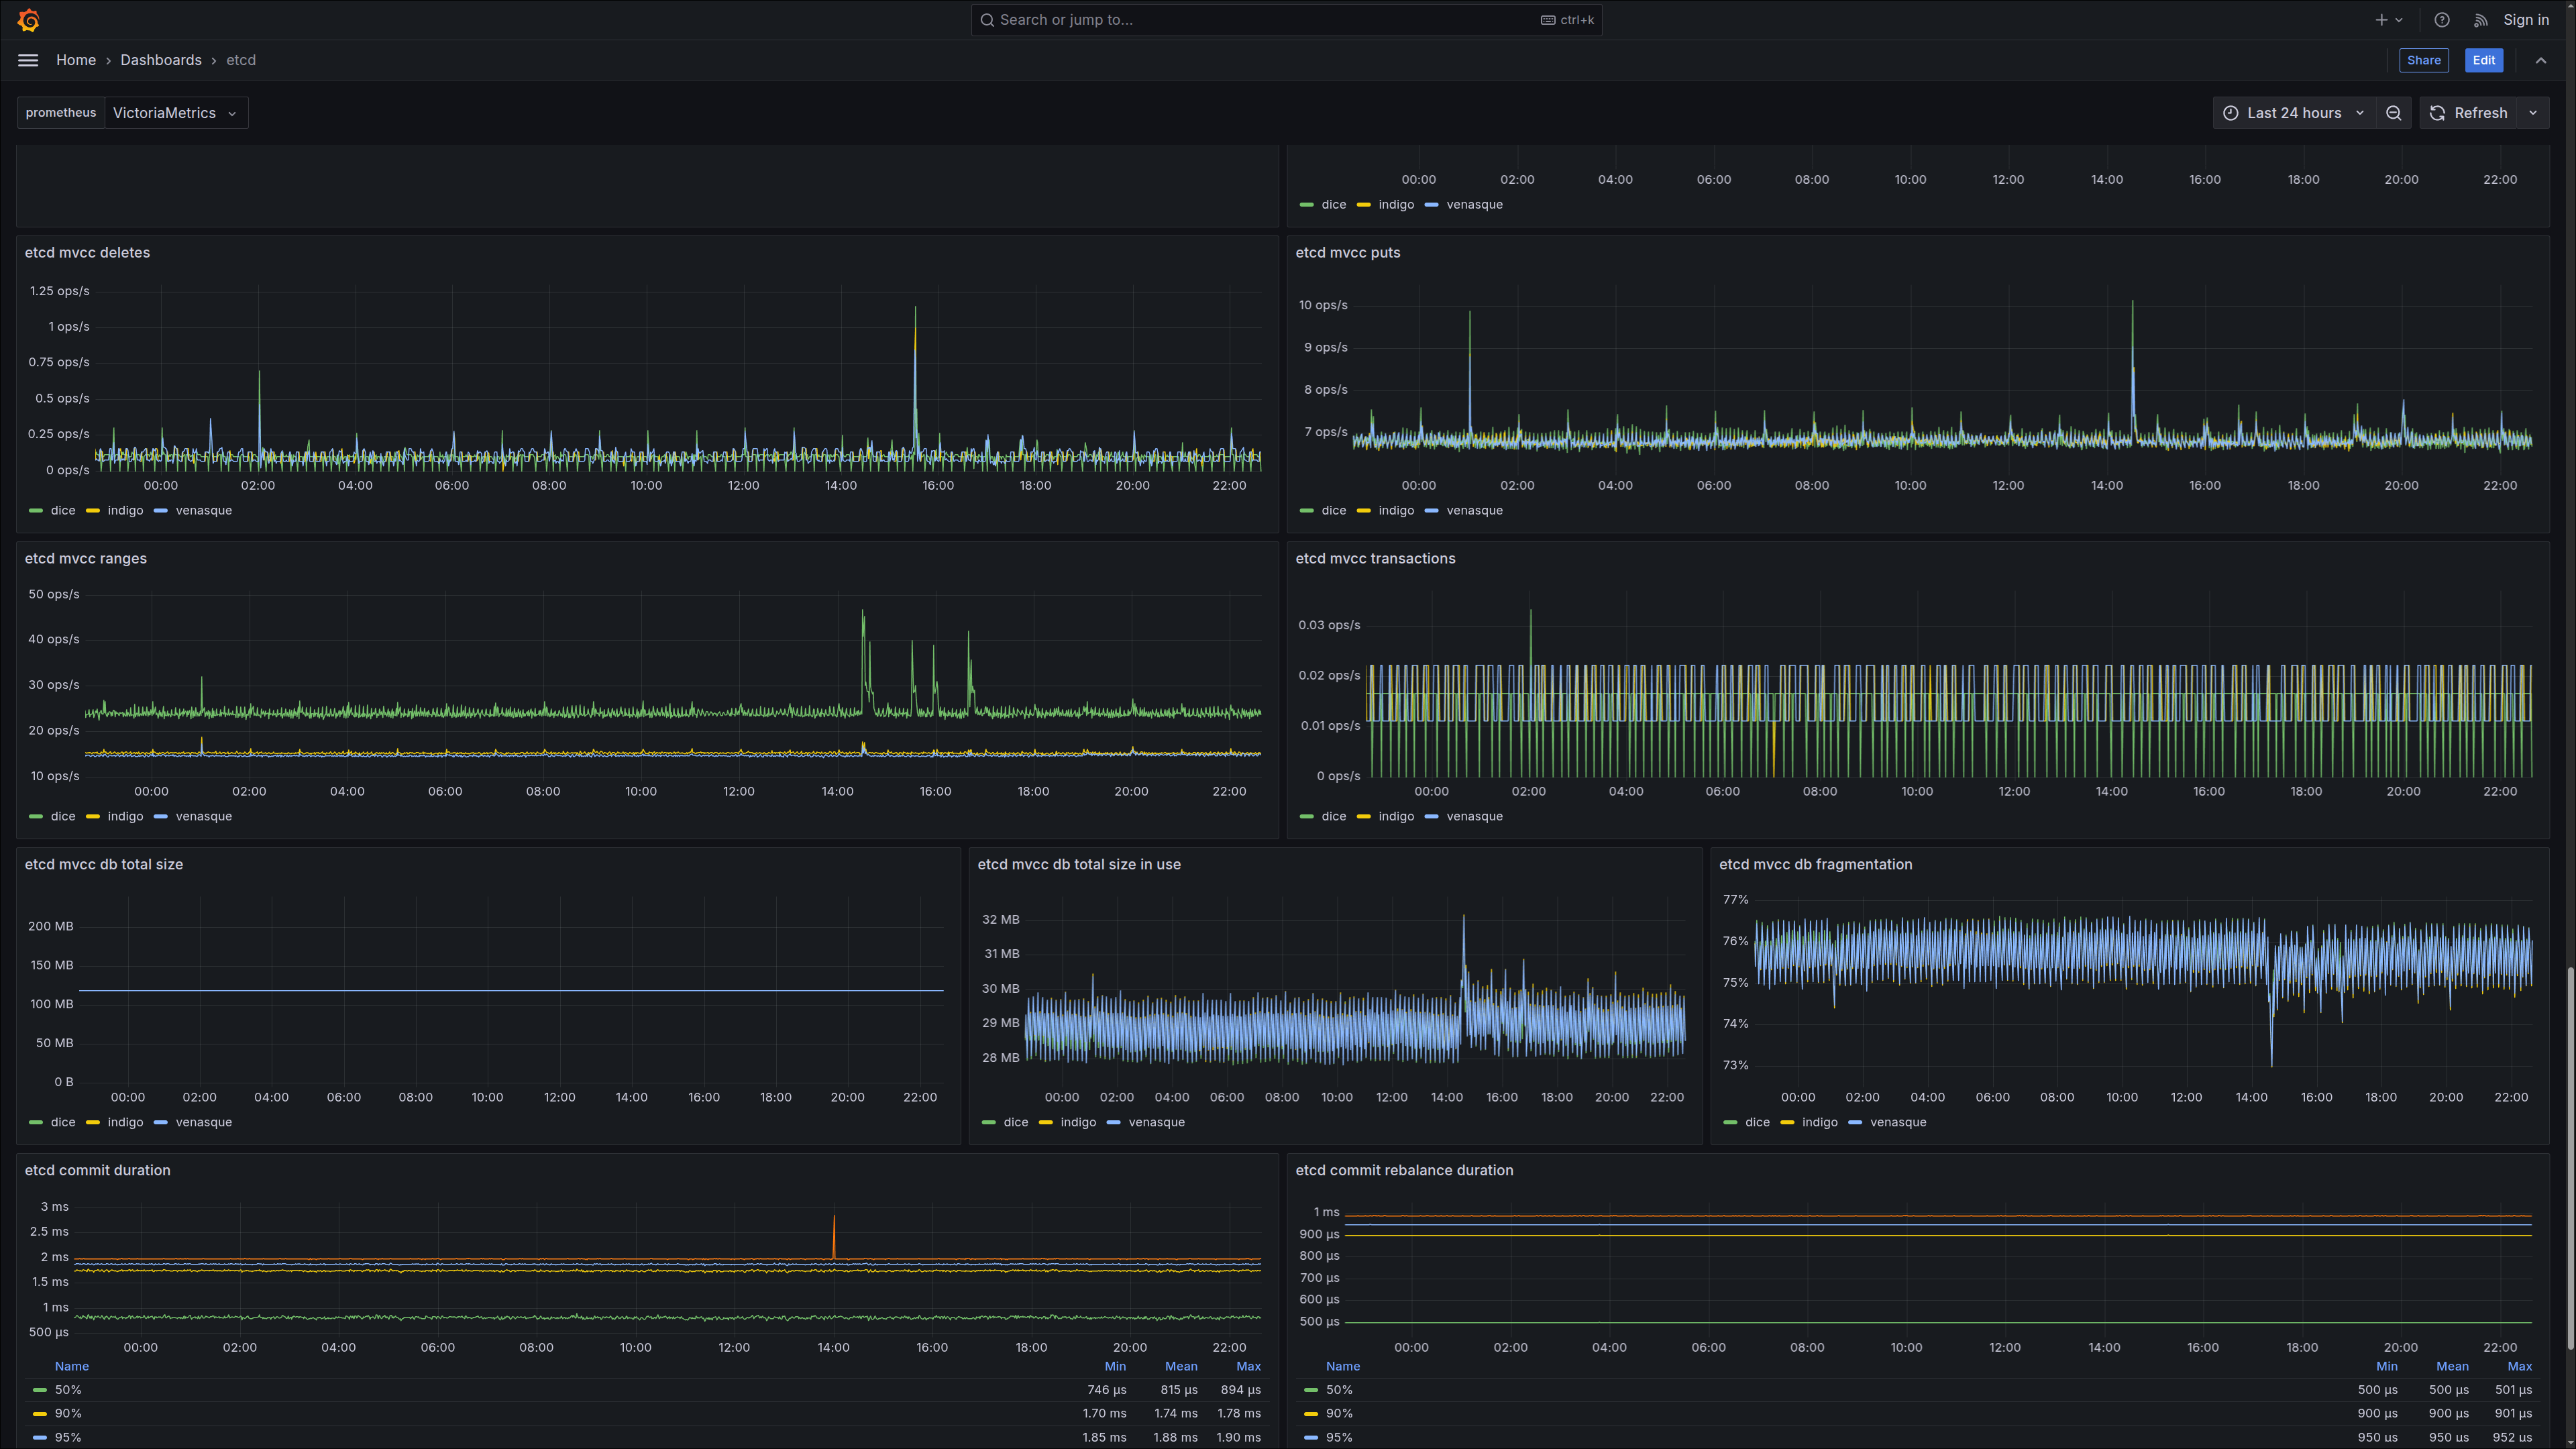
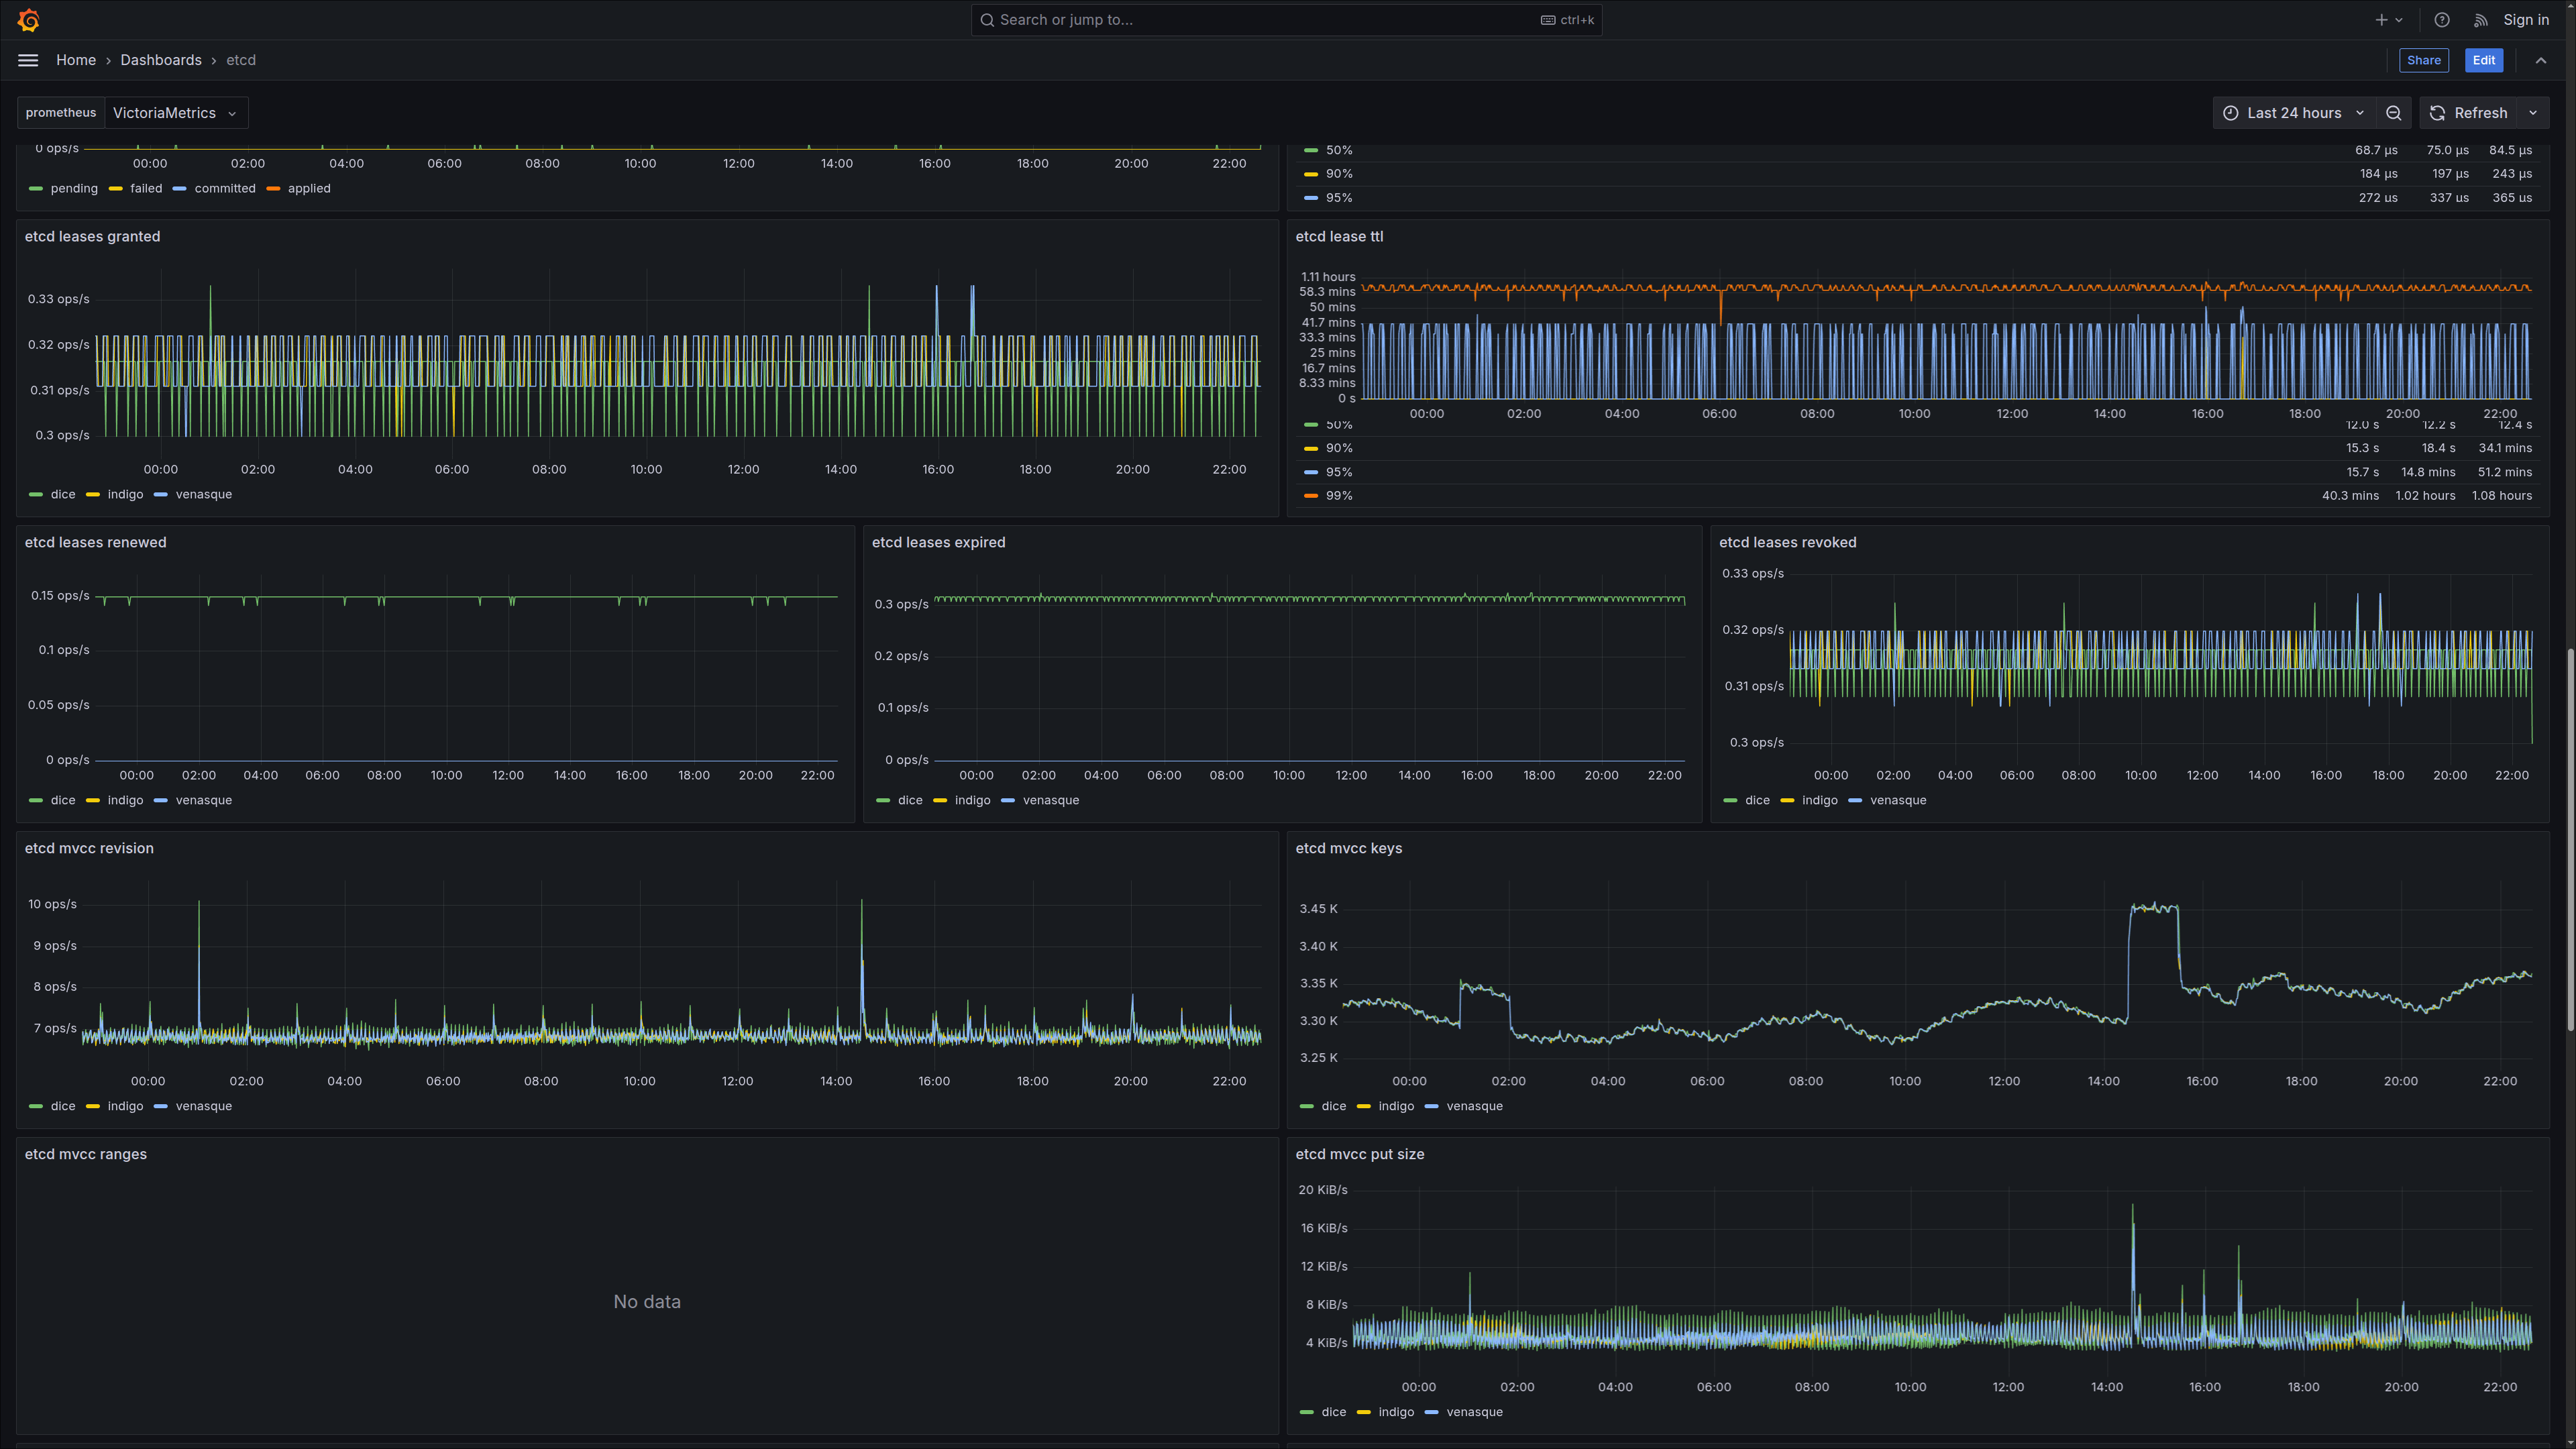
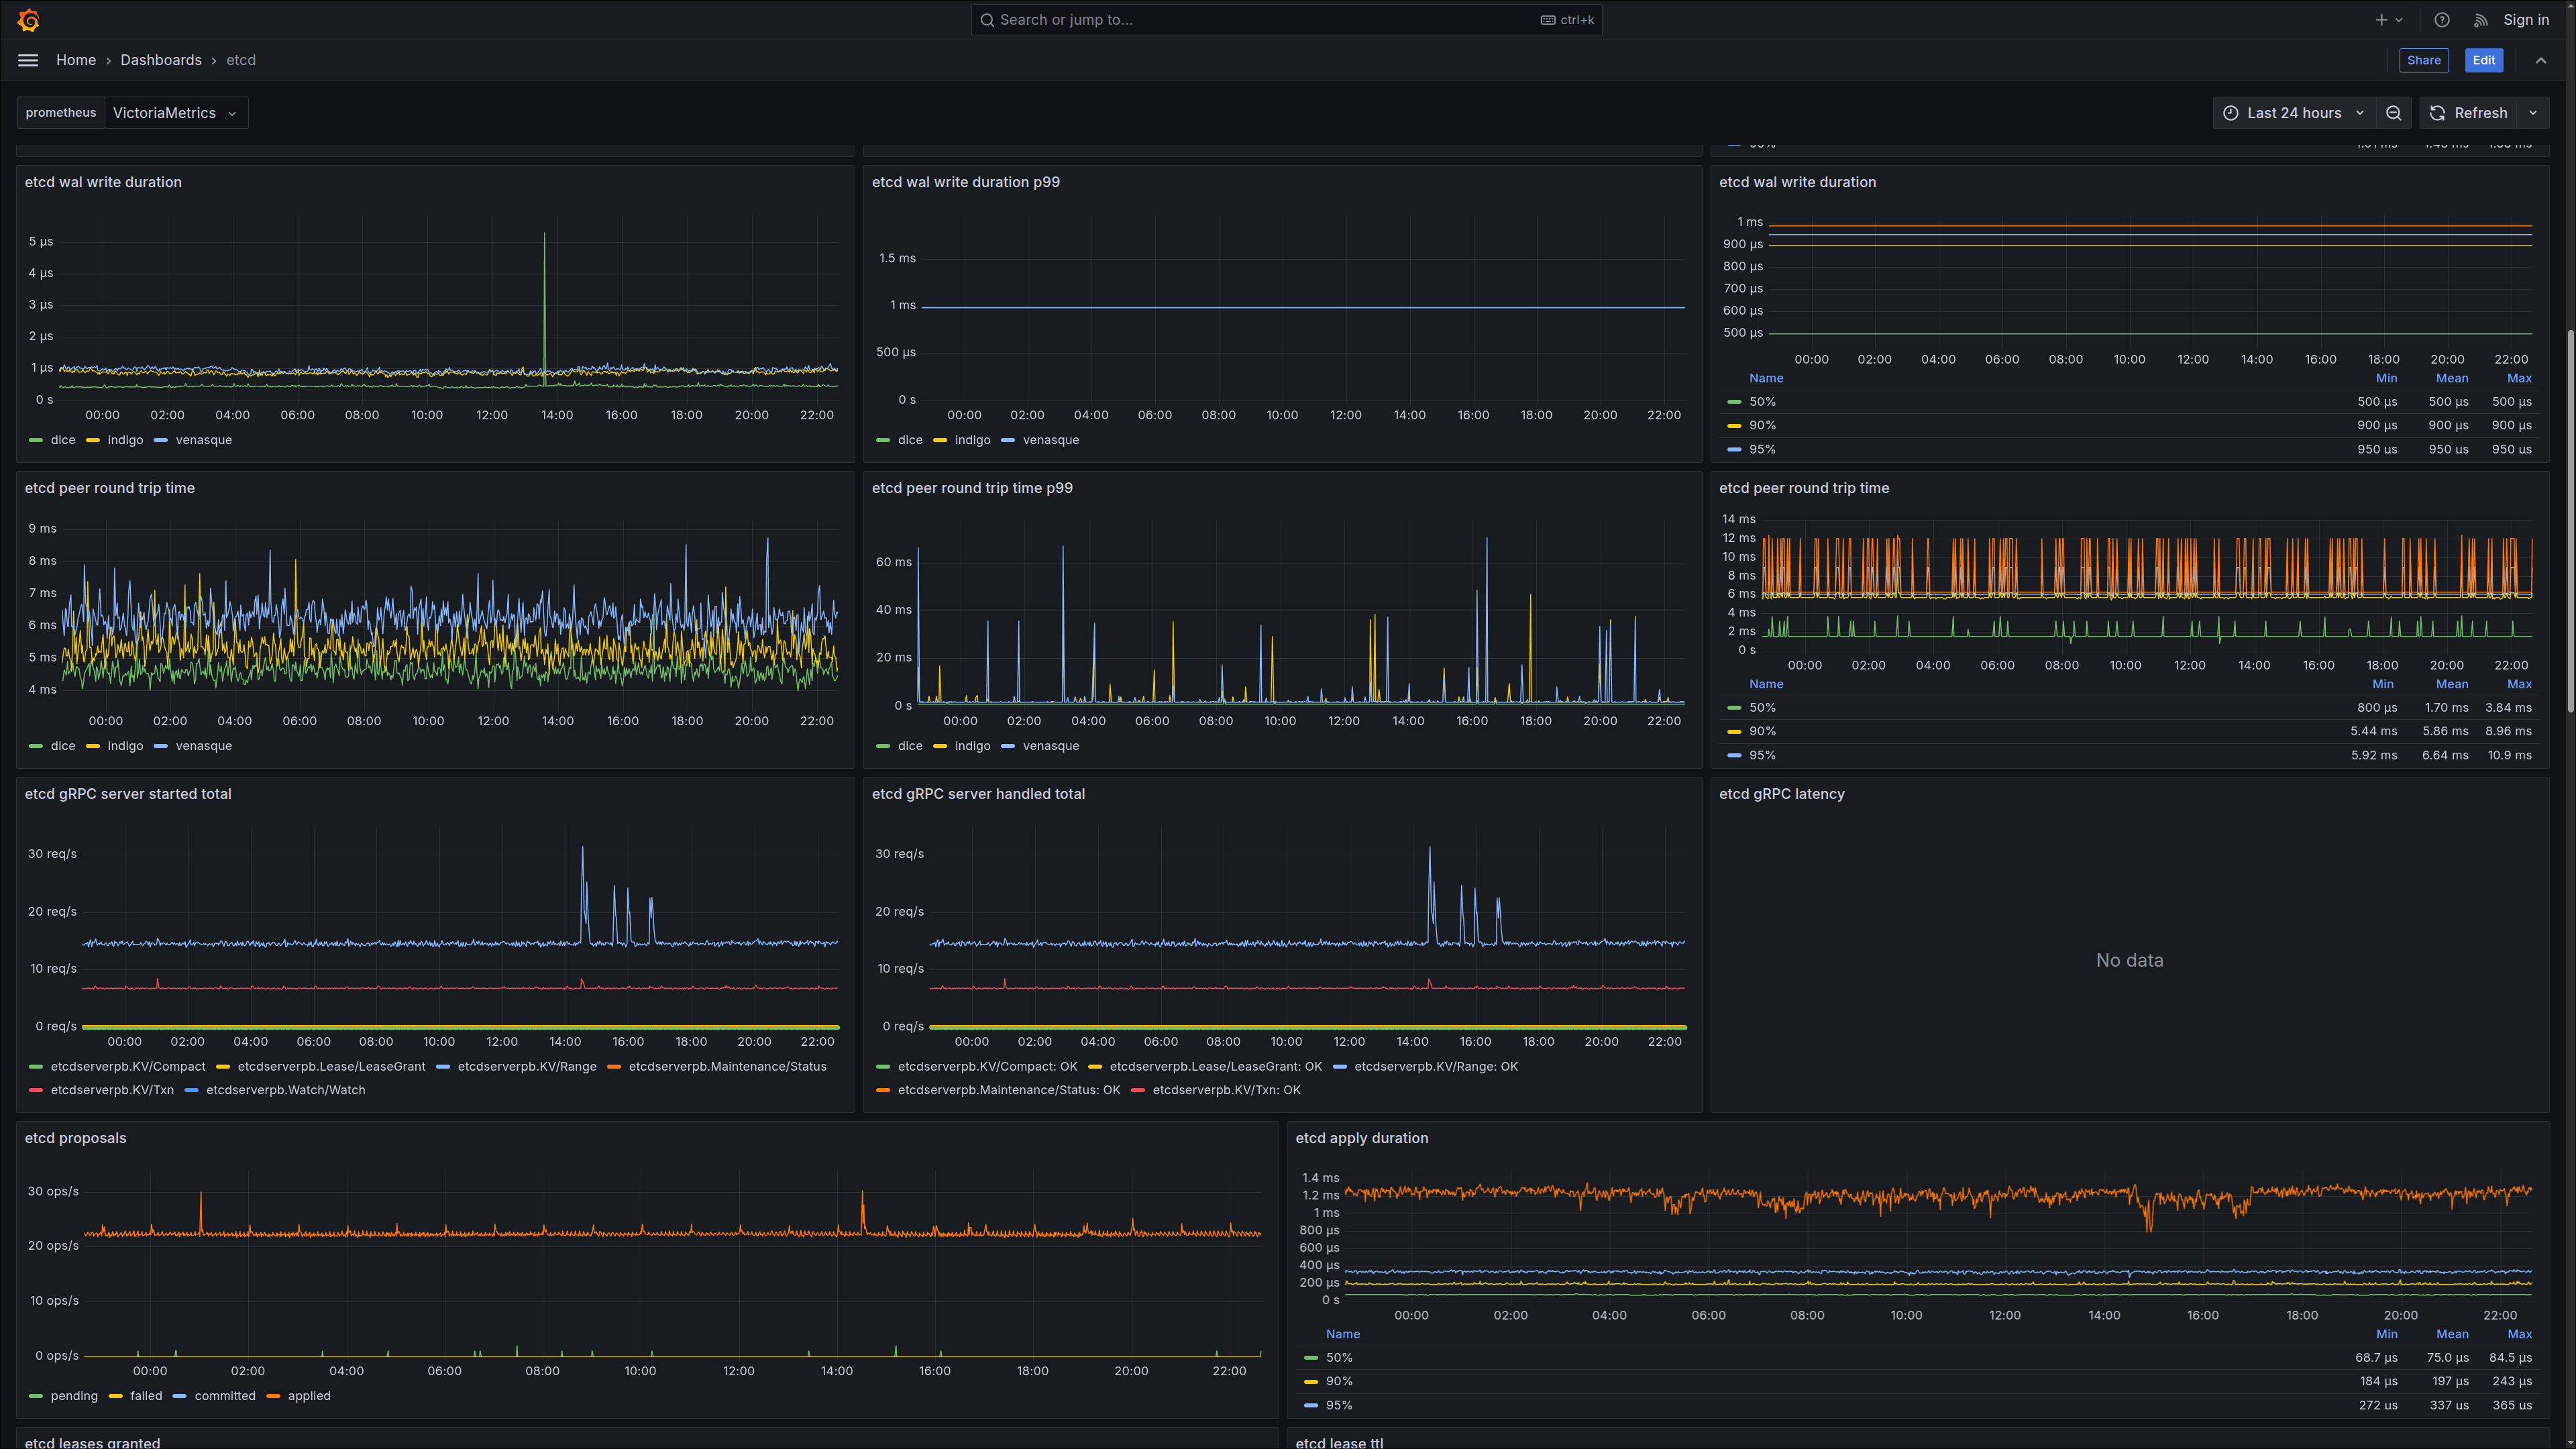
I initially designed this dashboard to monitor a 3 node etcd cluster running in Kubernetes, but have adapted it for use with a Kubernetes control plane etcd cluster. It maybe needs a bit of refinement and some instance selectors, but otherwise should provide a lot of information about the health of the cluster and make it obvious what the cluster is doing. This probably won't work amazingly well for an etcd cluster deployed in Kubernetes itself as ideally the 'pod' label would be used instead of the 'instance' label, and there is no filtering. Please provide feedback and we can work together to make it better :)
Data source config
Collector config:
Upload an updated version of an exported dashboard.json file from Grafana
| Revision | Description | Created | |
|---|---|---|---|
| Download |
etcd
Easily monitor etcd, a distributed key-value store, ewith Grafana Cloud's out-of-the-box monitoring solution.
Learn more