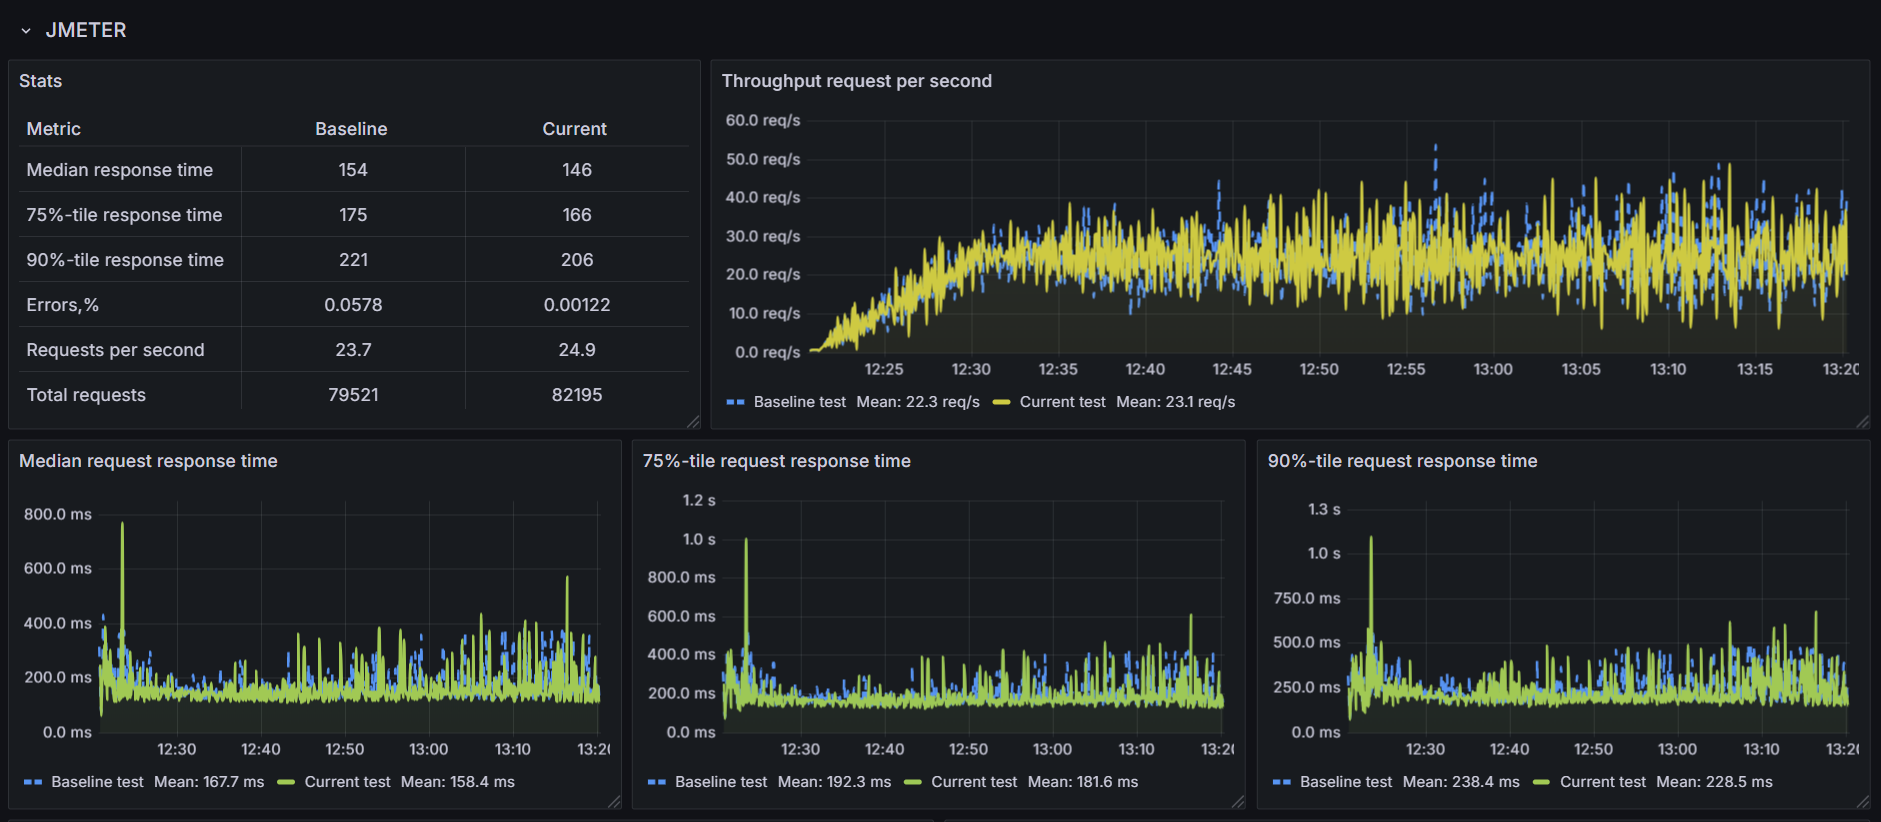
JMeter tests comparison Influxdb2 Standard Listener
This dashboard shows live load test metrics provided by JMeter stored in Influxdb2.
The dashboard allows to visualize JMeter metrics stored in Influxdb2. Dependencies:
- Grafana 9.0.3^
- InfluxDB 2.0^
- BackendListener: org.apache.jmeter.visualizers.backend.influxdb.InfluxdbBackendListenerClient
How to configure:
- Create new InfluxDB Bucket and Token.
- Configure JMeter backend listener.
Note: It is very important to add a unique TAG_testTitle to be able to visualize the data for each test.
   - Backend listener implementation: org.apache.jmeter.visualizers.backend.influxdb.InfluxdbBackendListenerClient
   - influxdbUrl: http://YOUR_INFLUXDB_IP:8086/api/v2/write?org=YOUR_ORG_NAME&bucket=YOUR_BUCKET_NAME
   - application: YOUR_APP_NAME
   - measurement: jmeter
   - summaryOnly: false
   - samplersRegex: .*
   - percentiles: 95;90;75;50
   - testTitle: YOUR_TEST_ID (For example: ${__time(yyyyMMdd-HHmm)}-appname)
   - influxdbToken: YOUR_TOKEN (Note: it should be added manually using add button)
   - TAG_testTitle: YOUR_TEST_ID (For example: ${__time(yyyyMMdd-HHmm)}-appname)
- OPTIONAL: Configure backend listener in jmeter.properties or user.properties files: Let's say we need to generate around 6000 rps in our test, we can set up sending the test result once every 10 seconds by changing the «backend_influxdb.send_interval» parameter. Then we need to change «QUEUE_SIZE» and «backend_metrics_large_window» to 60000 (6000 x 10 s). For good performance it better to use «timed» window mode. That completely cleans up the set of collected metrics after sending, while fixed constantly stores this queue, adds new values to the end and deletes the old ones.
   QUEUE_SIZE=60000                   //default: 5000
   backend_metrics_window_mode=timed  //default: fixed
   backend_metrics_large_window=60000 //default: 5000
   backend_influxdb.send_interval=10  //default: 5 seconds
- Add InfluxDB as a data source in Grafana using your bucket and token.
- Create a folder for your project if it doesn't already exist.
- Import Grafana dashboard. When importing, you need to specify the "send_interval" configured in JMeter (the default is 5 seconds) and the transaction_mark. The transaction_mark is used to distinguish between transactions and requests. For example, if your naming convention includes "TR" for each transaction, you can simply type "TR" to ensure proper graph generation.
Developed by the PerForge team.
Data source config
Collector type:
Collector plugins:
Collector config:
Revisions
Upload an updated version of an exported dashboard.json file from Grafana
| Revision | Description | Created | |
|---|---|---|---|
| Download |
