CriblVision
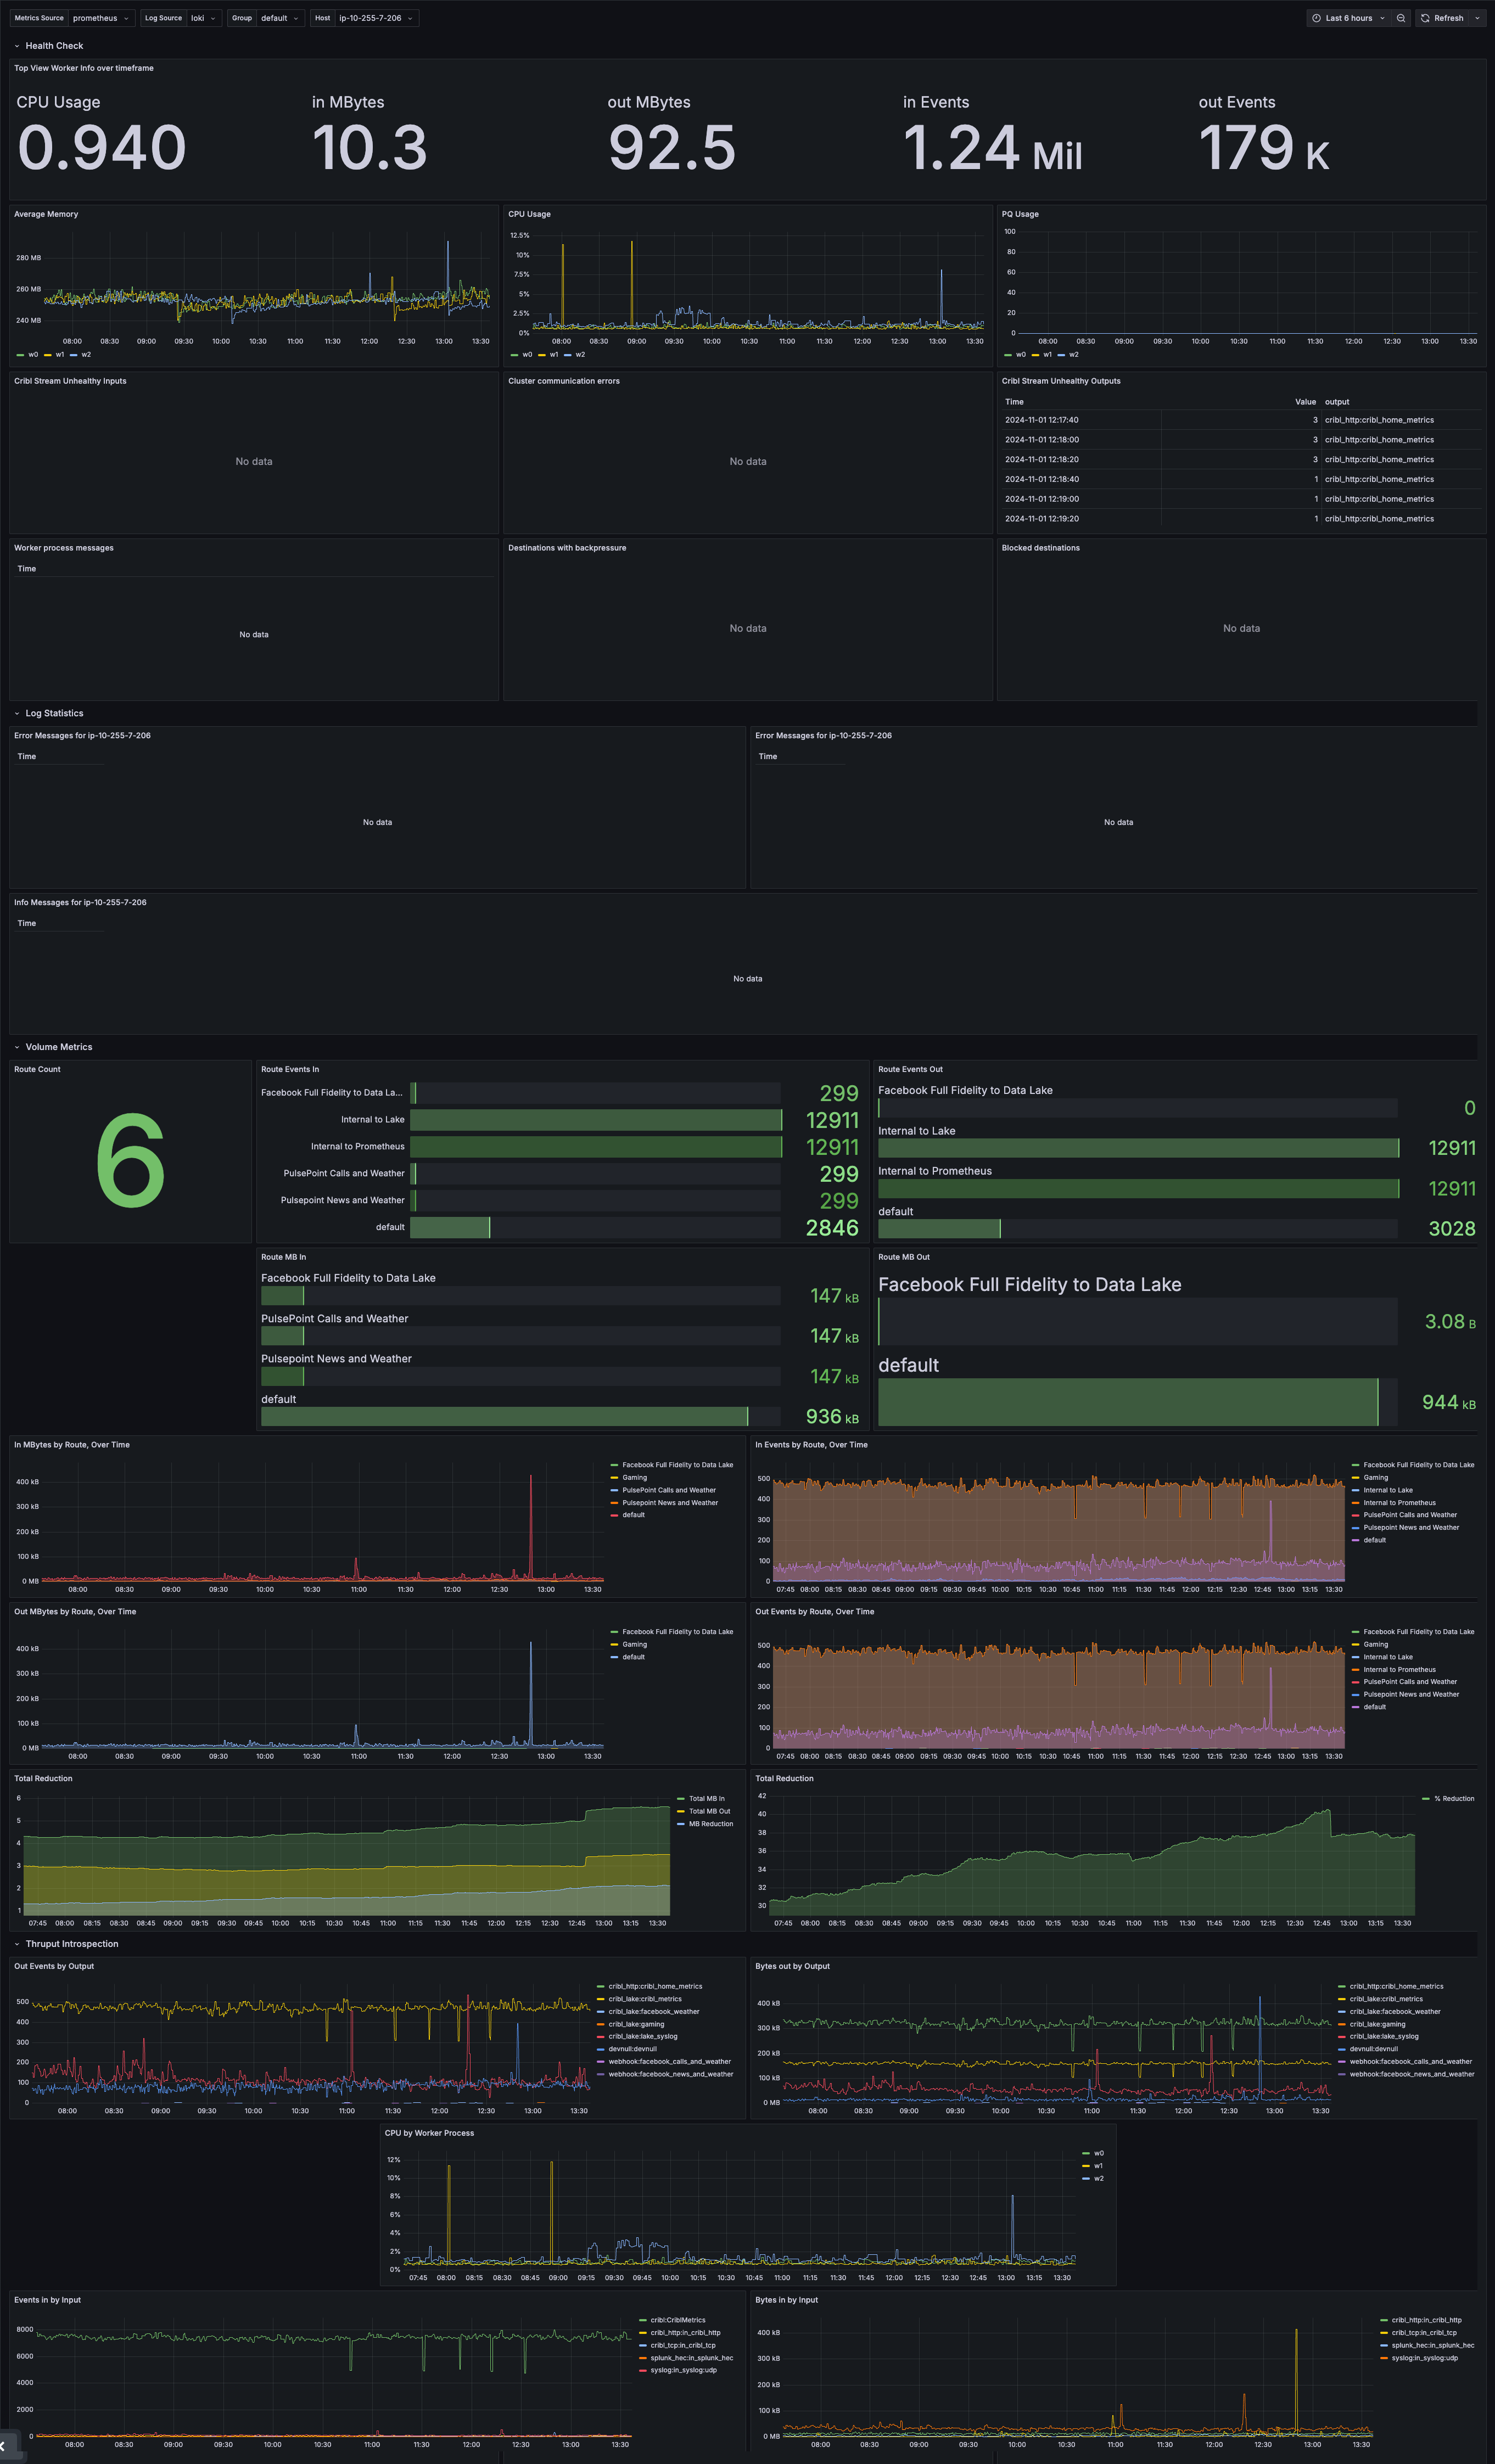
This Grafana dashboard was created by Cribl Support Engineers to help customers troubleshoot their own Cribl deployments. It is designed to provide a comprehensive overview of the health and performance of a Cribl deployment. This was designed to be used in conjunction with the Cribl Monitoring Console.
CriblVision for Grafana
Getting Started
This Grafana dashboard was created by Cribl Support Engineers to help customers troubleshoot their own Cribl deployments. It is designed to provide a comprehensive overview of the health and performance of a Cribl deployment. This was designed to be used in conjunction with the Cribl Monitoring Console.
Logs and Metrics
Cribl internal logs and metrics must be enabled and forwarded to Prometheus(metrics) and Loki(logs) destinations in order for all of the panels to populate with events. Refer to the documentation here for instructions on configuring this Source.
For this dashboard, you will need a Loki instance as well as a Prometheus instance with Remote Write enabled with the following flag: --enable-feature=remote-write-receiver
Leader Logs
Some of the view in this app will require Leader logs to be forwarded to Grafana. In distributed Cribl Stream environments, Leader logs are currently NOT sent via our internal Source. You will have to install a Cribl Edge Node on your Leader Node and configure local log collection via a file monitor input. Configure the file monitor input to collect logs by configuring the filename modal to /opt/cribl/log/*. For more information on how to deploy a Cribl Edge Node, please refer to our documentation here.
Source and Destination configuration in Cribl
For your internal logs source, you will need to configure the following:
- Source
groupfield should be set to the name of the Worker Group
- Destination
prometheus_metricspipeline should be enabled for thePrometheusdestinationserviceset toCriblfor Loki destination underAdvanced Settings
Using This Dashboard
In addition to this overview page, this app provides several views intended to aid a Cribl admin in troubleshooting and assessing the health of a Cribl deployment. We recommend starting with the Health Check view and selecting a single Worker Group or Worker Node from the provided filters.
Data source config
Collector config:
Upload an updated version of an exported dashboard.json file from Grafana
| Revision | Description | Created | |
|---|---|---|---|
| Download |