UPDATED - Flyte User Dashboard (via Prometheus)
Flyte User Dashboard. It's designed to give an overview of execution status and resource consumption.
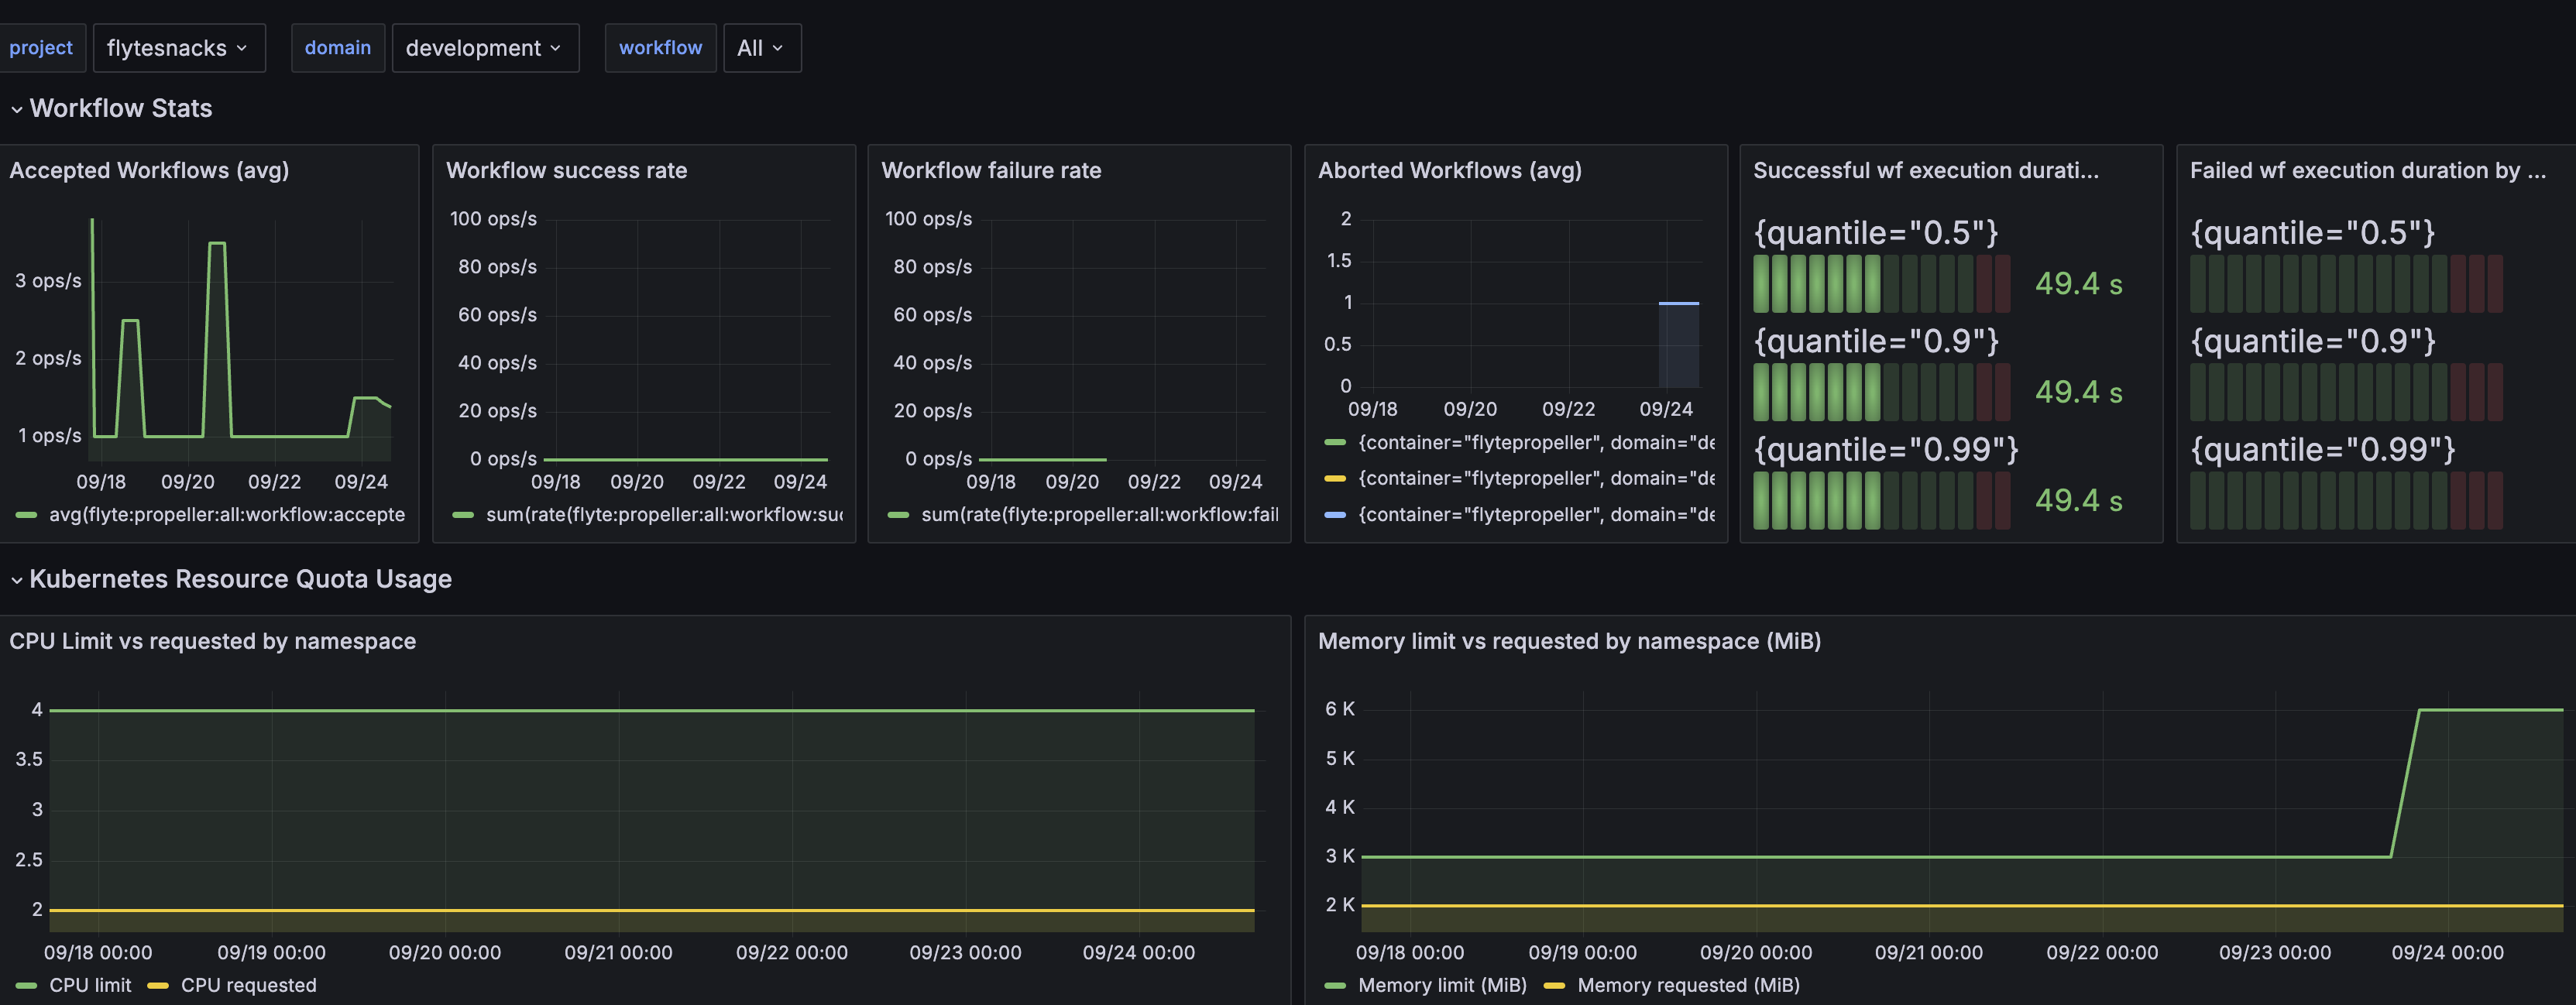
This specific dashboard has a dependency on kube-state-metrics (https://github.com/kubernetes/kube-state-metrics).
- Check out the Flyte monitoring docs for additional setup instructions: https://docs.flyte.org/en/latest/deployment/configuration/monitoring.html
- Please report any bugs by filing an issue on the Flyte repo: https://github.com/flyteorg/flyte/
- Questions? Join us on Slack: https://slack.flyte.org
Data source config
Collector type:
Collector plugins:
Collector config:
Revisions
Upload an updated version of an exported dashboard.json file from Grafana
| Revision | Description | Created | |
|---|---|---|---|
| Download |