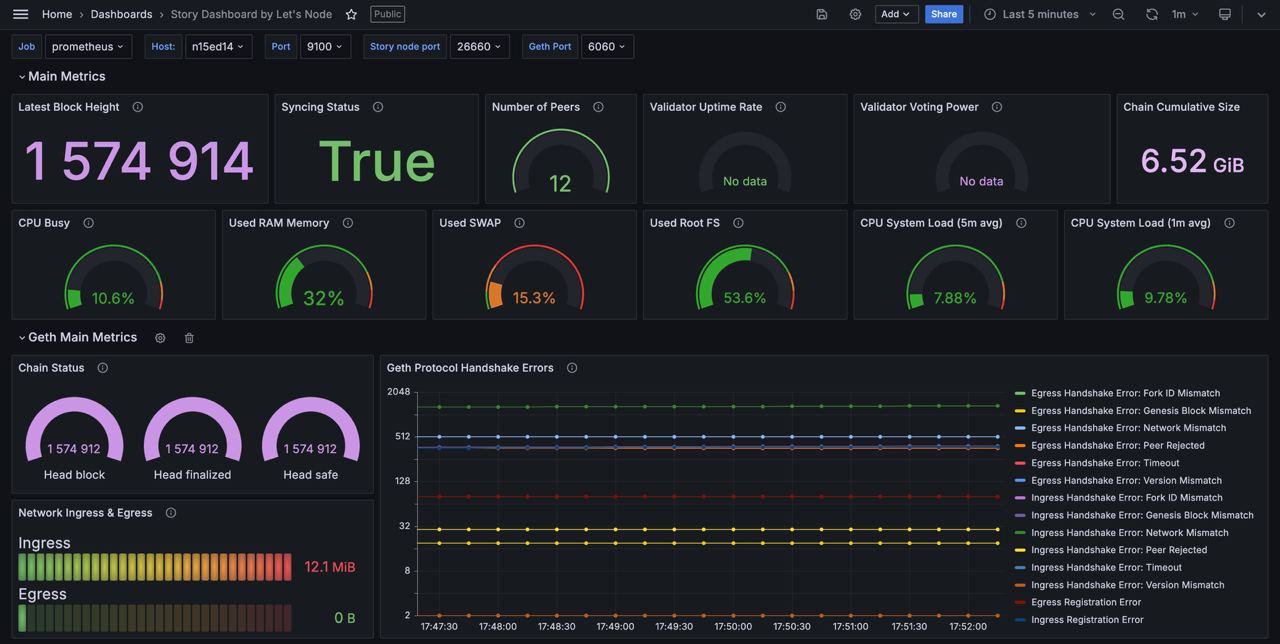
Story Dashboard by Lets Node & UTSA
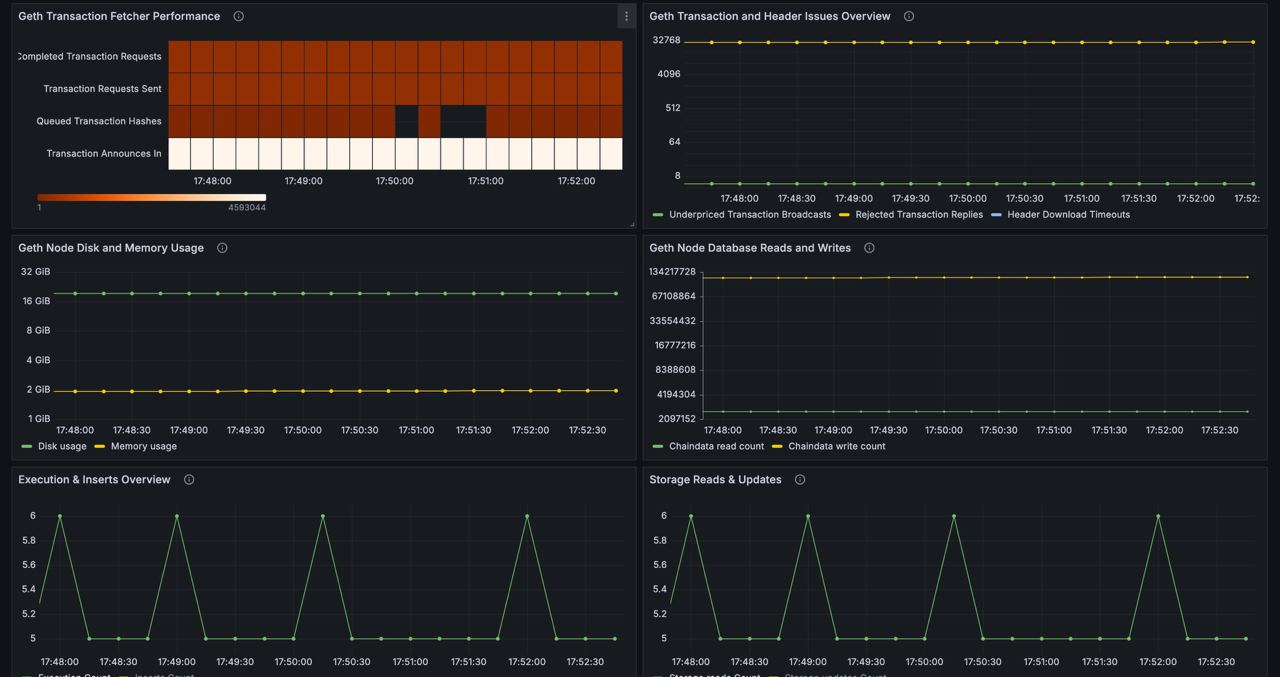
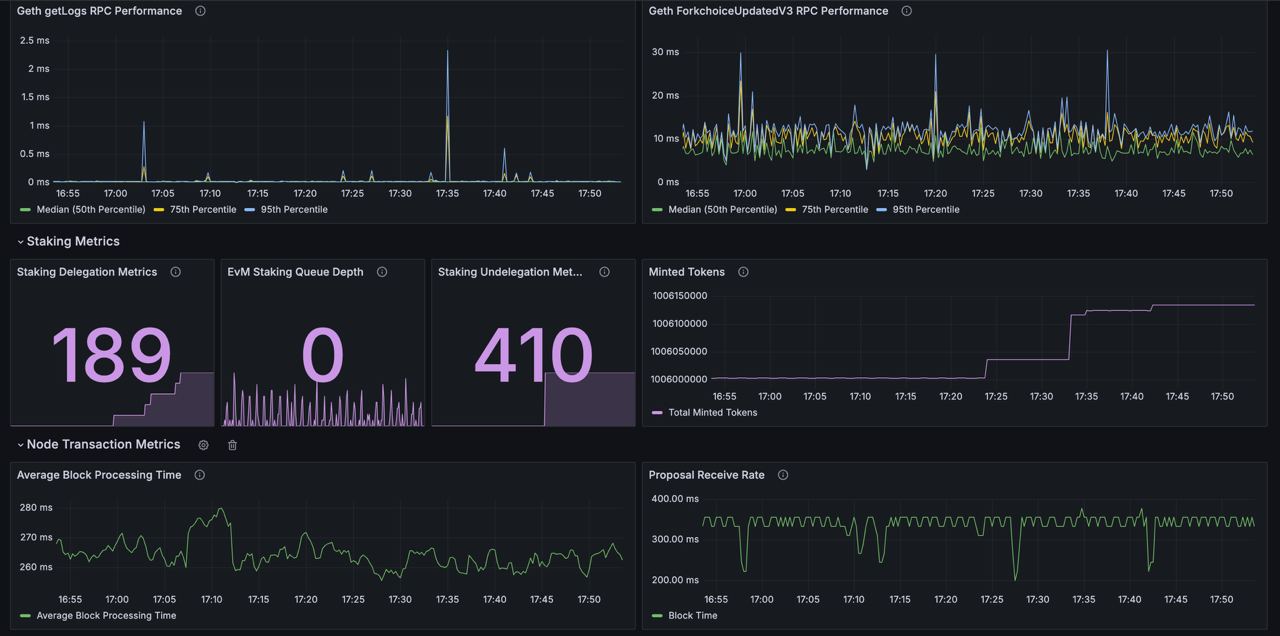
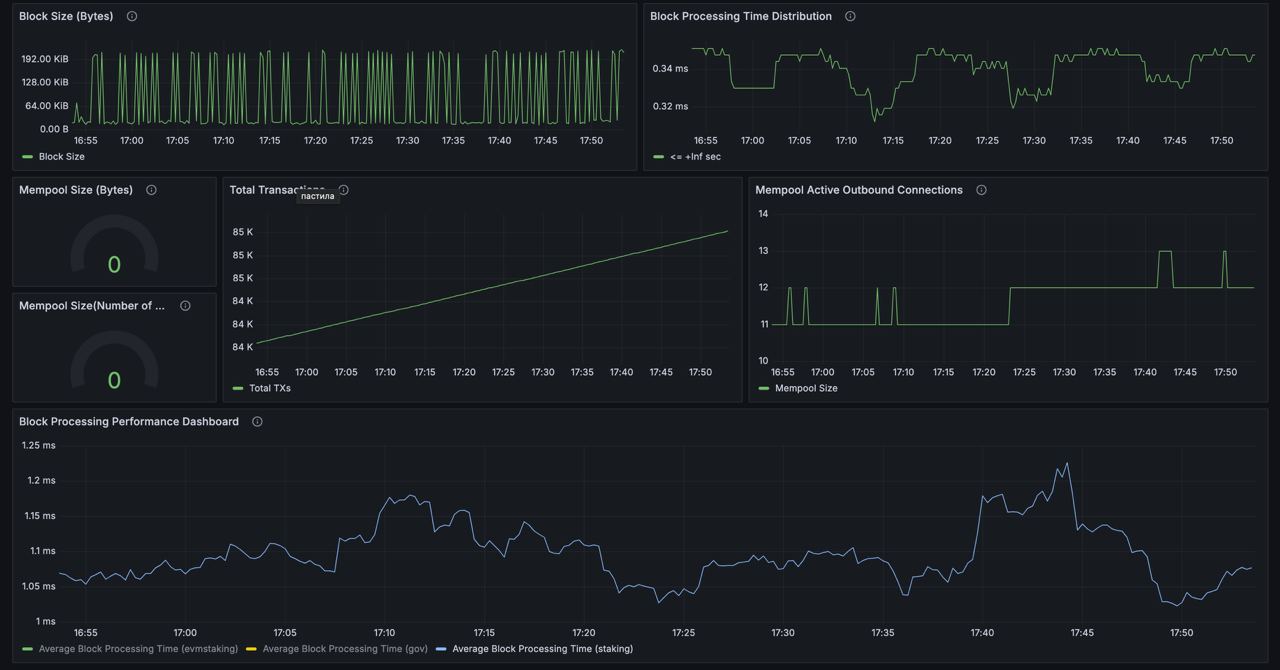
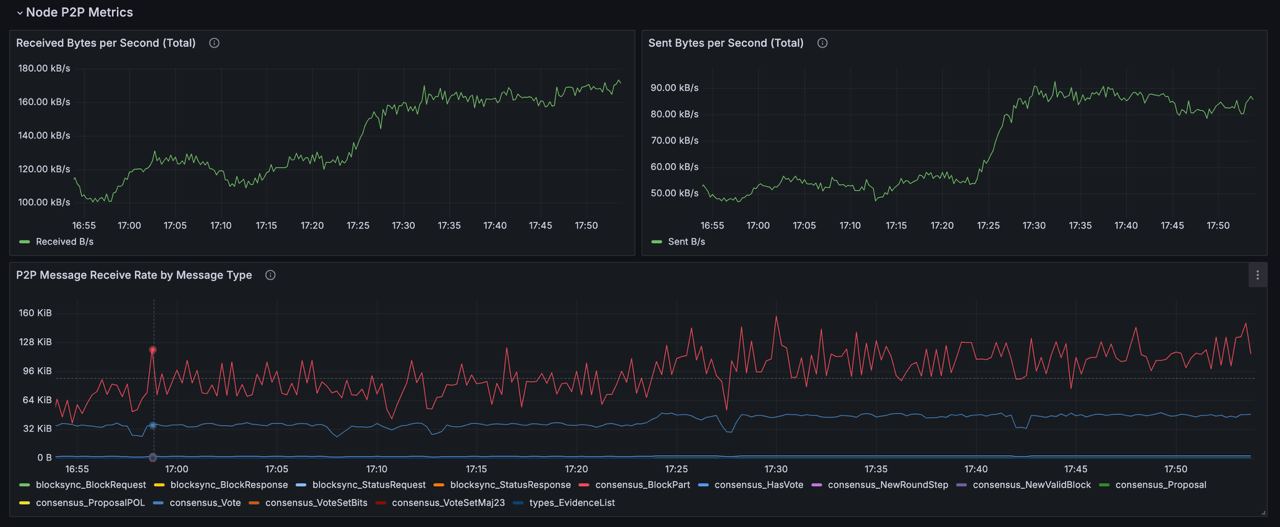
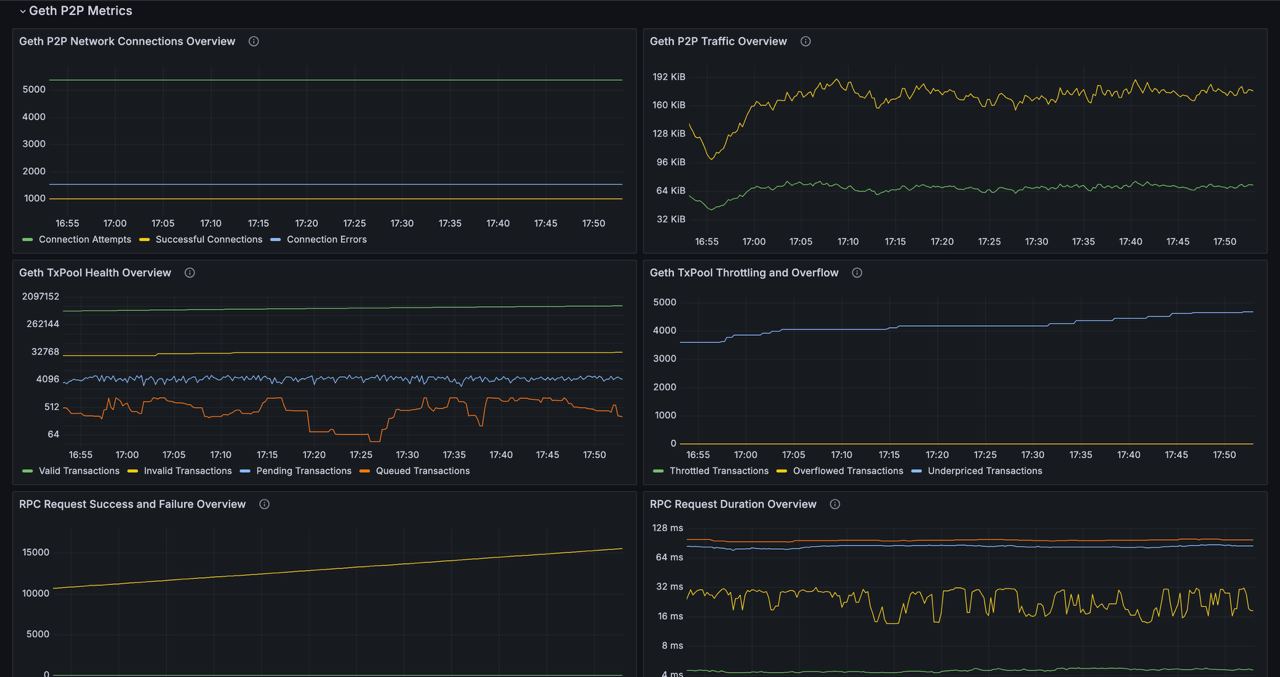
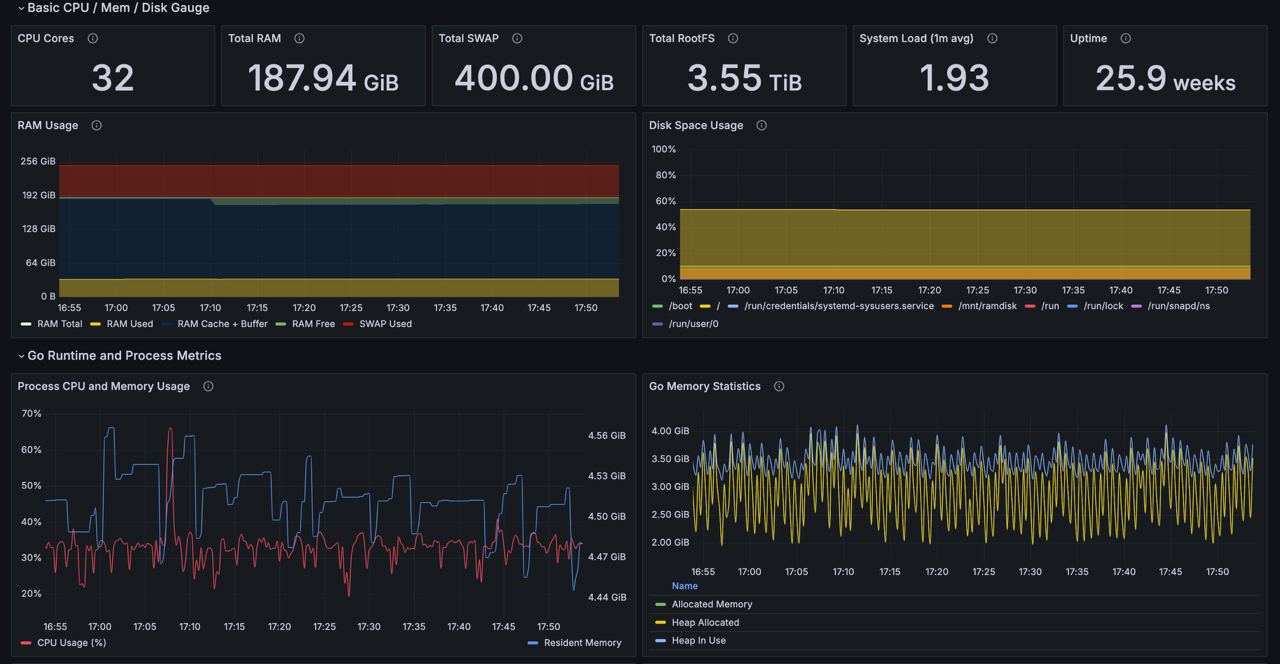
The Story Dashboard by Let's Node & UTSA dashboard uses the prometheus data source to create a Grafana dashboard with the barchart, bargauge, gauge, heatmap, stat and timeseries panels
To set it up, you could check our guide in GitHub
Data source config
Collector type:
Collector plugins:
Collector config:
Revisions
Upload an updated version of an exported dashboard.json file from Grafana
| Revision | Description | Created | |
|---|---|---|---|
| Download |
Linux Server
Monitor Linux with Grafana. Easily monitor your Linux deployment with Grafana Cloud's out-of-the-box monitoring solution.
Learn more