JVM SpringBoot3 dashboard (for Prometheus Operator)
JVM monitoring Spring Boot 3 architecture dashboard by Prometheus Operator
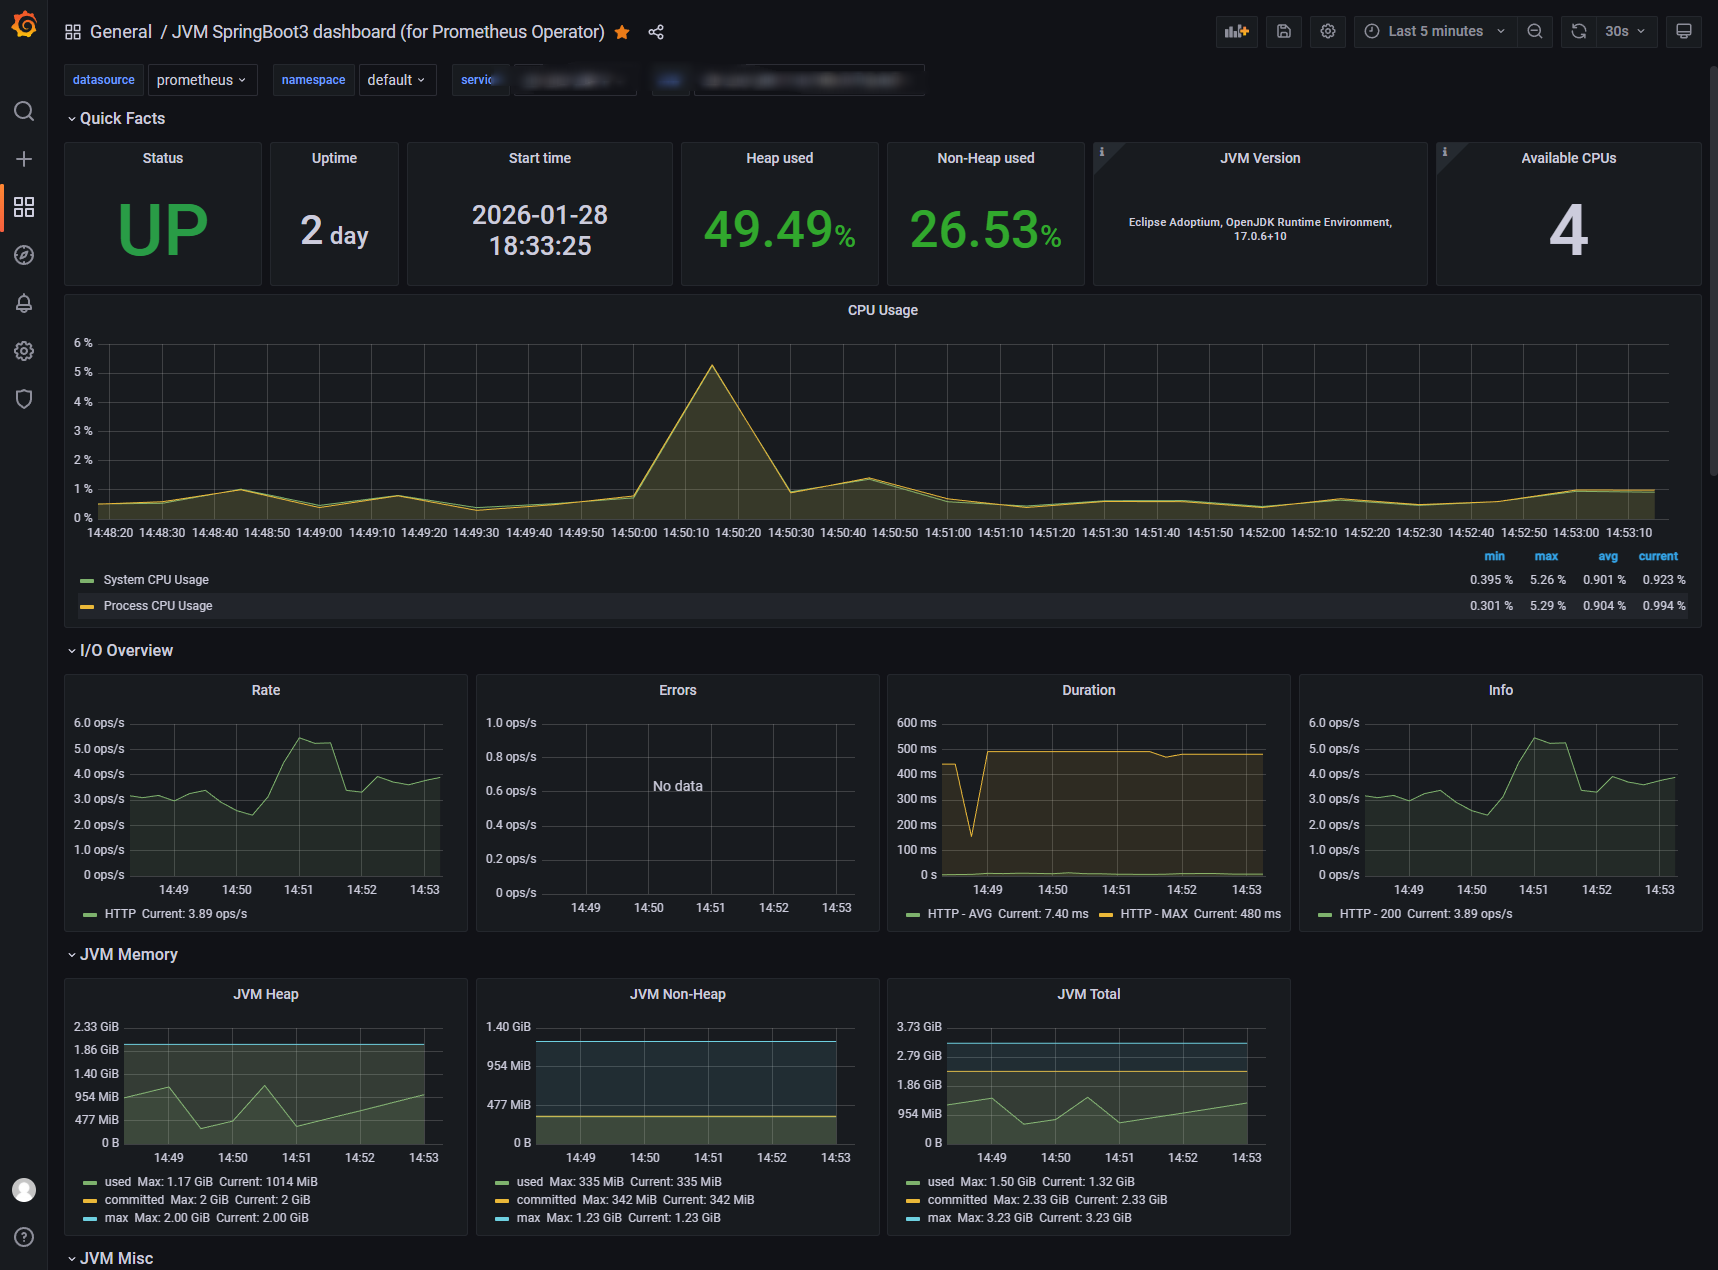
Spring Boot 3 Application Monitoring with Prometheus and Grafana
After upgrading the Spring Boot 3 application, suitable Grafana dashboards for the Prometheus Operator were not available, so I integrated them. I referenced dashboards with ID 8878 and ID 4701. Thank you for your contributions.
Steps to Integrate Monitoring
Include Necessary Dependencies Add the following dependency in your Spring Boot 3 project's pom.xml:
<dependency>
    <groupId>io.micrometer</groupId>
    <artifactId>micrometer-registry-prometheus</artifactId>
</dependency>
Verify Prometheus Endpoint Ensure that the /actuator/prometheus path of the application can return data.
Ensure Kubernetes Installation Make sure Kubernetes has the Prometheus Operator/kube-prometheus installed.
Edit ServiceMonitor for Monitoring Create or edit a ServiceMonitor resource:
apiVersion: monitoring.coreos.com/v1
kind: ServiceMonitor
metadata:
  name: springboot3-demo
  namespace: default
  labels:
    app: springboot3-demo
spec:
  endpoints:
  - port: http
    # According to project configuration
    # path: /springboot3-demo/actuator/prometheus
    path: /actuator/prometheus
    interval: 5s
  namespaceSelector:
    matchNames:
    - default
  selector:
    matchLabels:
      app: springboot3-demo
We also need to create a Service resource:
kind: Service
apiVersion: v1
metadata:
  labels:
    app: springboot3-demo
  name: springboot3-demo
spec:
  ports:
  - protocol: TCP
    port: 80
    targetPort: 80
    name: http
  selector:
    app: springboot3-demo
Import Grafana Dashboard Import the dashboard with ID 22108 in Grafana.
Alternative Method You can also modify the prometheus.yml configuration file to add monitoring items, though this method hasn't been tested:
scrape_configs:
  - job_name: 'springboot3-demo'
    metrics_path: '/actuator/prometheus'
    static_configs:
      - targets: ['localhost:8080']
Data source config
Collector config:
Upload an updated version of an exported dashboard.json file from Grafana
| Revision | Description | Created | |
|---|---|---|---|
| Download |
Java Virtual Machine (JVM)
Easily monitor a Java virtual machine, which allows computers to run Java programs, with Grafana Cloud's out-of-the-box monitoring solution.
Learn more