jmeter-jmx-dashboard
Dashboard for monitoring JMX metrics of the Jmeter process.
Dashboard for monitoring JMX metrics of the Jmeter process.
Allows you to track the utilization of Jmeter resources during the test.
Prometheus, Jmx-exporter and Node-exporter are used to operate the dashboard.
Detailed information on GitHub.
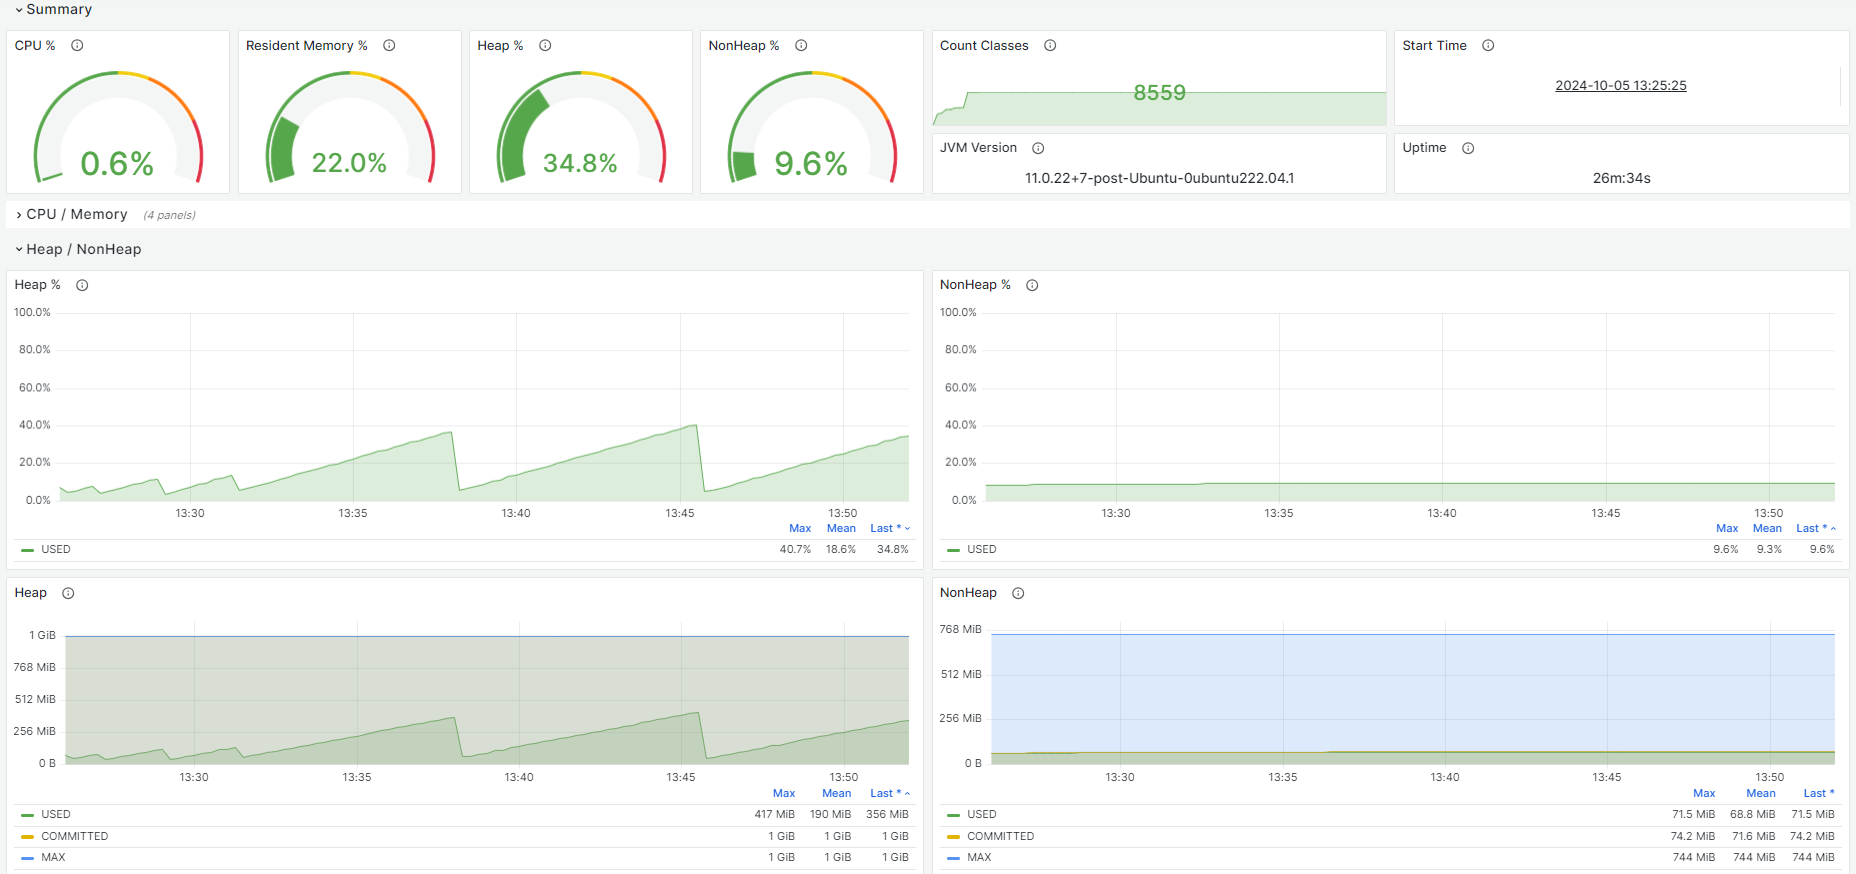
The dashboard contains:
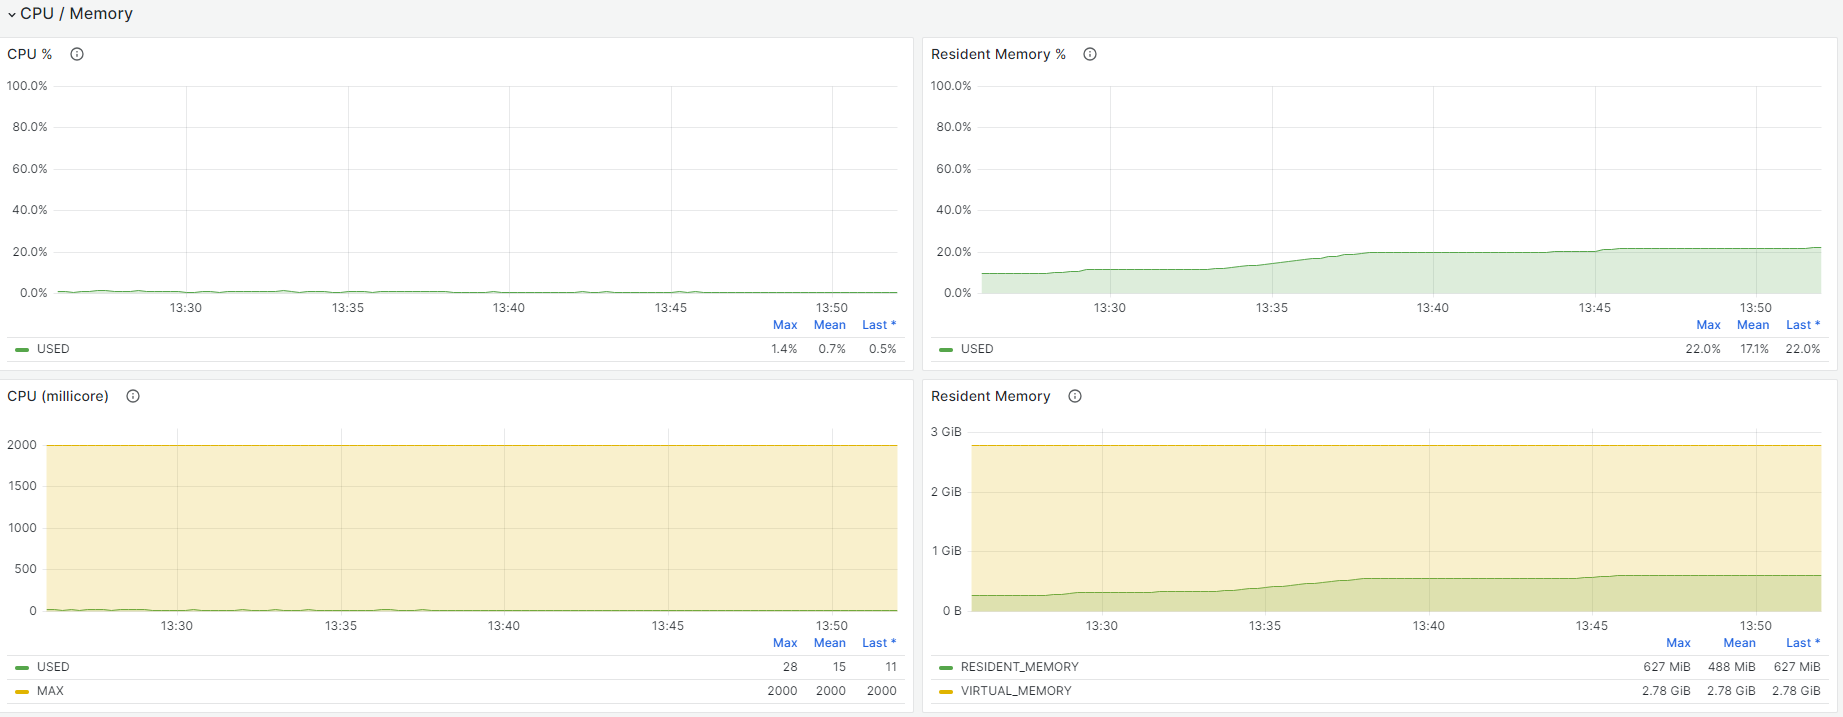
- CPU / Memory
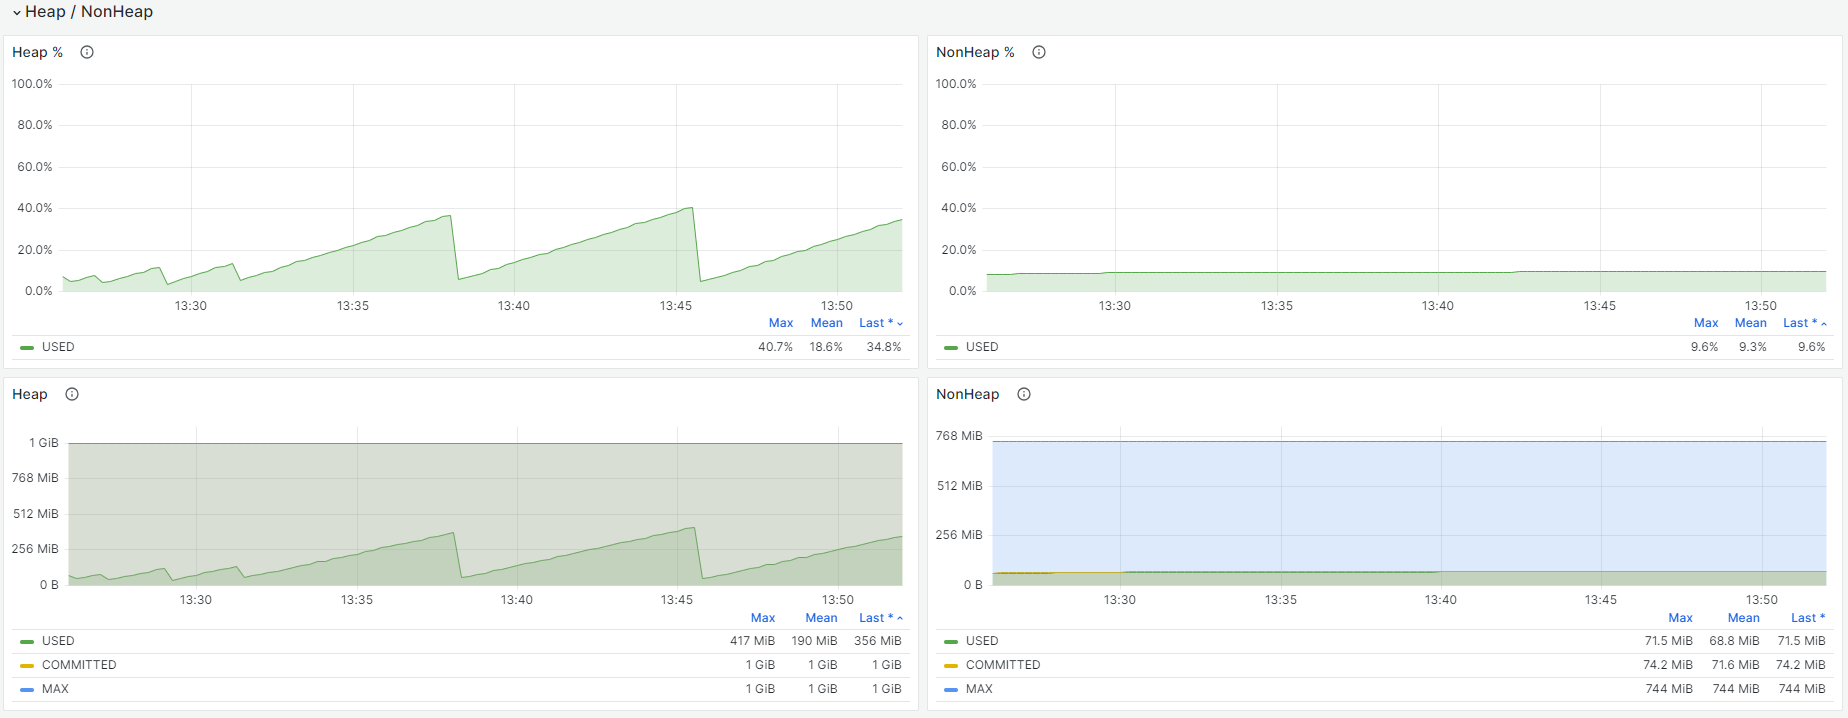
- Heap / NonHeap
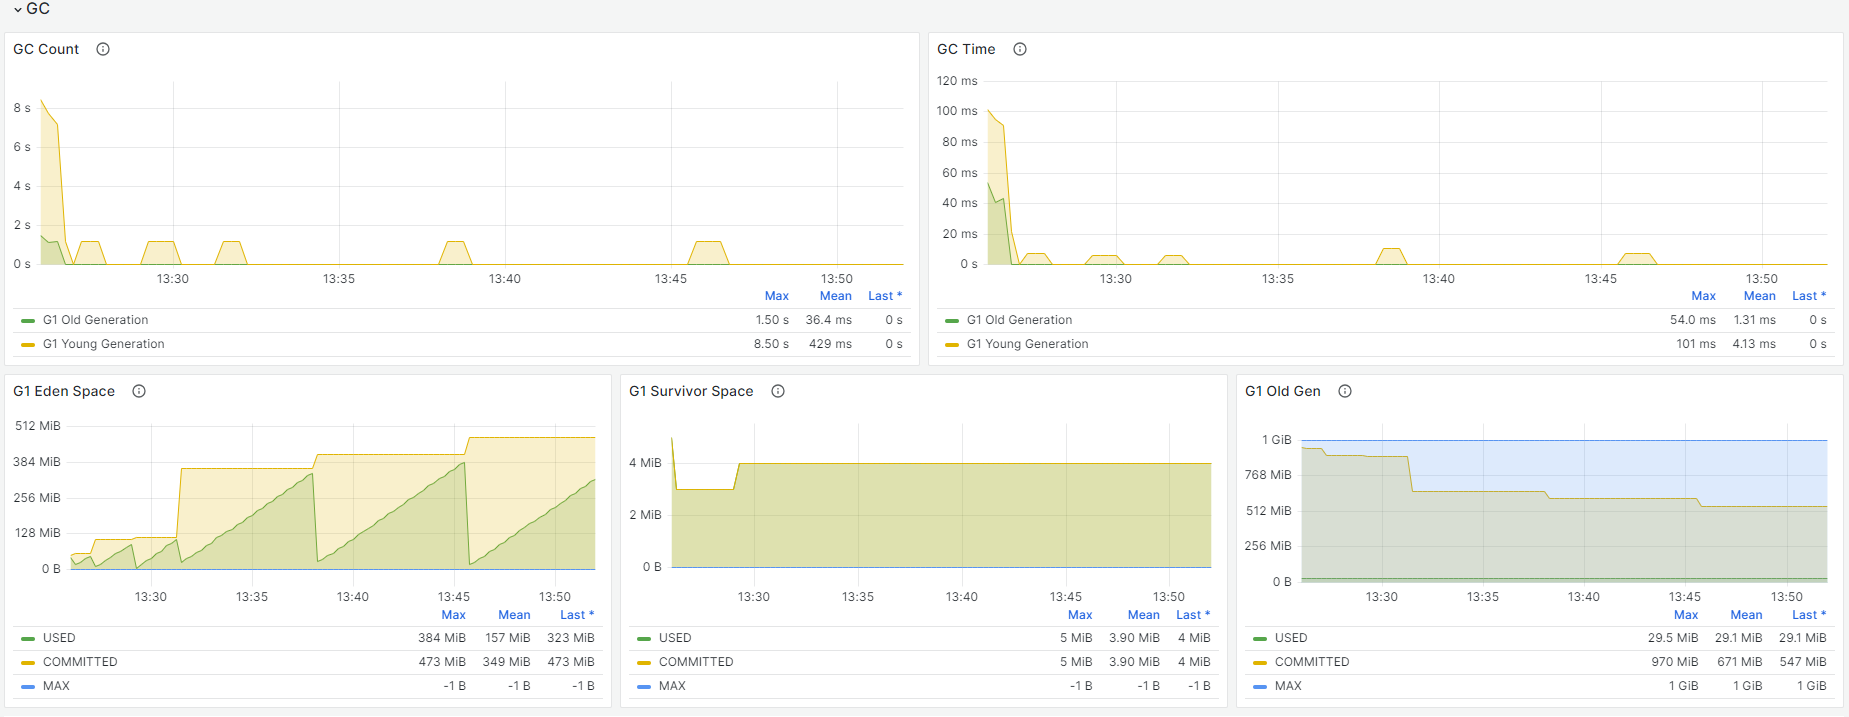
- Garbage Collection (GC)
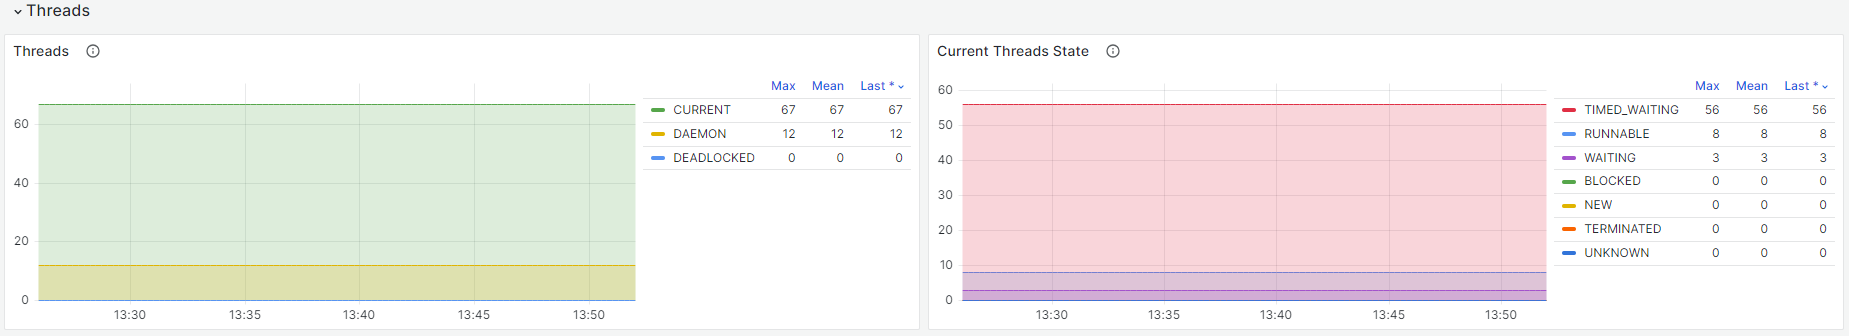
- Threads
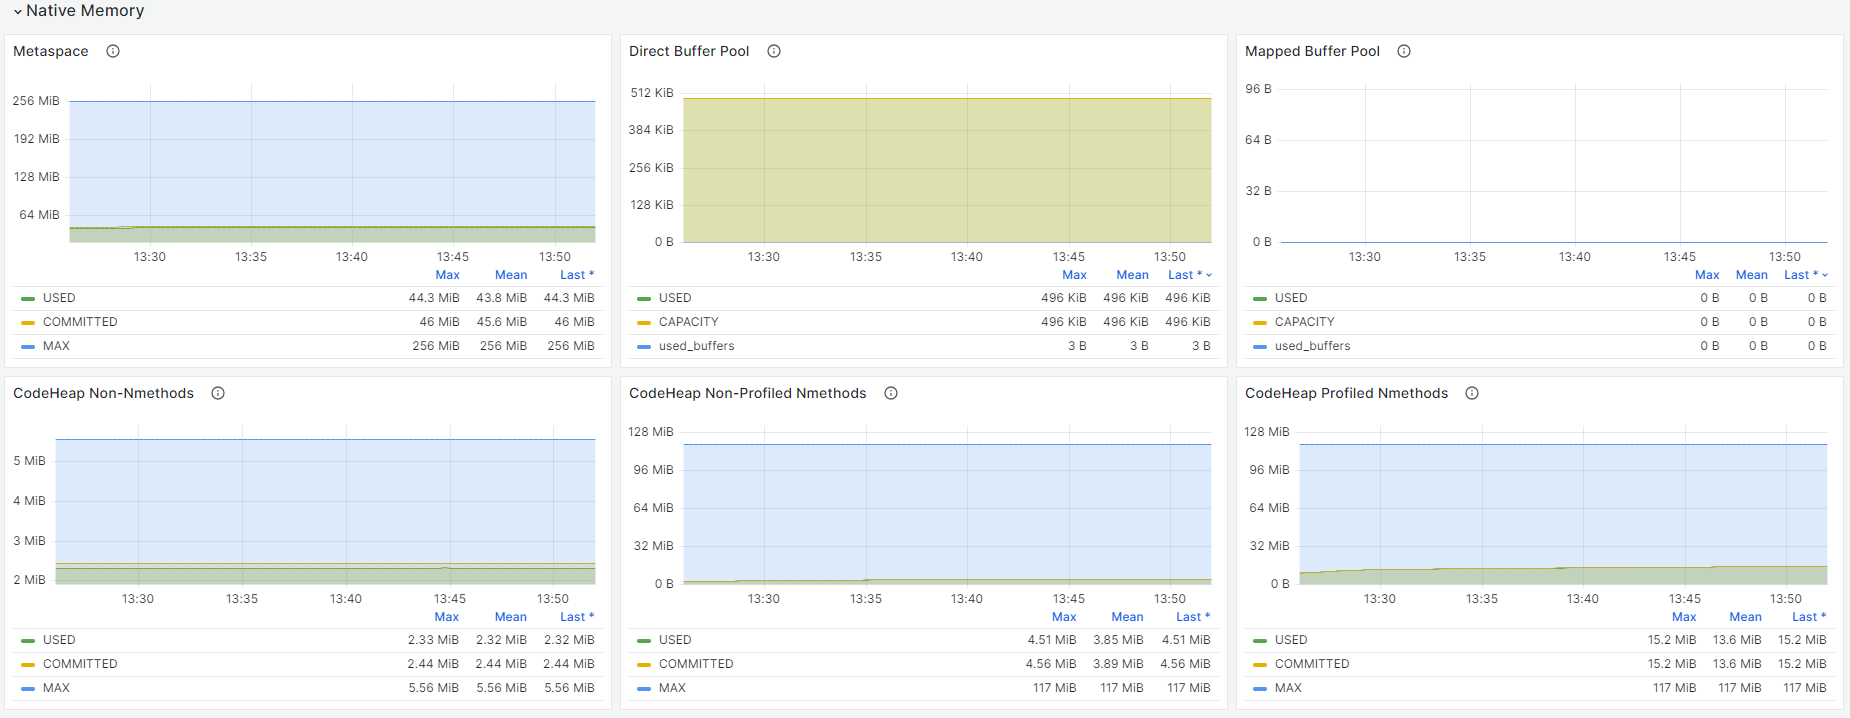
- Native Memory
Setting up the environment:
For more information on GitHub,
see Setting up the environment.
- Install Prometheus, Jxm-exporter and Node-exporter
- Deploy the sd-server
- Edit the jmeter and jmeter-server file
- Running Jmeter in Non-GUI mode
Data source config
Collector type:
Collector plugins:
Collector config:
Revisions
Upload an updated version of an exported dashboard.json file from Grafana
| Revision | Description | Created | |
|---|---|---|---|
| Download |