Stroy Node Dashboard by kjnodes
This dashboard provides a comprehensive view of key metrics from Story Protocol node. It offers insights into node performance, health and activity.
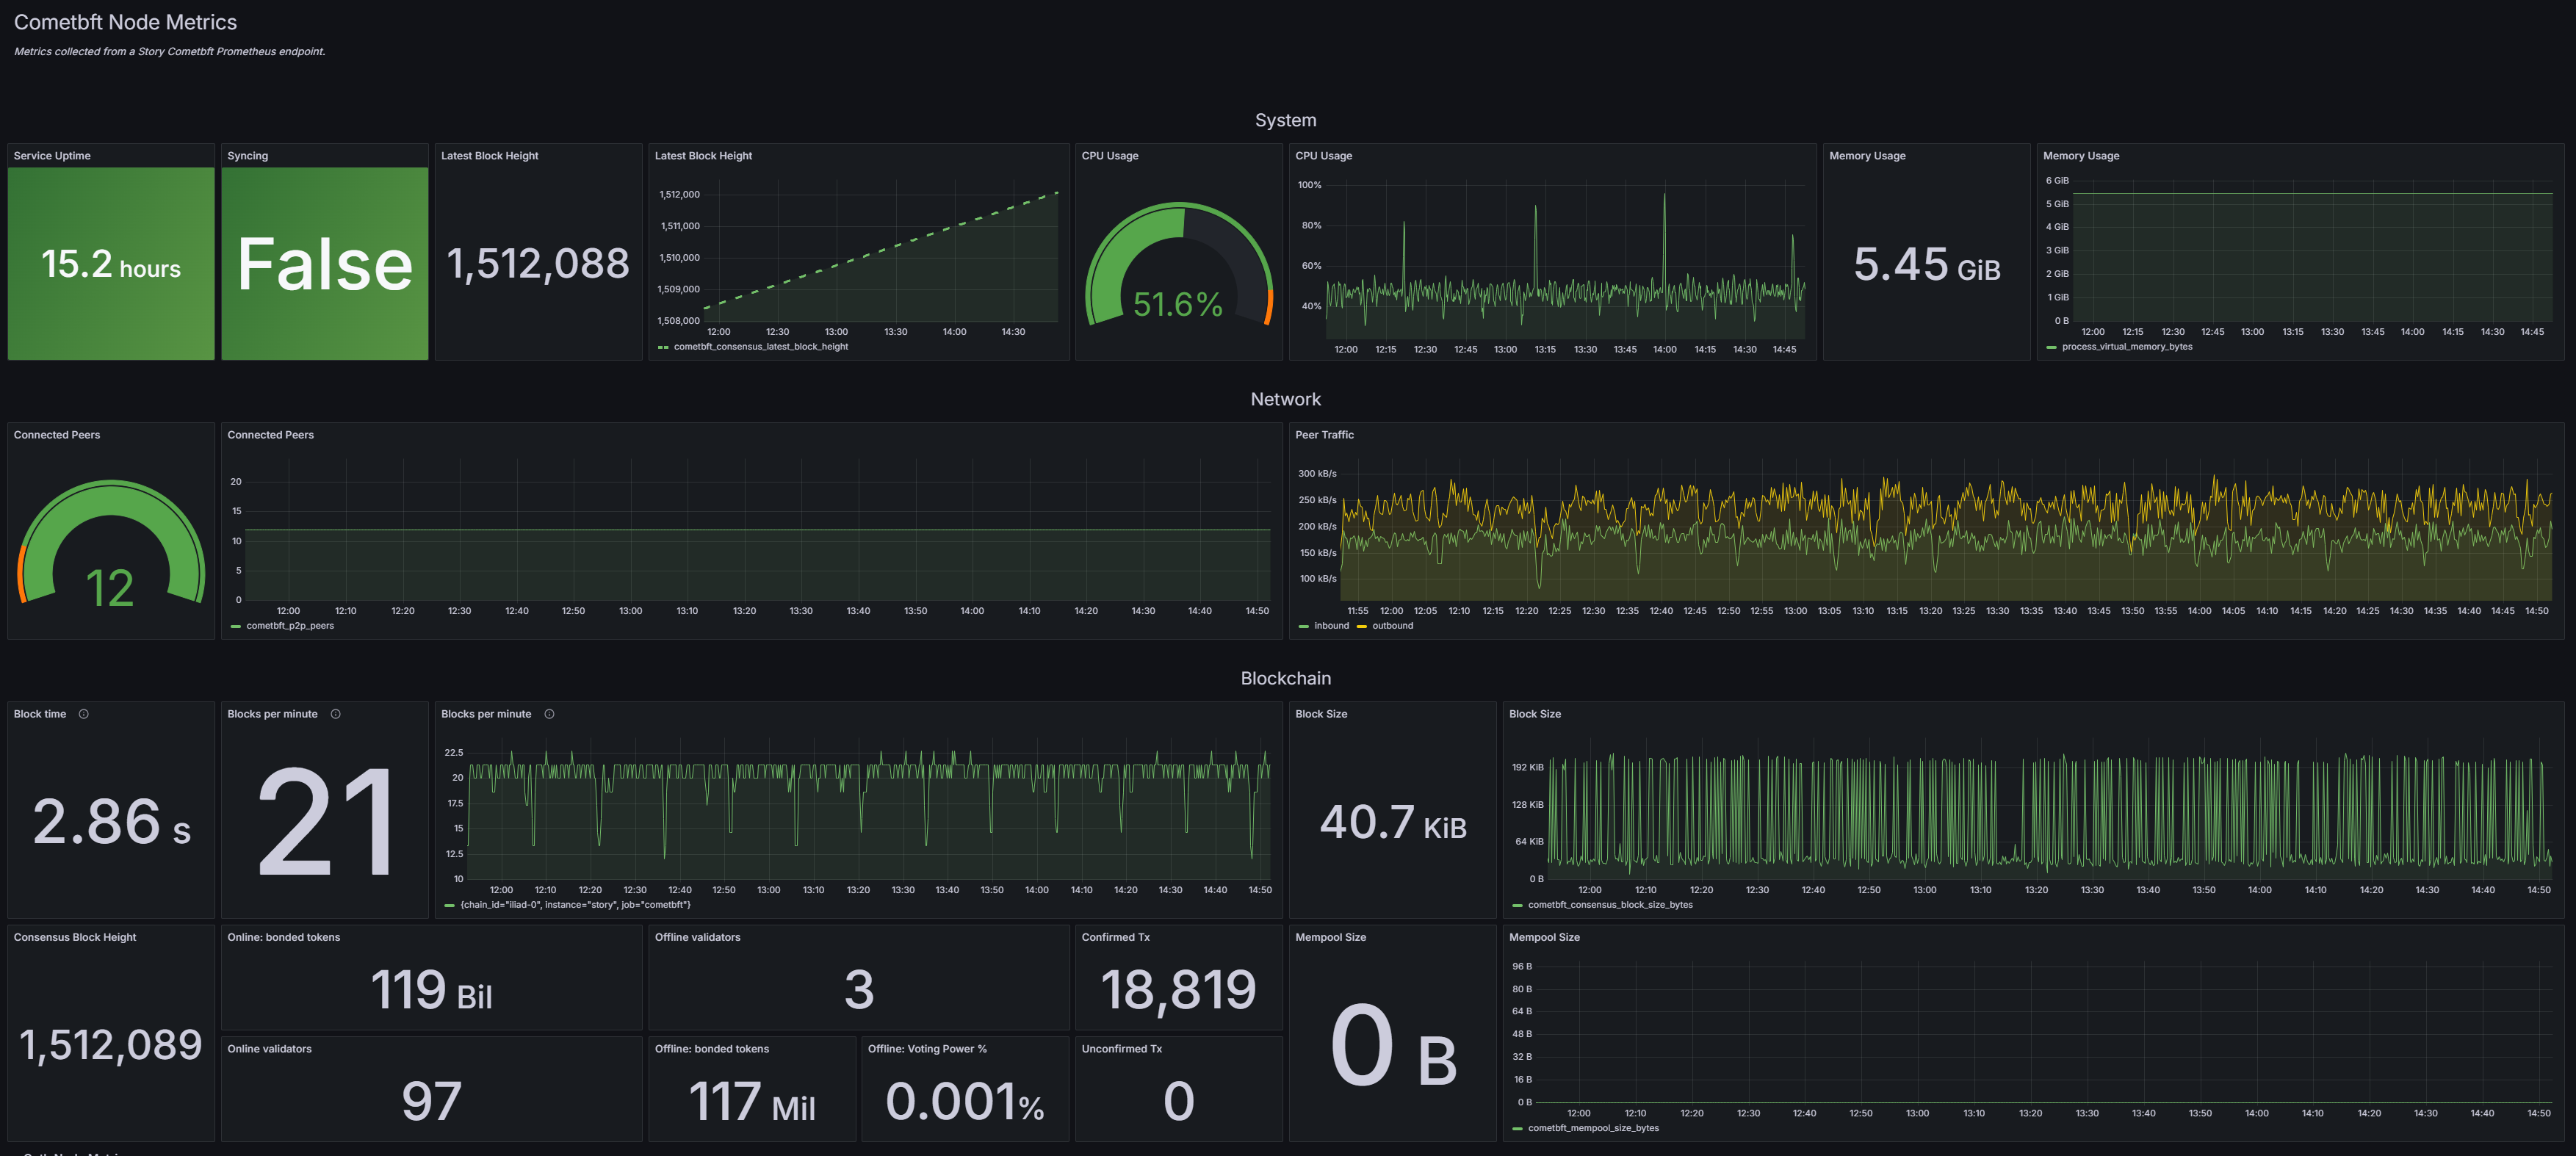
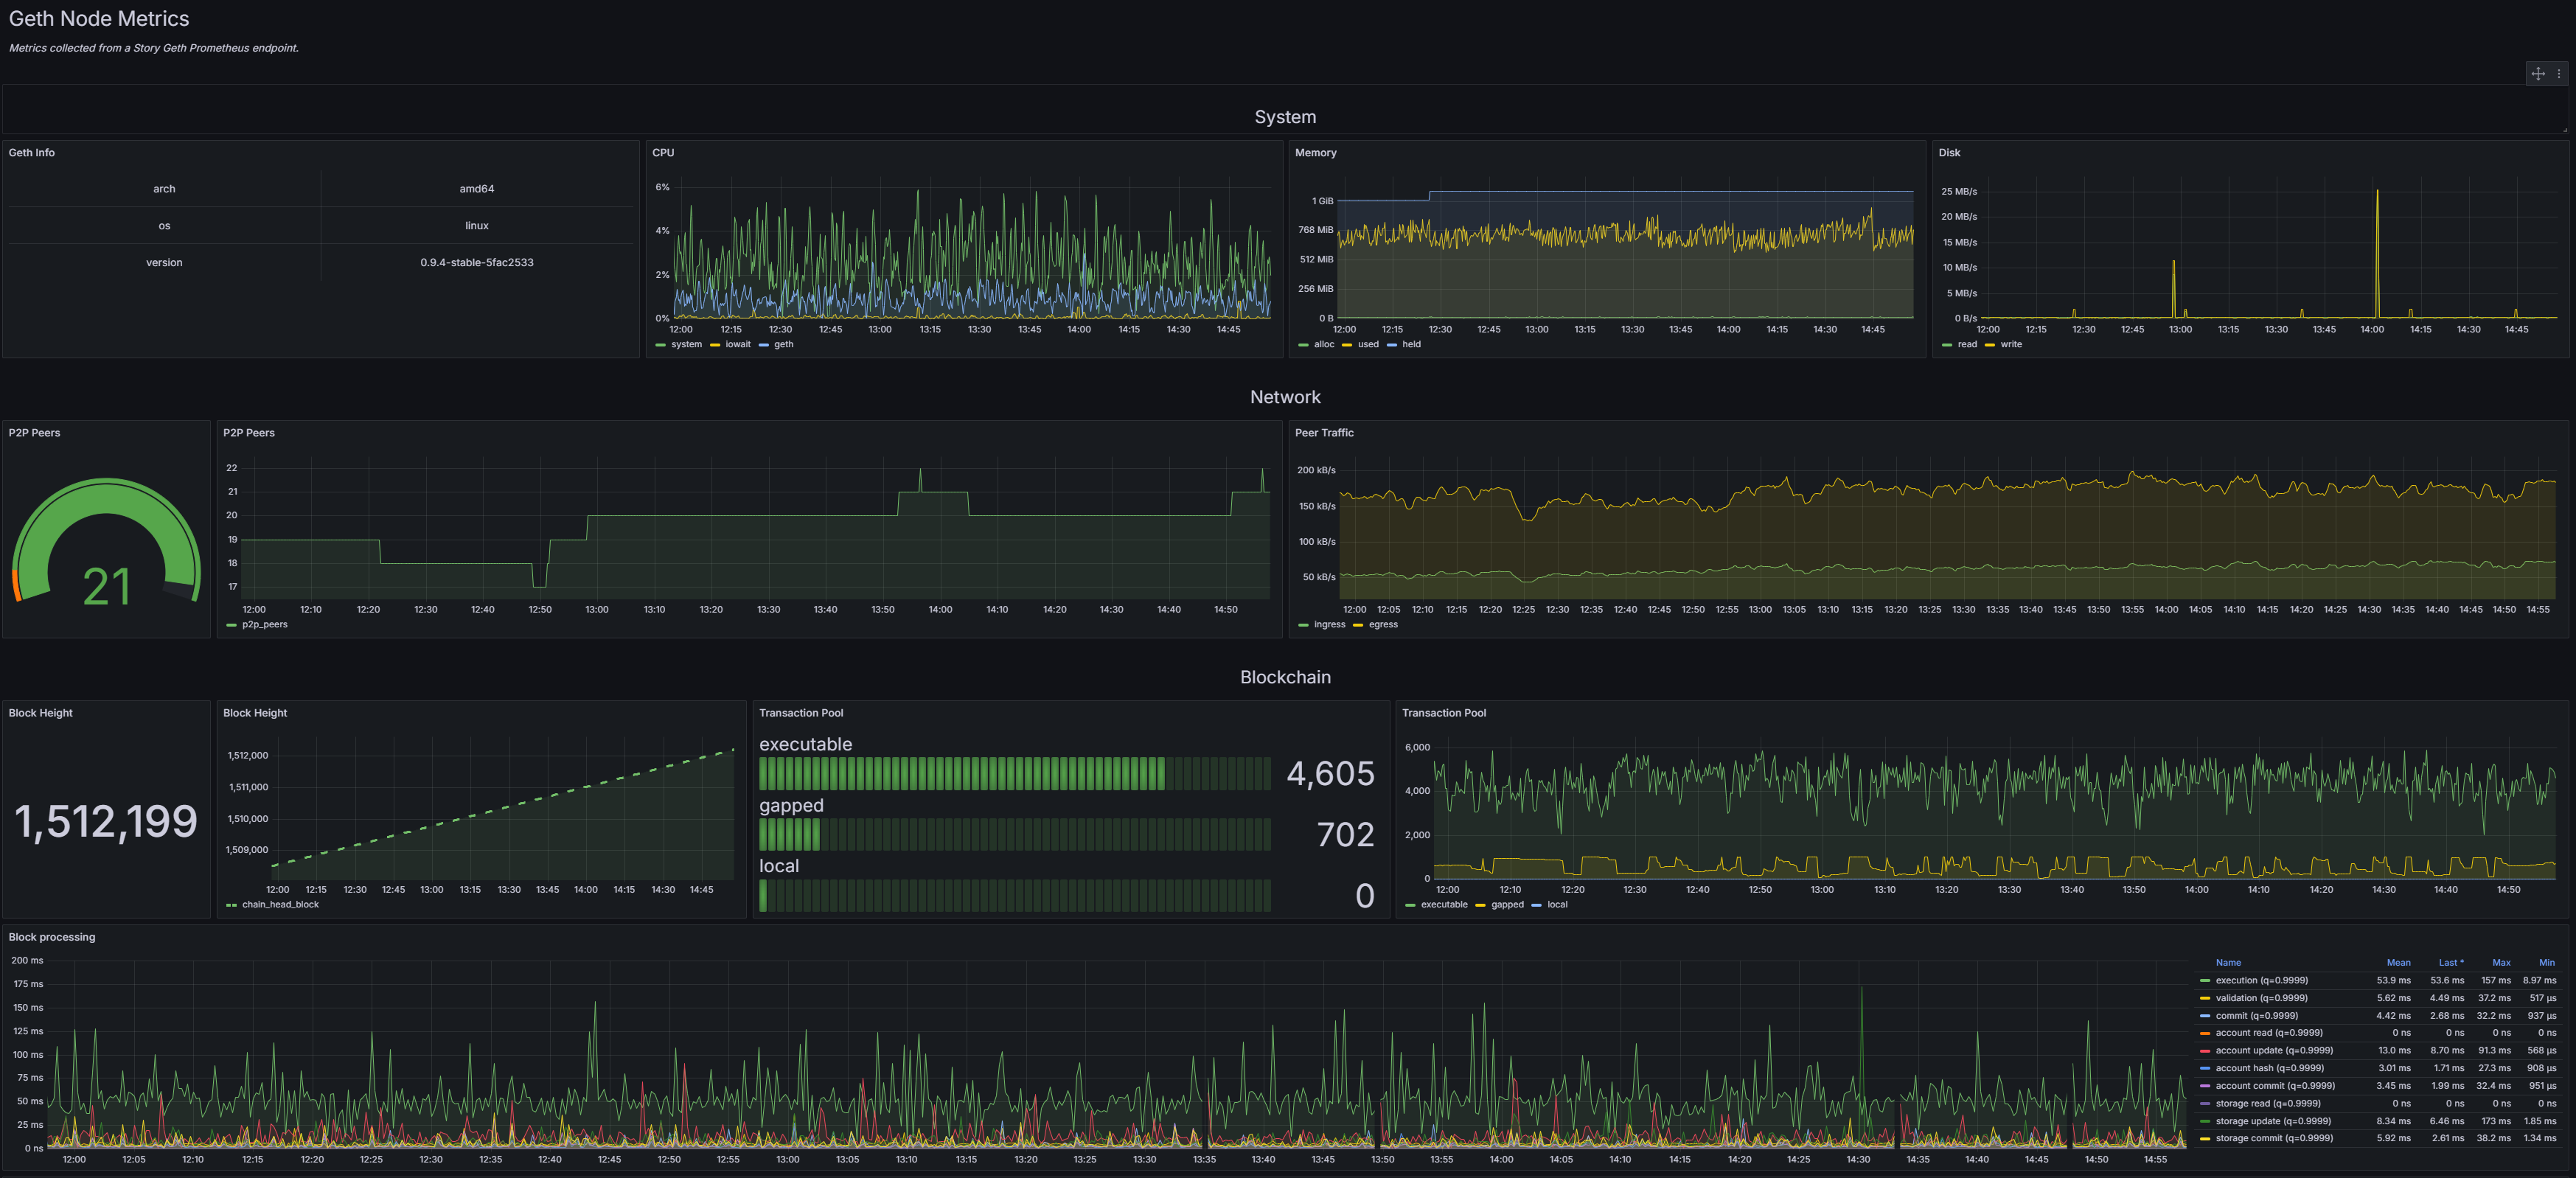
The Stroy Node Dashboard by kjnodes dashboard uses the prometheus data source to create a Grafana dashboard with the bargauge, gauge, stat, table, text and timeseries panels.
Data source config
Collector type:
Collector plugins:
Collector config:
Revisions
Upload an updated version of an exported dashboard.json file from Grafana
| Revision | Description | Created | |
|---|---|---|---|
| Download |
Linux Server
Monitor Linux with Grafana. Easily monitor your Linux deployment with Grafana Cloud's out-of-the-box monitoring solution.
Learn more