VictoriaLogs - single-node
Overview for single-node VictoriaLogs v1.29.0 or higher
VictoriaLogs single-server overview
Requirements
VictoriaLogs: each revision may have different VictoriaLogs version requirements.
Grafana: each revision may have different Grafana version requirements.
Use Prometheus datasource with this dashboard.
To scrape metrics configure VictoriaMetrics, vmagent or Prometheus job to scrape victorialogs-addr/metrics address. More details about monitoring may be found here.
Description
The dashboard contain comprehensive monitoring sections organized by functionality areas:
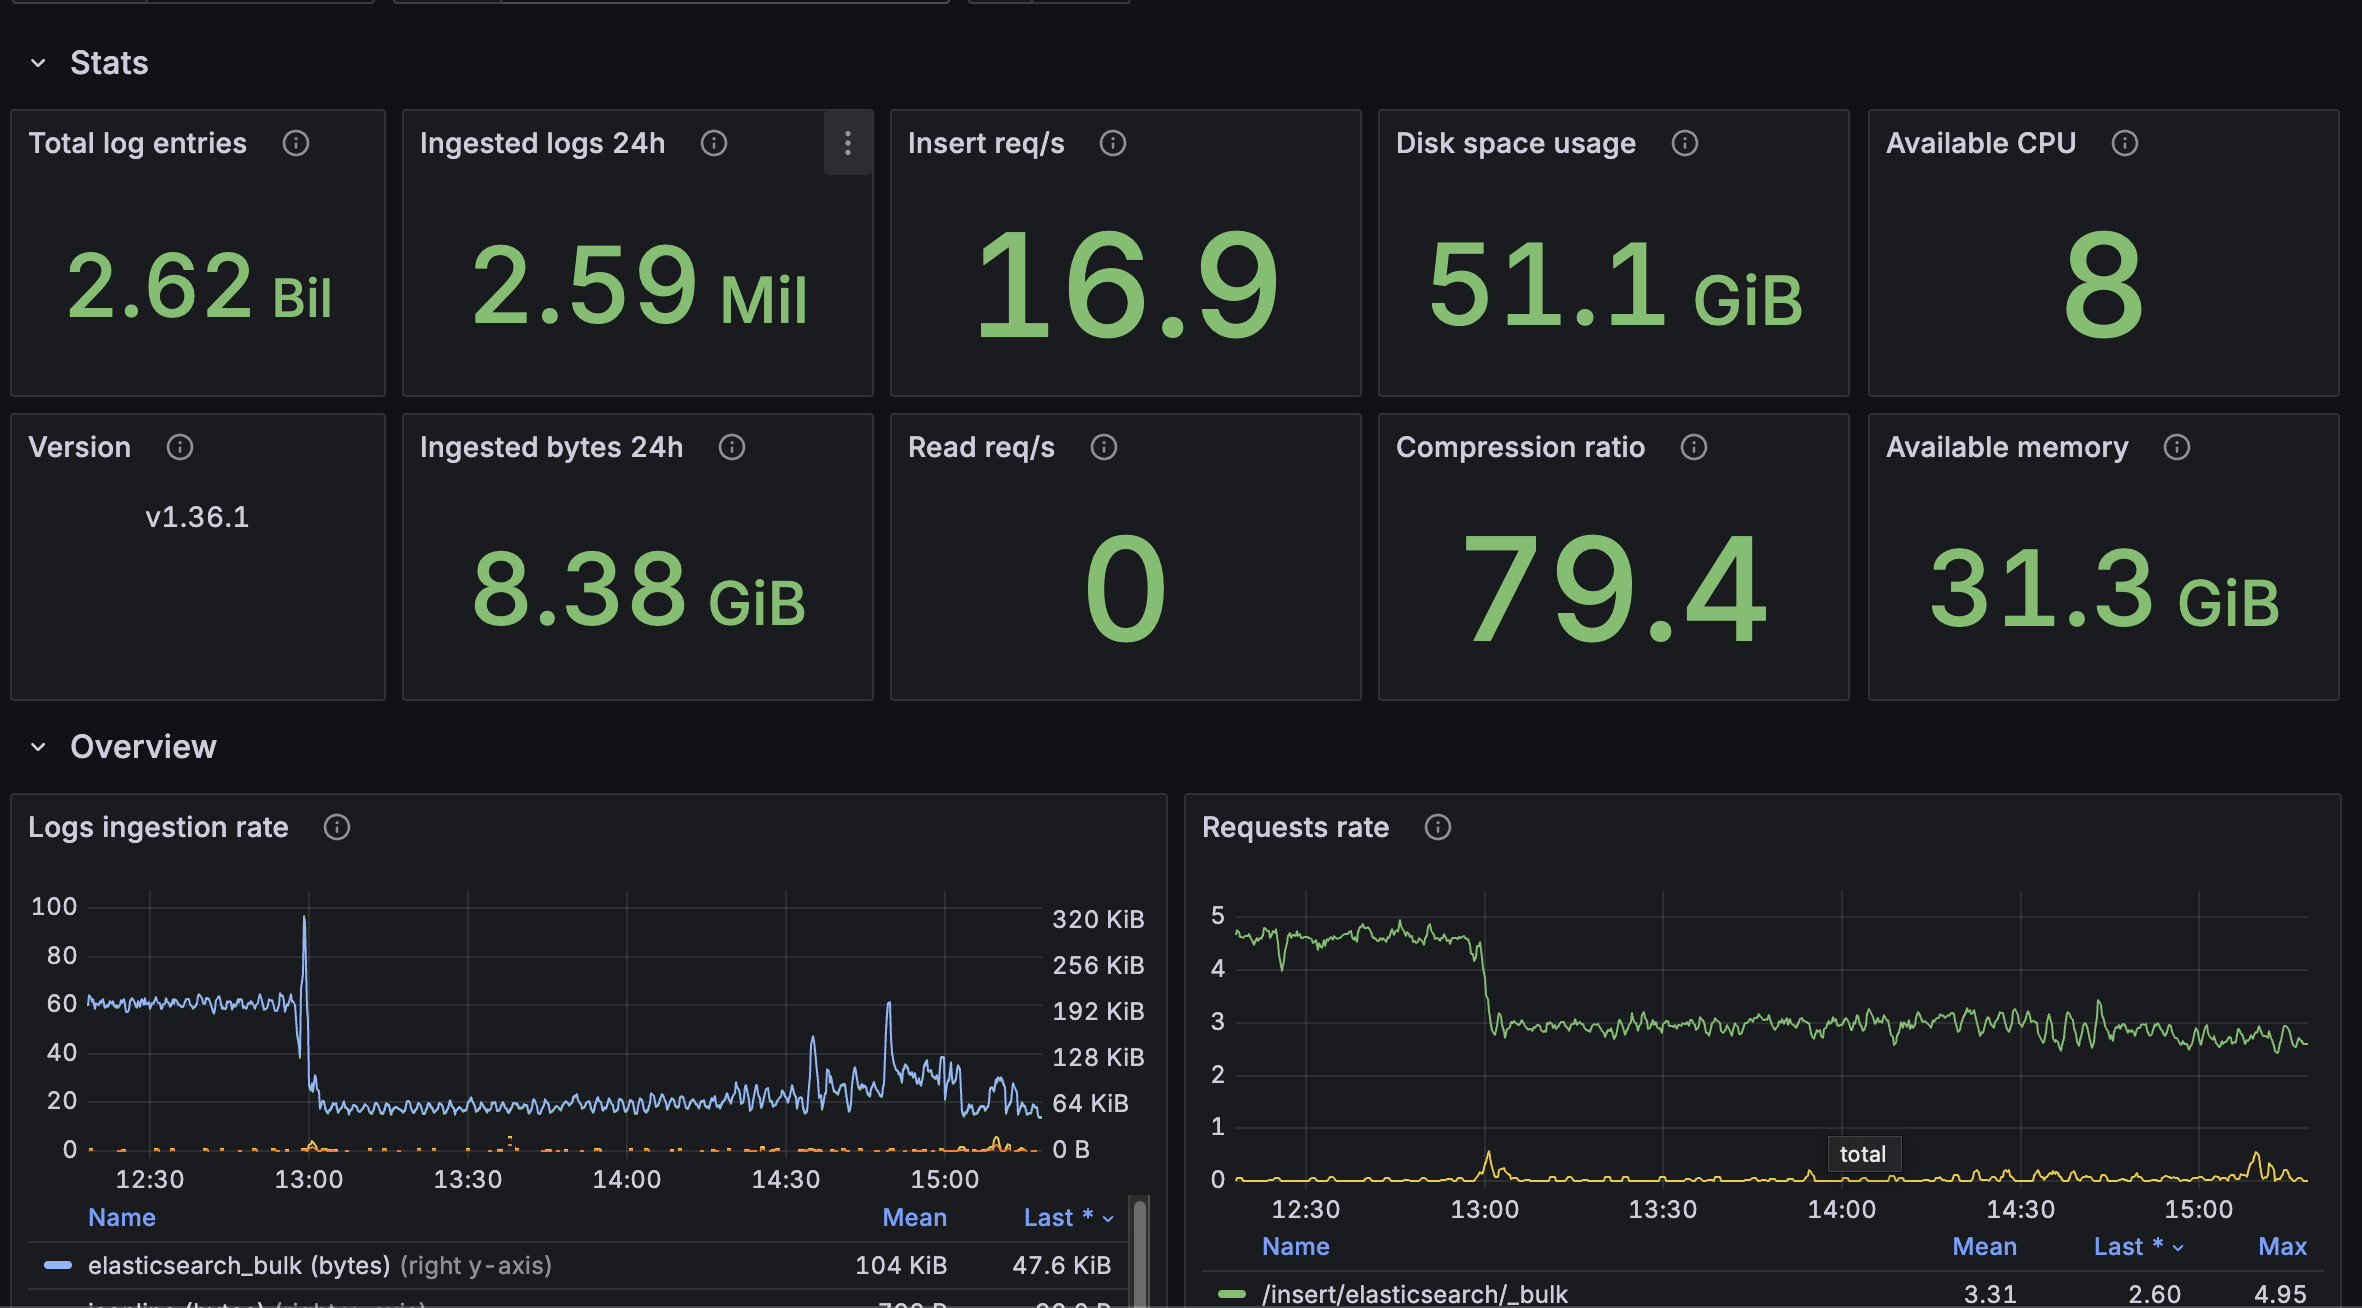
- Stats - High-level metrics including total log entries, ingestion rates, disk usage, and system version information
- Overview - Real-time visualization of log ingestion rates, request patterns, error rates, and performance trends
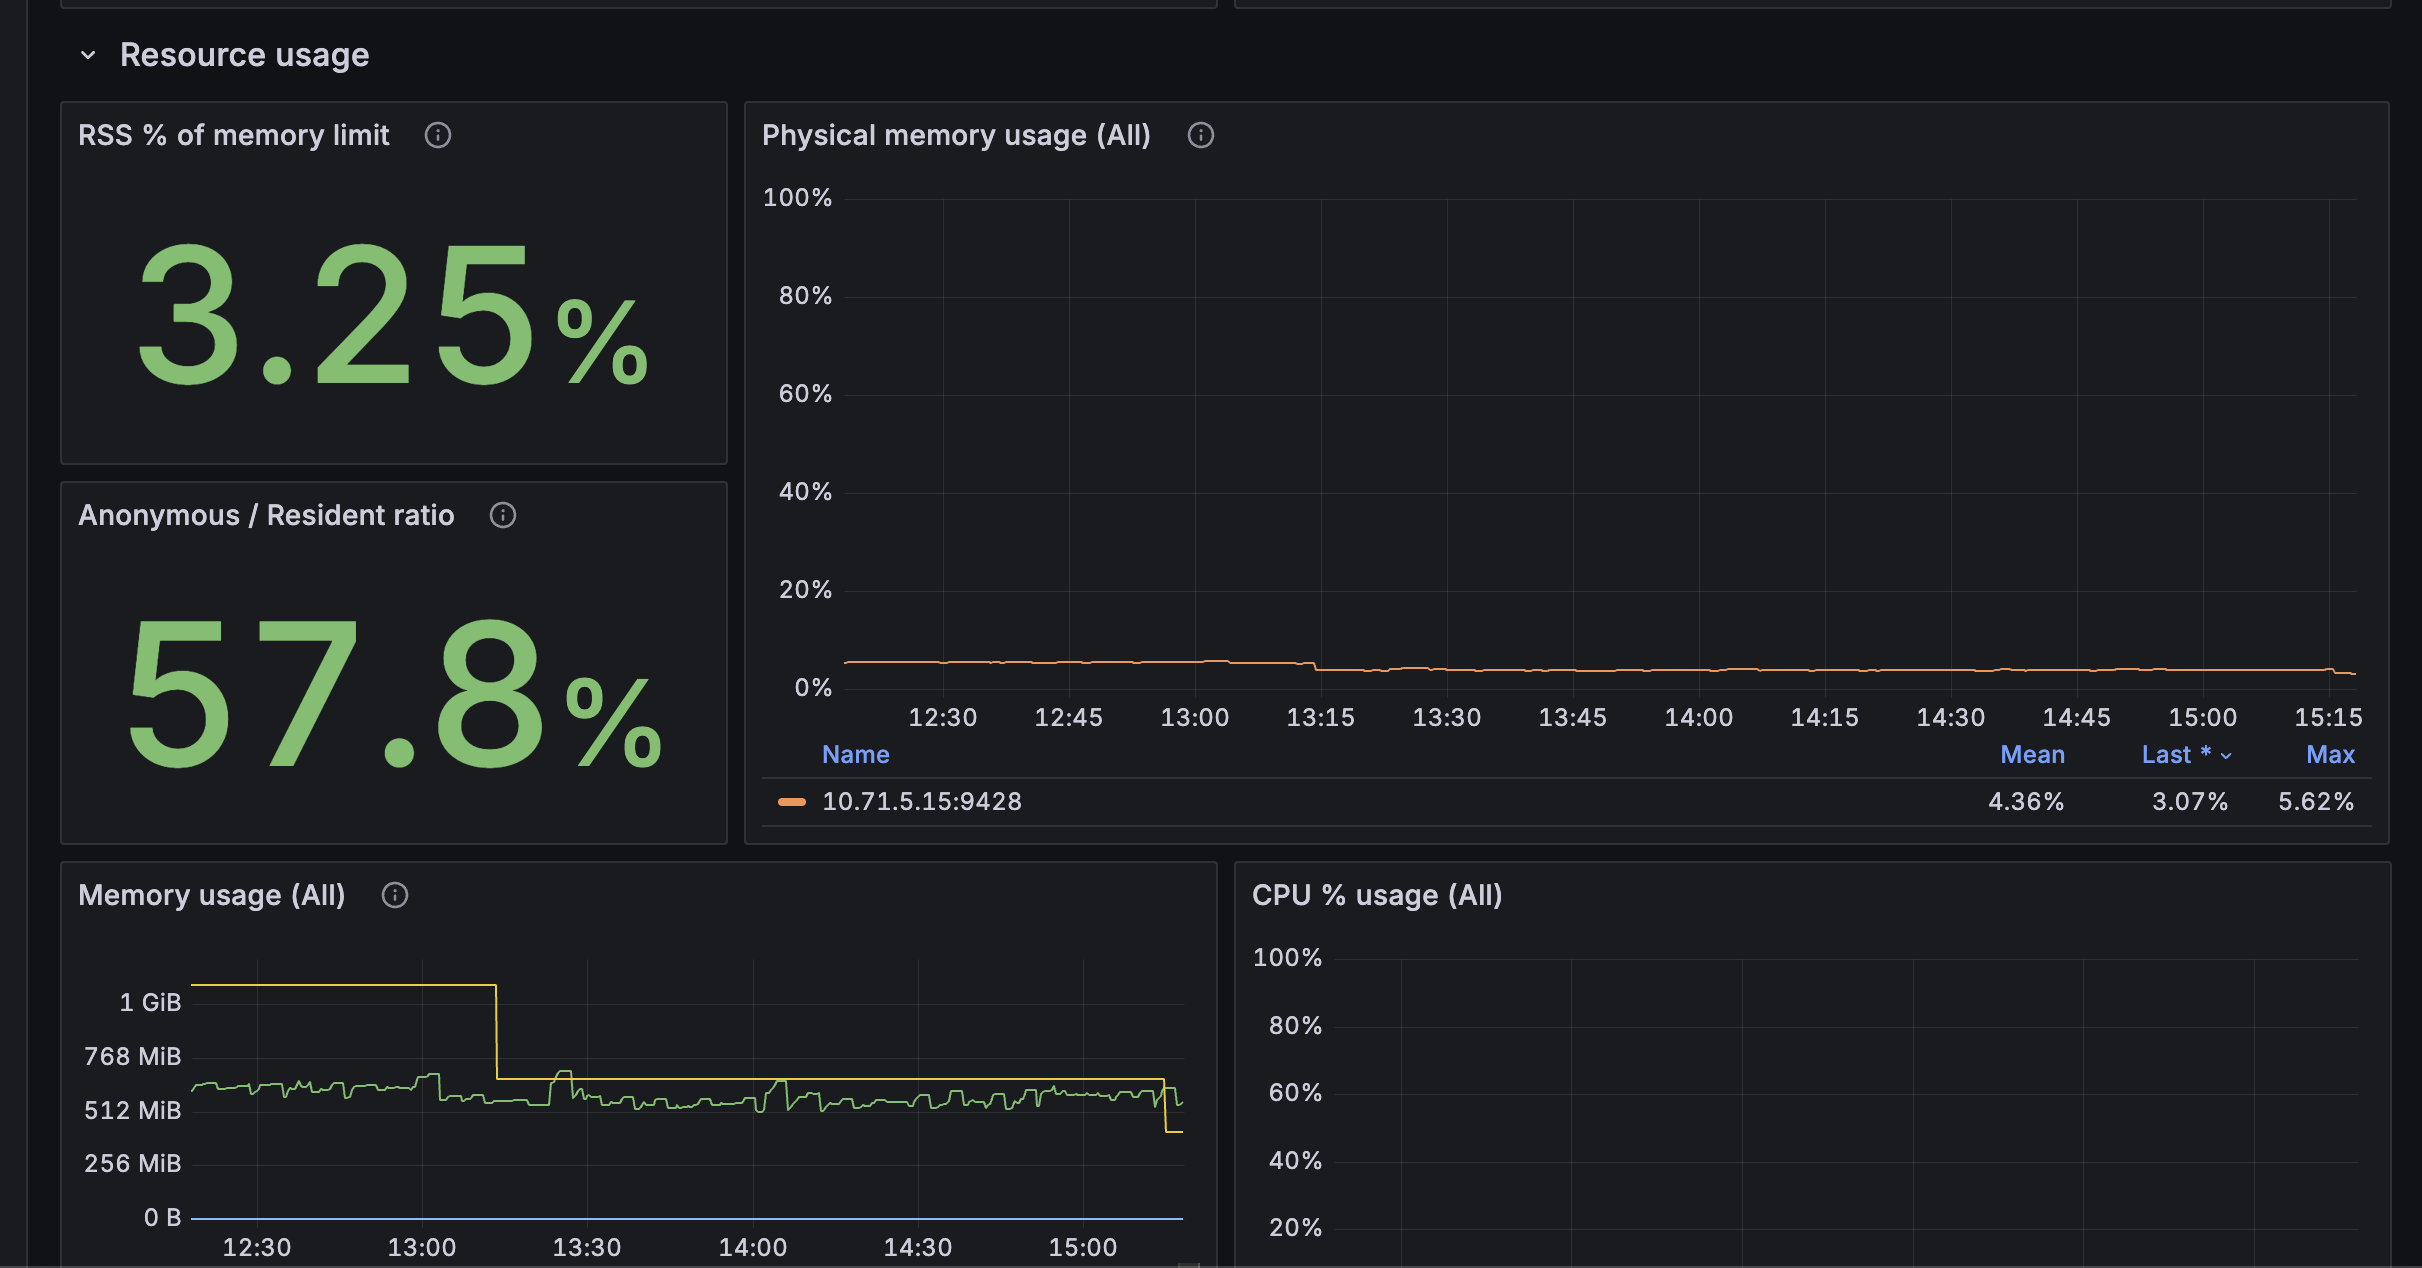
- Resource usage - CPU utilization, memory consumption, network activity, garbage collection metrics, and system pressure indicators
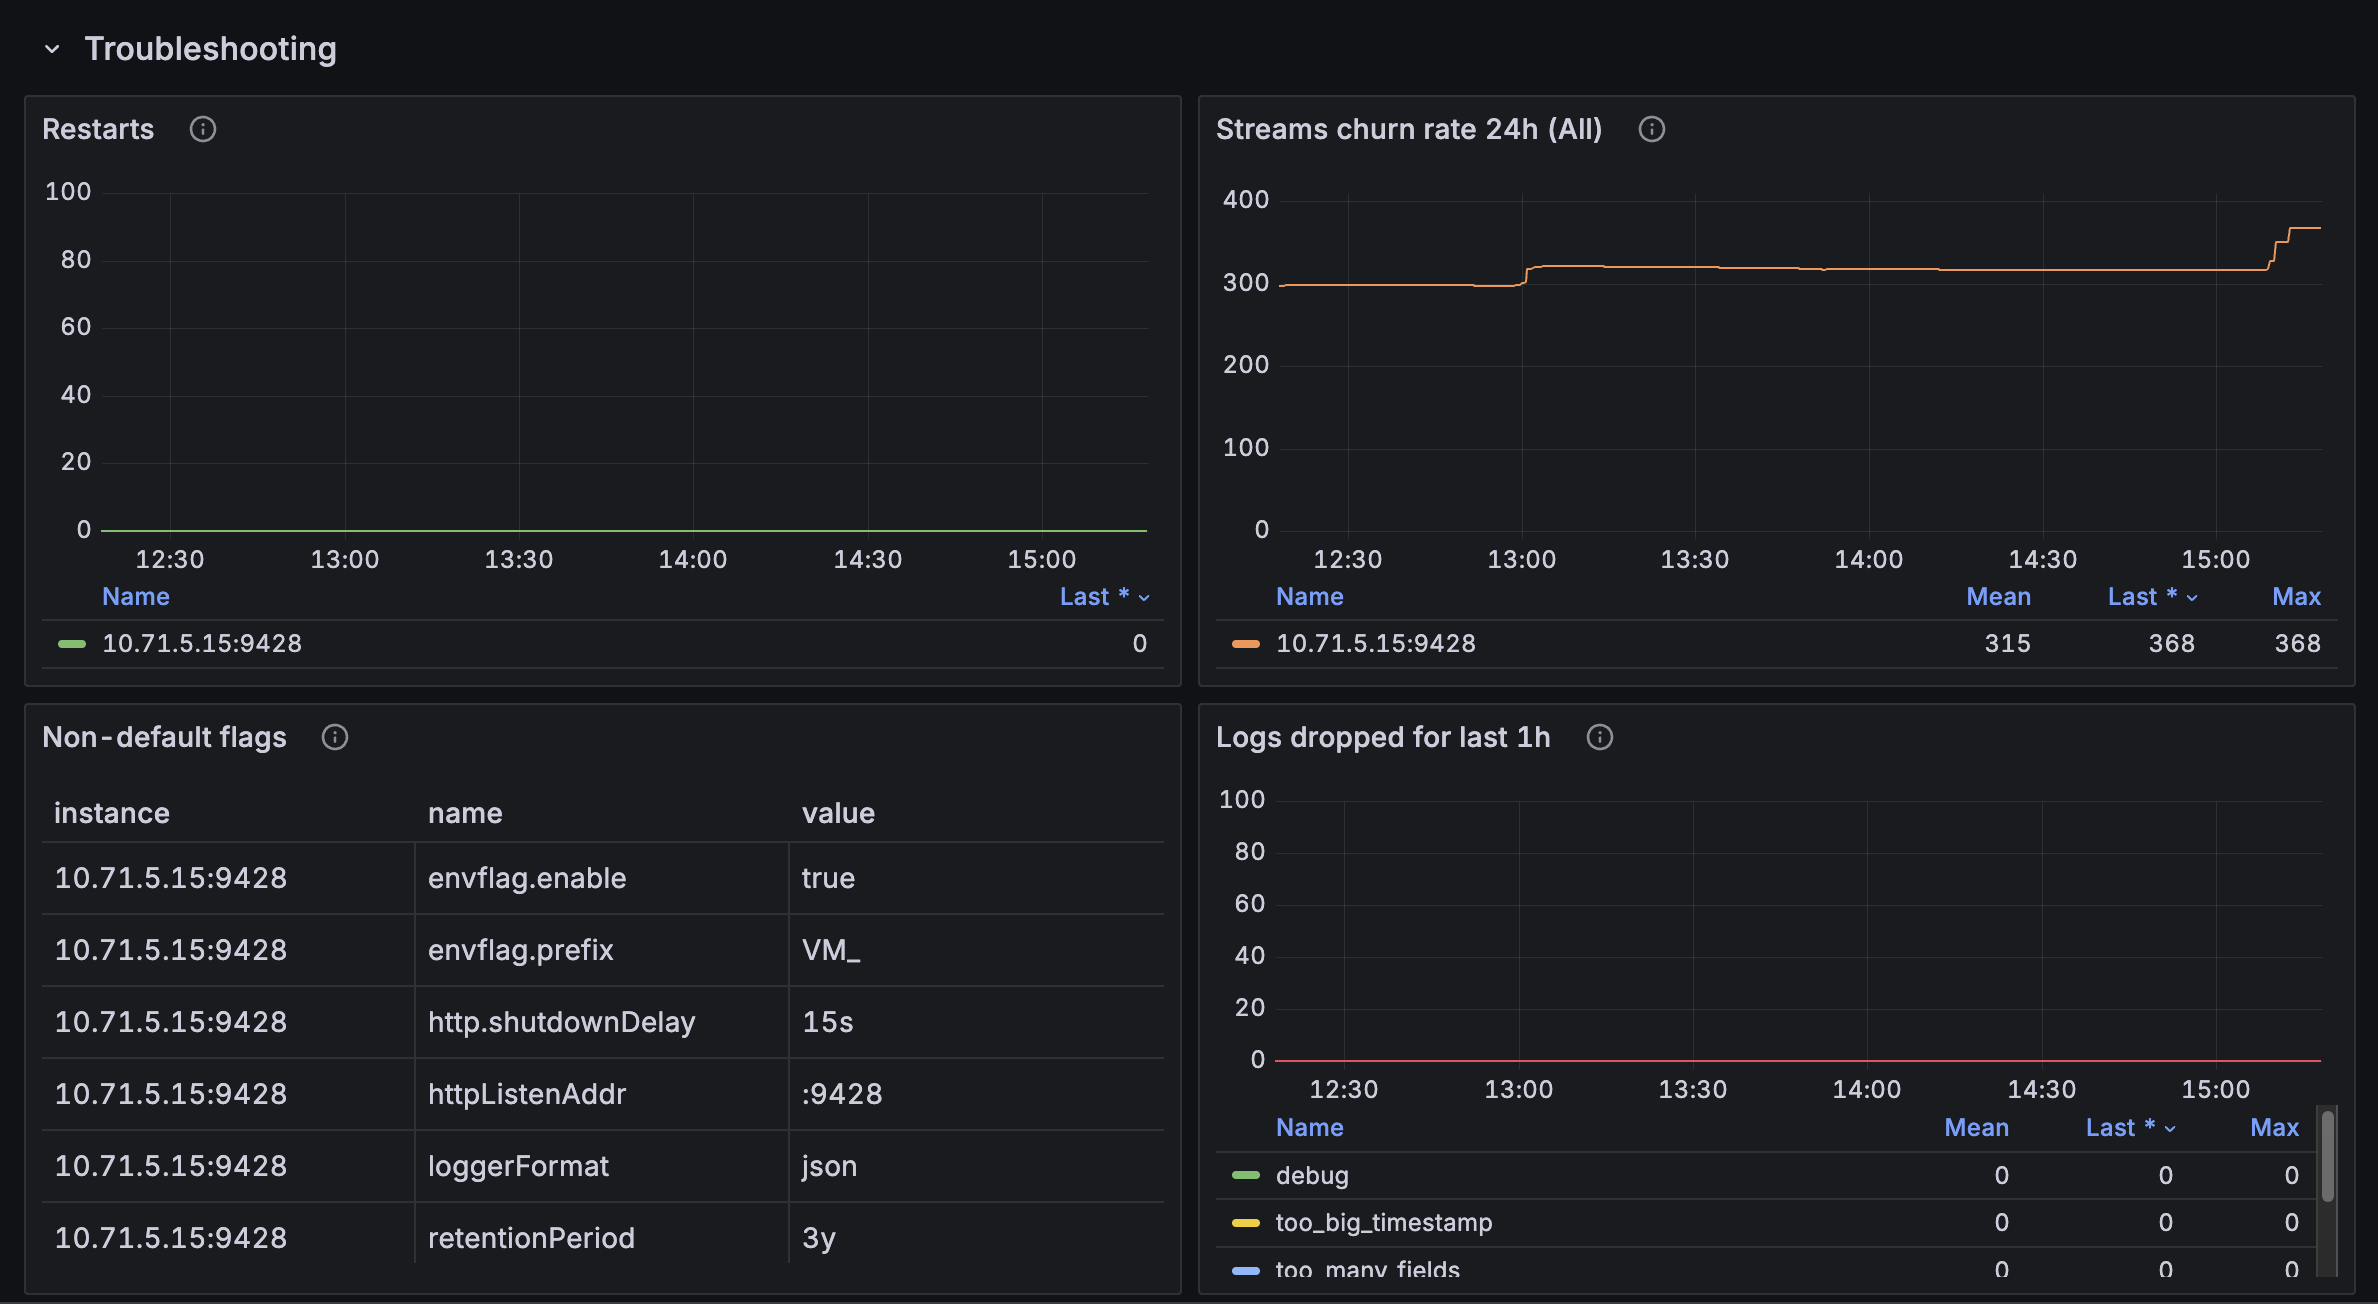
- Troubleshooting - Debugging panels for error tracking, configuration validation, and operational diagnostics
- Slow Query Troubleshooting - Query performance analysis, optimization metrics, and latency diagnostics
Additional specialized sections include:
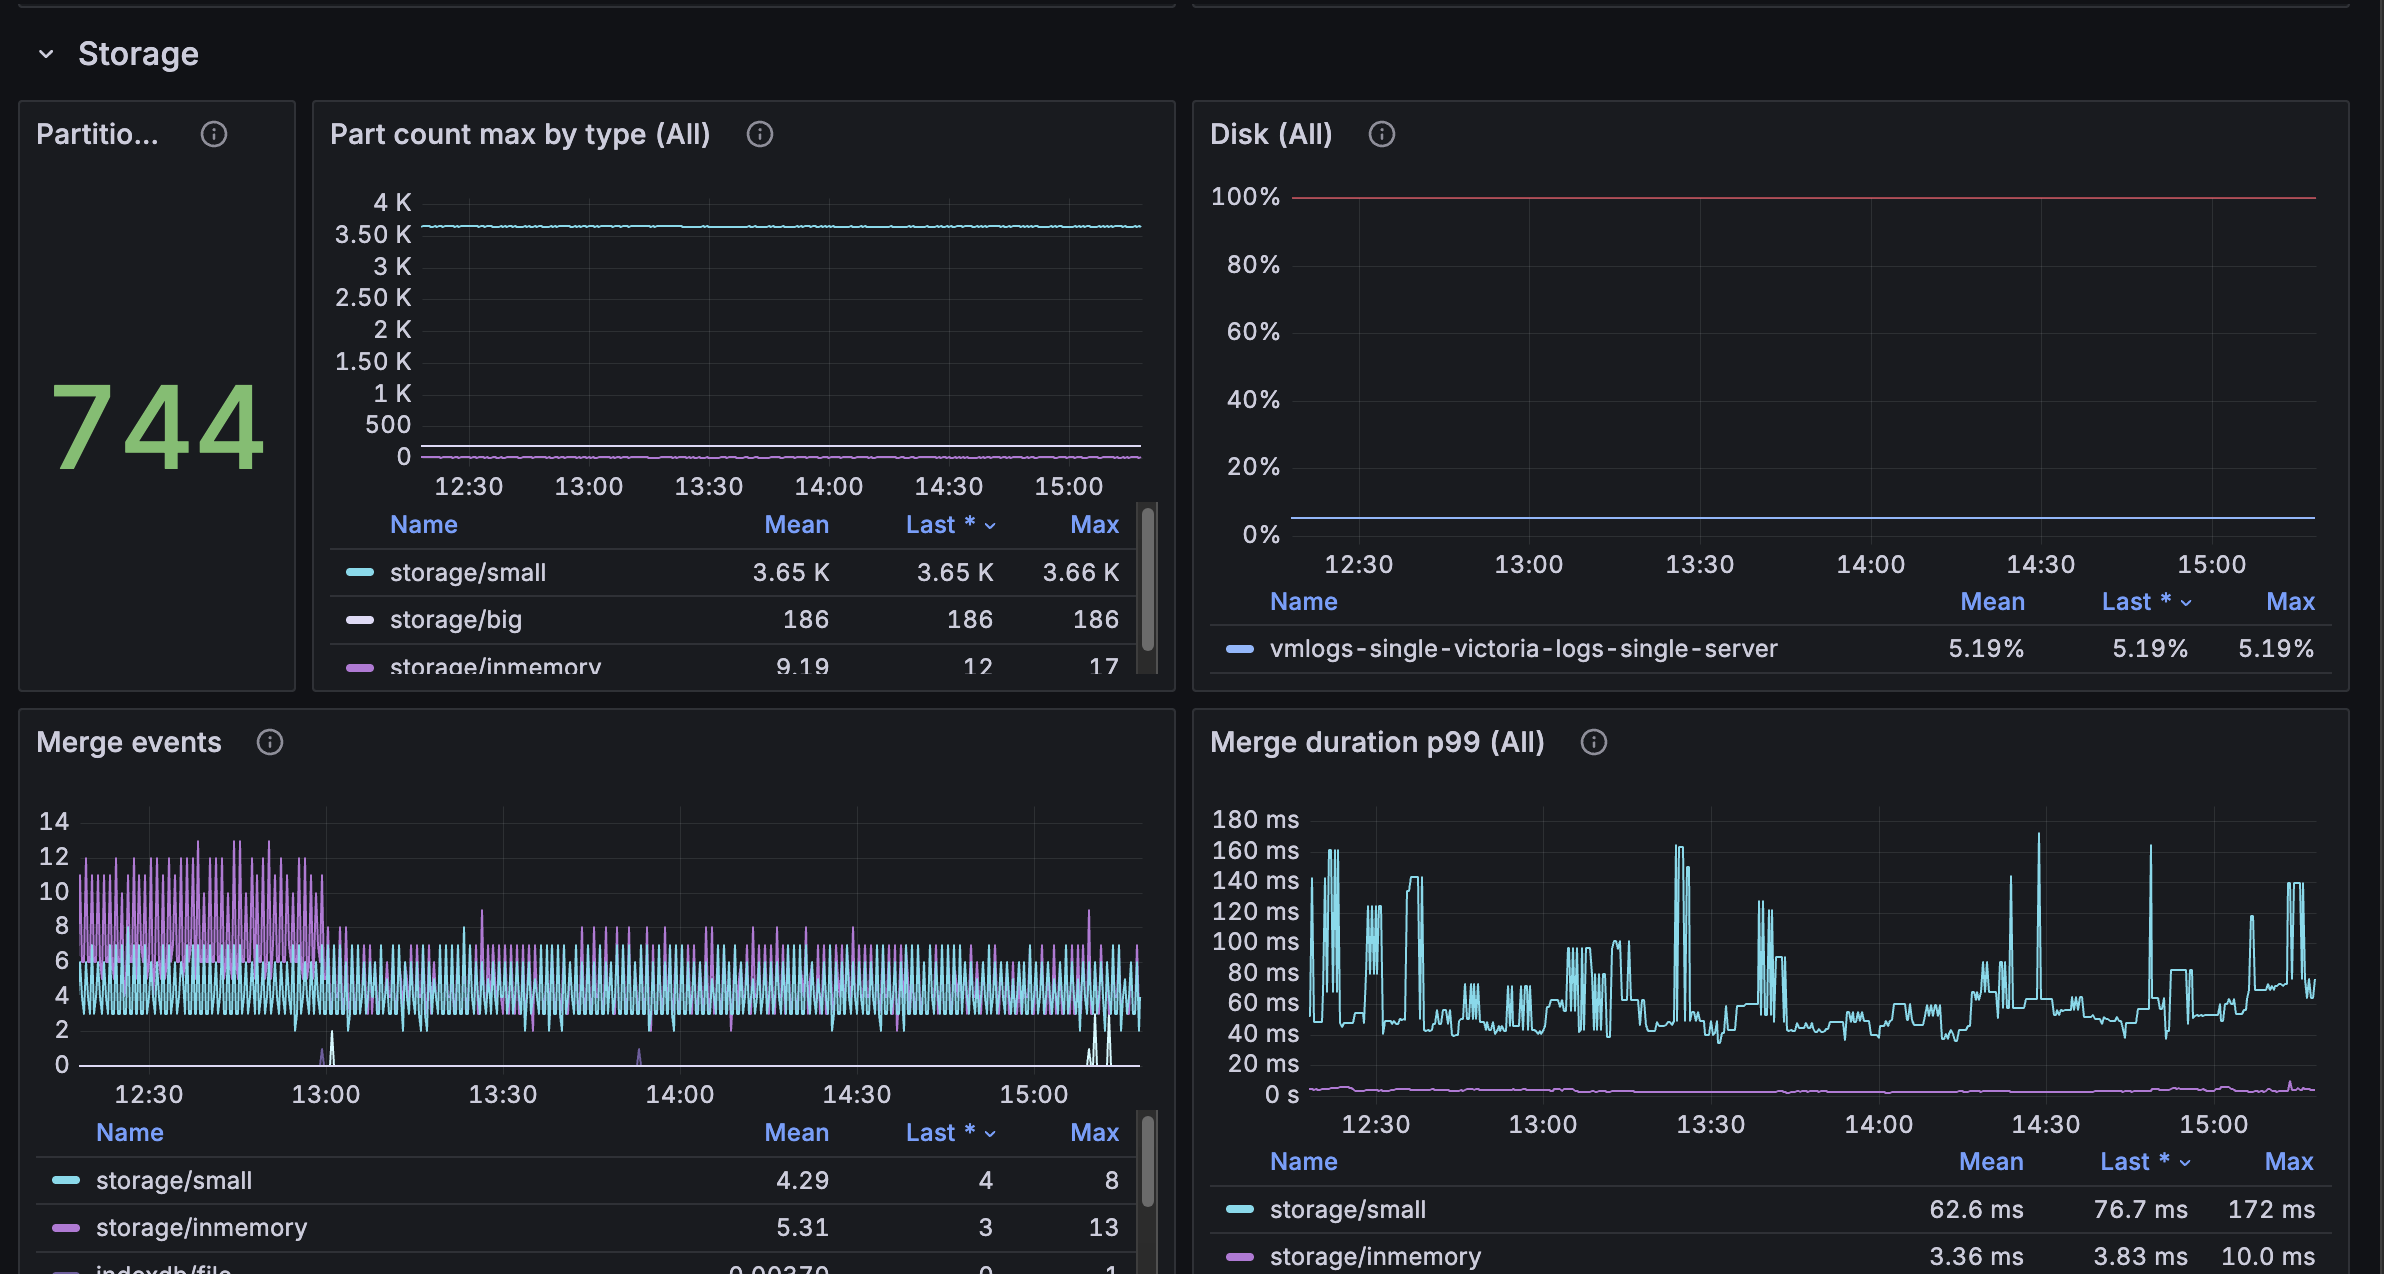
- Storage operations with merge performance and indexing metrics
- Ingestion pipeline monitoring with flush operations and data flow rates
- Querying performance with request latencies and timeout tracking
If you have suggestions for improvements or discover any issues, please feel free to create an issue or submit feedback through the dashboard review system.
More information about VictoriaLogs can be found in the official documentation.
New releases and container images are available at the VictoriaLogs releases page and DockerHub.
Data source config
Collector config:
Upload an updated version of an exported dashboard.json file from Grafana
| Revision | Description | Created | |
|---|---|---|---|
| Download |
Linux Server
Monitor Linux with Grafana. Easily monitor your Linux deployment with Grafana Cloud's out-of-the-box monitoring solution.
Learn more