K8S Dashboard EN
[English version]2024.05.13 update, comprehensive display of kubernetes resources! Including K8S overall resource overview, microservice resource details, Pod resource details and K8S network bandwidth, optimized display of important indicators. Converted to English from 13105 https://mevi.tech
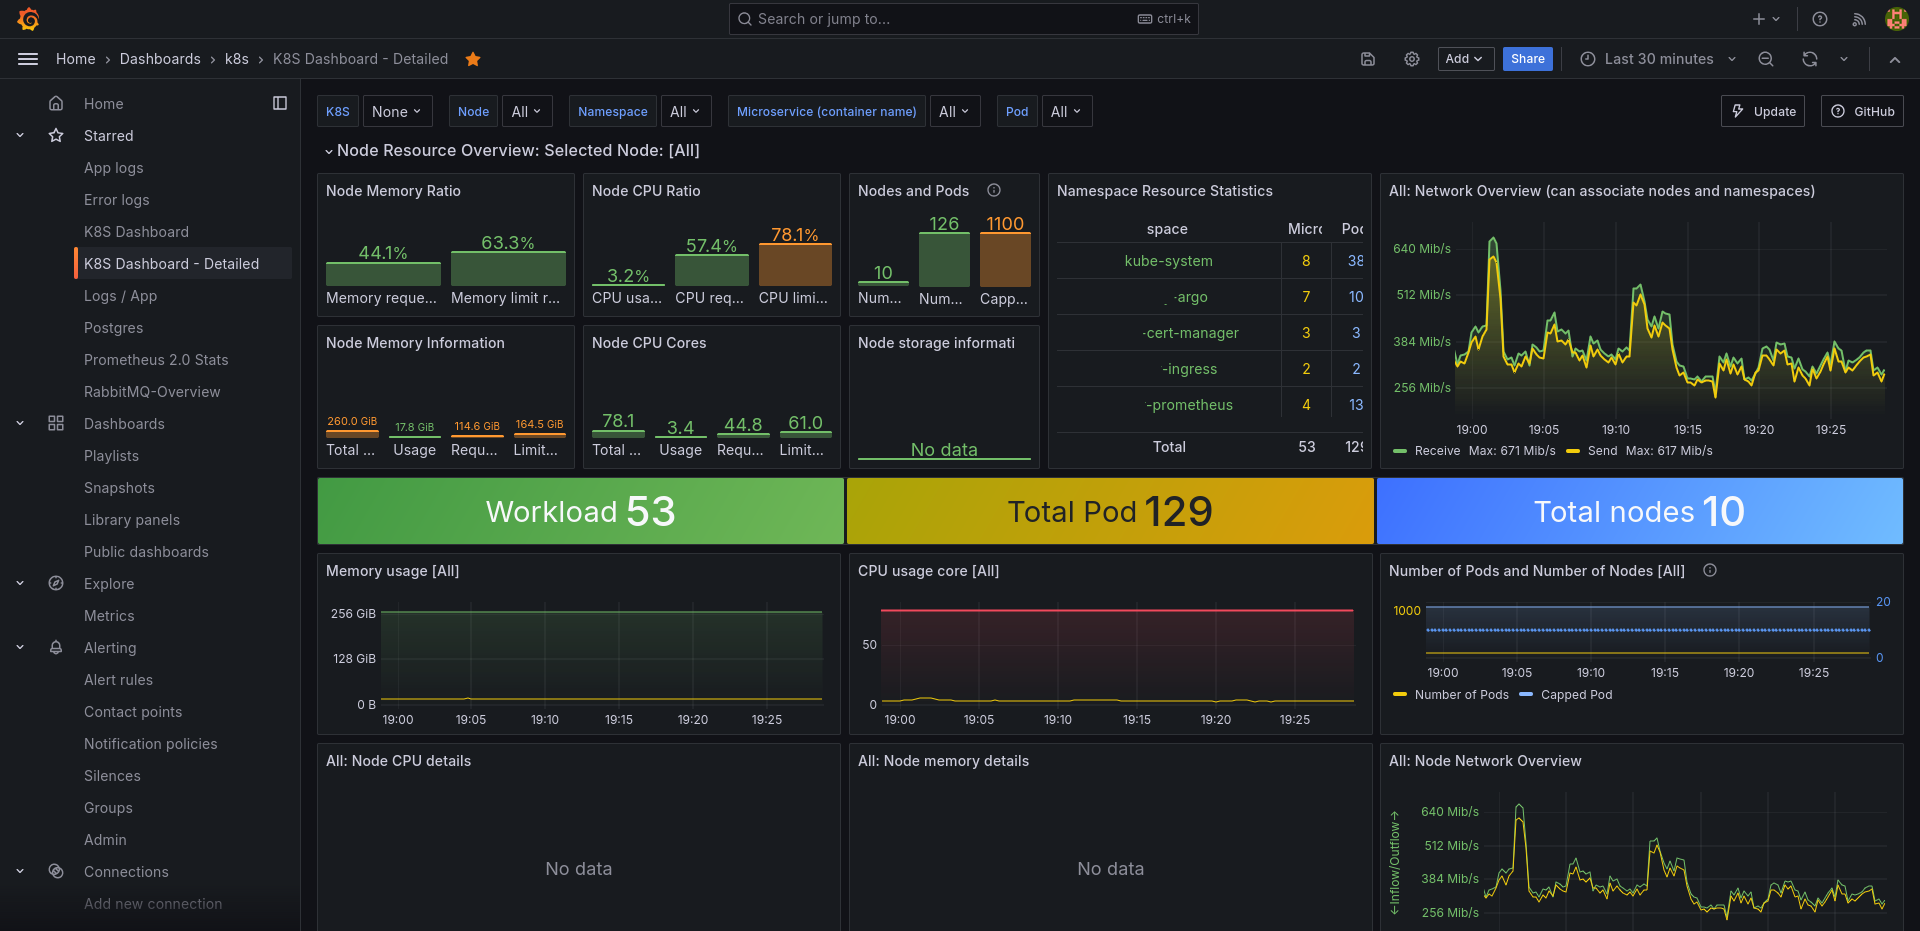
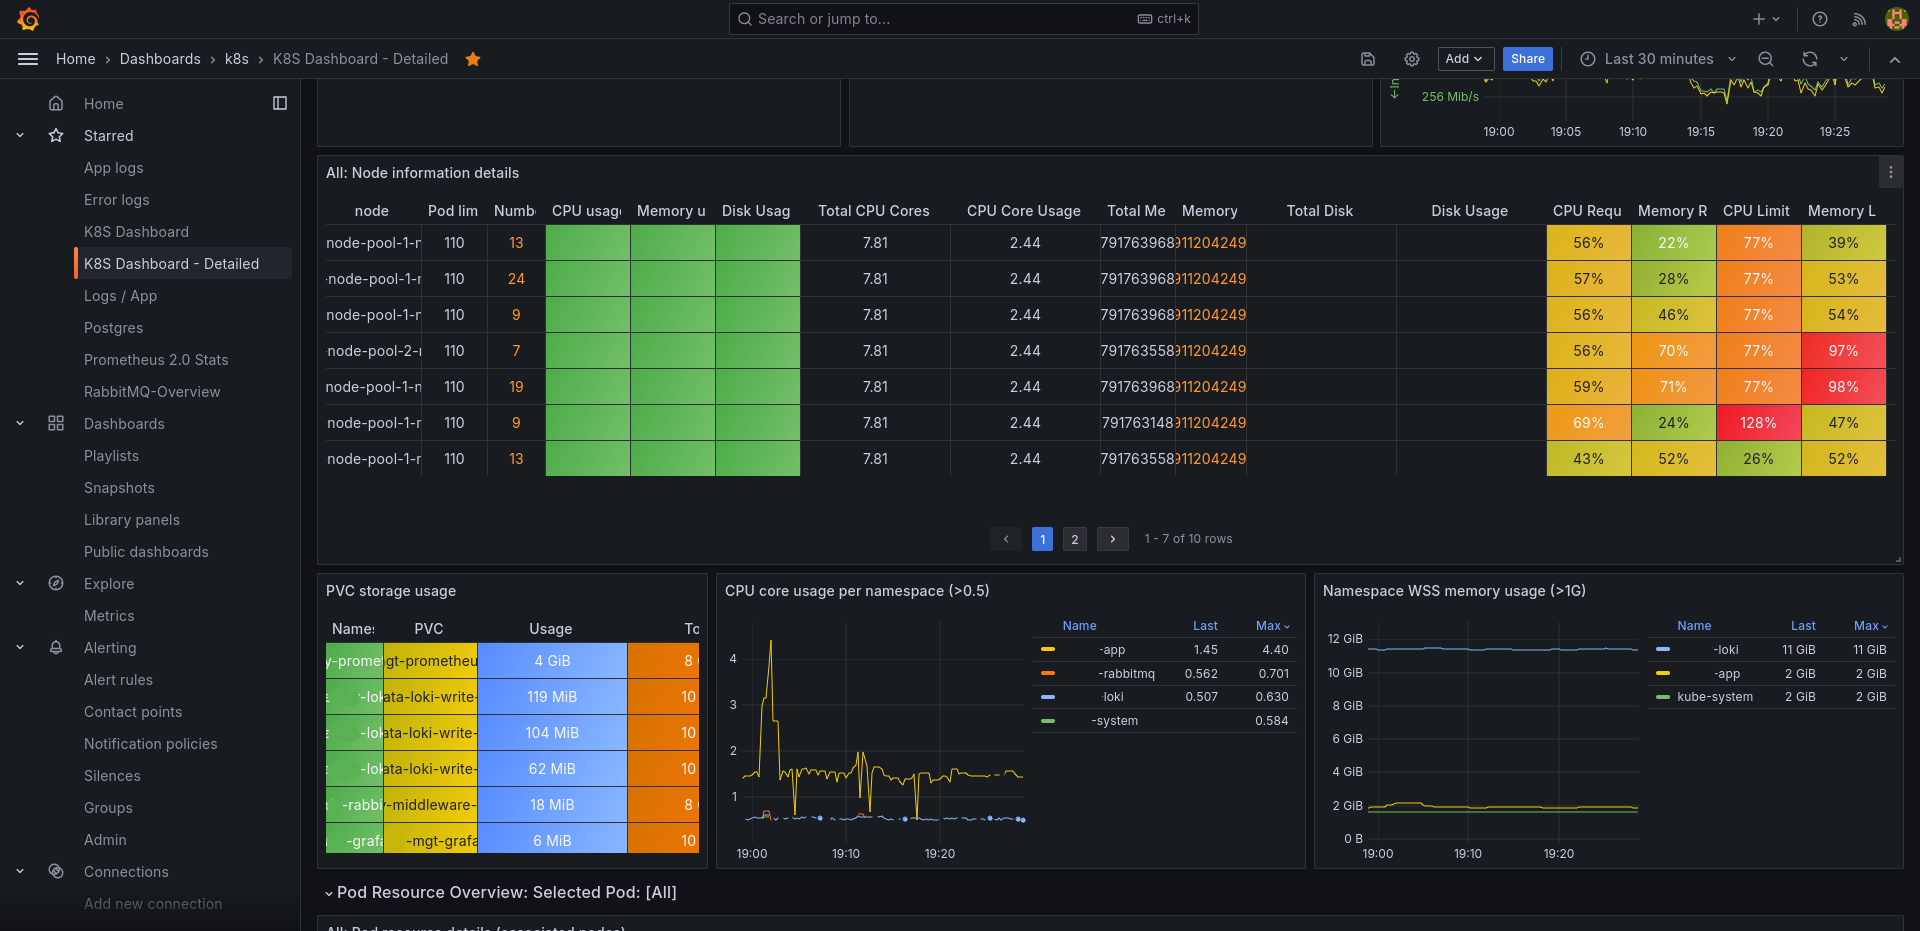
The K8S Dashboard EN dashboard uses the prometheus data source to create a Grafana dashboard with the bargauge, stat, table and timeseries panels.
Data source config
Collector type:
Collector plugins:
Collector config:
Revisions
Upload an updated version of an exported dashboard.json file from Grafana
| Revision | Description | Created | |
|---|---|---|---|
| Download |
Kubernetes
Monitor your Kubernetes deployment with prebuilt visualizations that allow you to drill down from a high-level cluster overview to pod-specific details in minutes.
Learn more