Internal Grafana Stats
Data Proxy request timings (percentiles), dashboard loads, logins etc, Prometheus version.
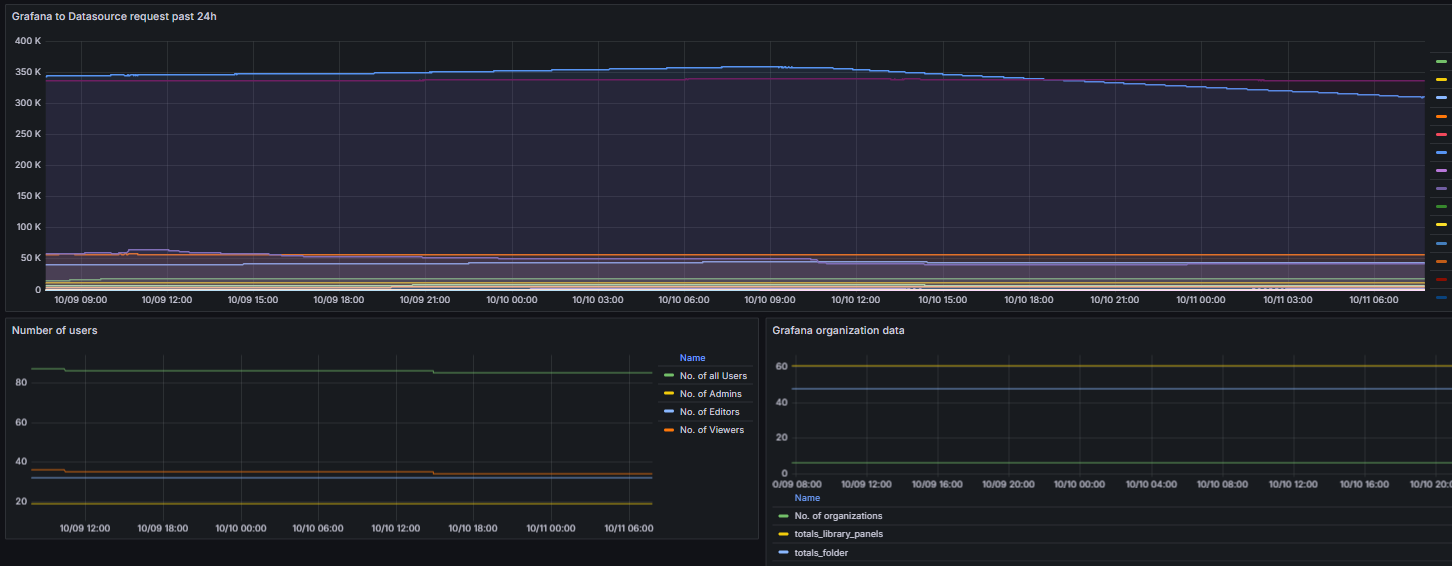
The Internal Grafana Stats dashboard uses the prometheus data source to create a Grafana dashboard with the stat and timeseries panels.
Data source config
Collector type:
Collector plugins:
Collector config:
Revisions
Upload an updated version of an exported dashboard.json file from Grafana
| Revision | Description | Created | |
|---|---|---|---|
| Download |