Hardware Main (MetricsHub)
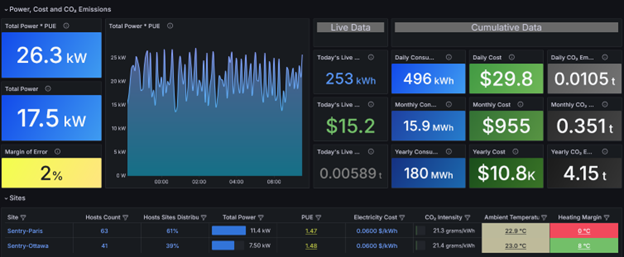
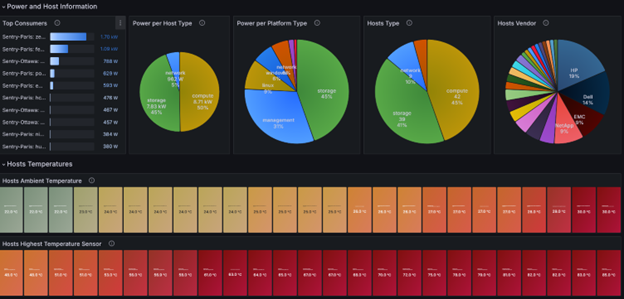
Collect hardware health and performance metrics as well as sustainability KPIs with MetricsHub®; visualize the gathered telemetry data in the comprehensive Hardware Main (MetricsHub), Hardware Site (MetricsHub), and Hardware Host (MetricsHub) dashboards. MetricsHubs collects metrics from servers (Cisco, Dell, HPE, Huawei, IBM Lenovo, SuperMicro, etc.), storage systems (NetApp, Dell EMC, Hitachi, HPE, IBM, Pure, Huawei, etc.), network devices (Cisco, Aruba, Dell, HP, F5, Juniper, Oracle) and other equipment like PDUs, UPS from APC, Raritan, Eaton, etc.
What is MetricsHub?
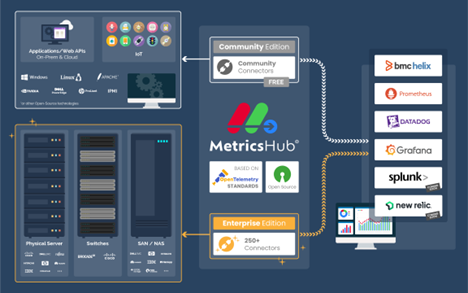
MetricsHub is a universal metrics collection agent for OpenTelemetry which extracts metrics from any local or remote resource - such as a host, service, or application - and sends the data to any observability back-end supporting OpenTelemetry.
MetricsHub is available in two editions: the Community Edition and the Enterprise Edition. The Community Edition provides basic infrastructure monitoring, while the Enterprise Edition offers support for over 100 platforms and includes an OpenTelemetry Collector, simplifying integration with various observability platforms.
Choose the edition that best fits your needs. A free 30-day trial of the Enterprise Edition is available to explore its full capabilities. For more information, visit our website.
How to visualize hardware and sustainability metrics in Grafana?
- Install and configure MetricsHub®
- Configure the sustainability metrics
- Send telemetry to Prometheus
- Import the three Hardware Monitoring dashboards into Grafana:
Why use MetricsHub and its Grafana dashboards?
MetricsHub:
- collects hardware monitoring metrics and supports over 100 platforms from the oldest to the more recent ones: Cisco, Dell EMC, IBM, Hitachi, HP, NetApp, Pure, etc. See full list.
- is a 100% software solution for energy usage monitoring (No PDUs required)
- includes three built-in dashboards, eliminating the need for you to create your own.
Key Features
- Hardware Monitoring: Detect and even predict failures in processors, memory modules, disks, network cards, controllers, power supplies, fans, temperature sensors, etc.
- Energy Usage: Assess the power consumption of all monitored systems, even those which are not equipped with power sensors.
- Carbon Emissions: Accurately determine the carbon emissions of your data centers using real-time energy usage data and observe their evolution over time to track progress toward your sustainability goals.
- Data center temperature optimization: Accurately determine the maximum acceptable temperature of your server rooms and estimate the amount saved when this recommendation is followed.
Data source config
Collector config:
Upload an updated version of an exported dashboard.json file from Grafana
| Revision | Description | Created | |
|---|---|---|---|
| Download |


