Celestia Dashboard
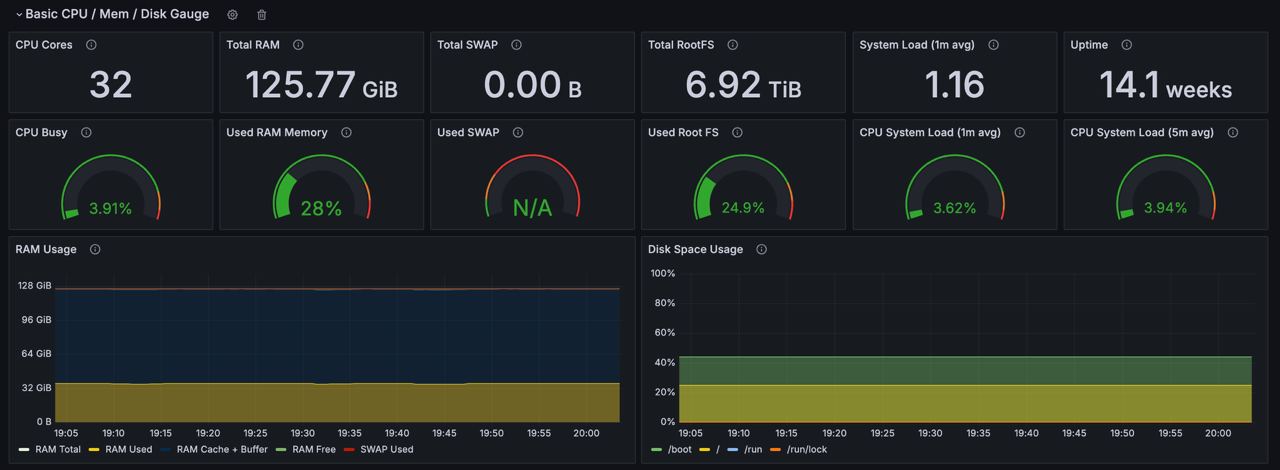
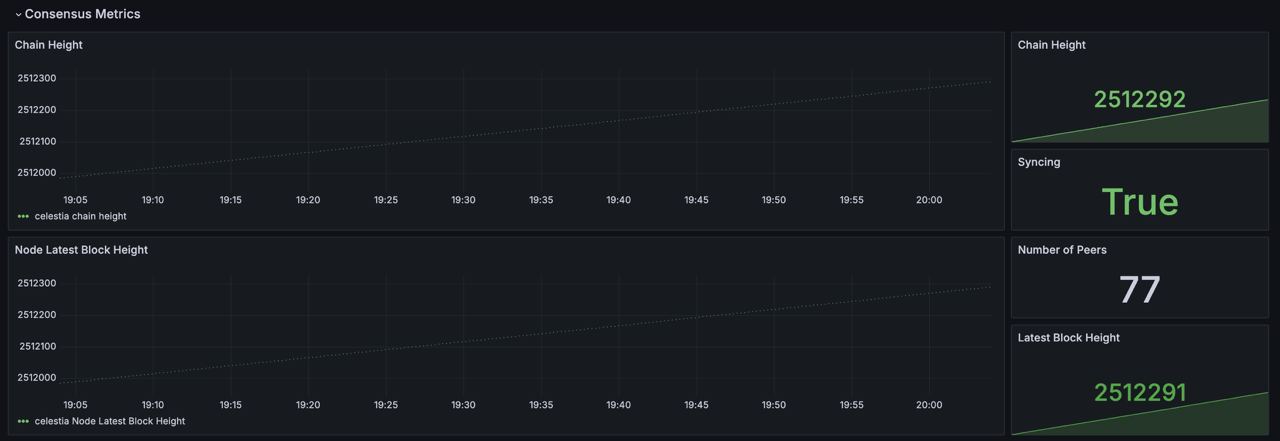
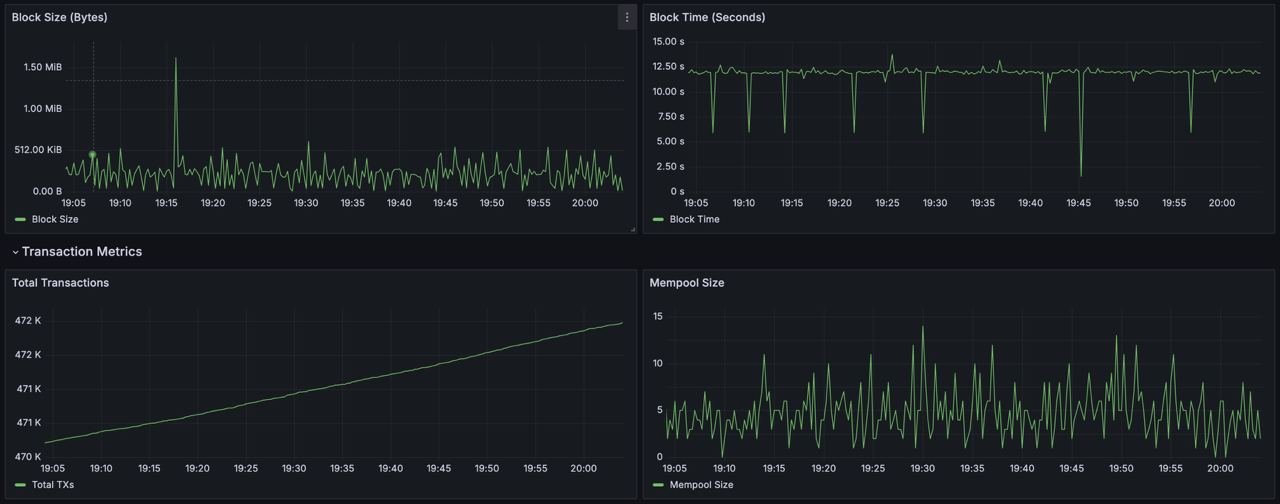
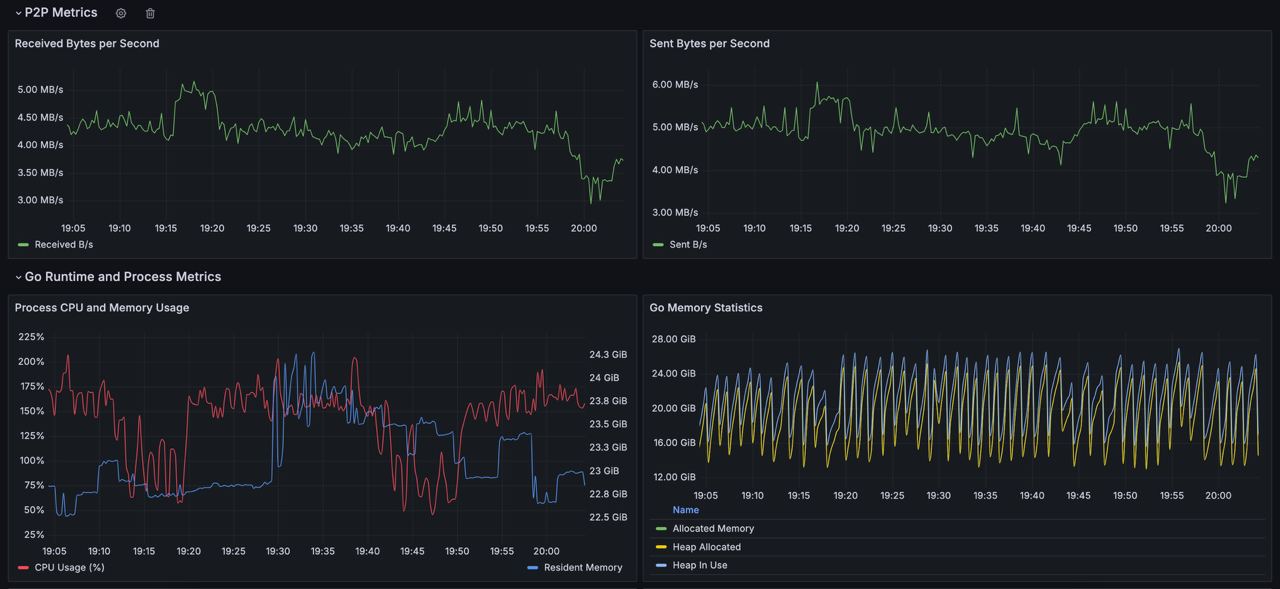
Dashboard for monitoring a Celestia node and key hardware performance metrics
This Dashboard uses Prometheus Data Source (Node) and Node Exporter to create a Grafana dashboard with the gauge, graph and singlestat.
To set it up, you could check our guide in GitHub
Powered by UTSA and Lets Node
Data source config
Collector type:
Collector plugins:
Collector config:
Revisions
Upload an updated version of an exported dashboard.json file from Grafana
| Revision | Description | Created | |
|---|---|---|---|
| Download |


