Wifi Scan
The **WiFiScan Collector** is a Python-based tool that scans available Wi-Fi networks using the `iw` tool, parses the scan results, and sends structured data to an InfluxDB database for storage and analysis. This tool provides insights into nearby wireless networks, including signal strength, frequency band, channel, and other essential Wi-Fi parameters.
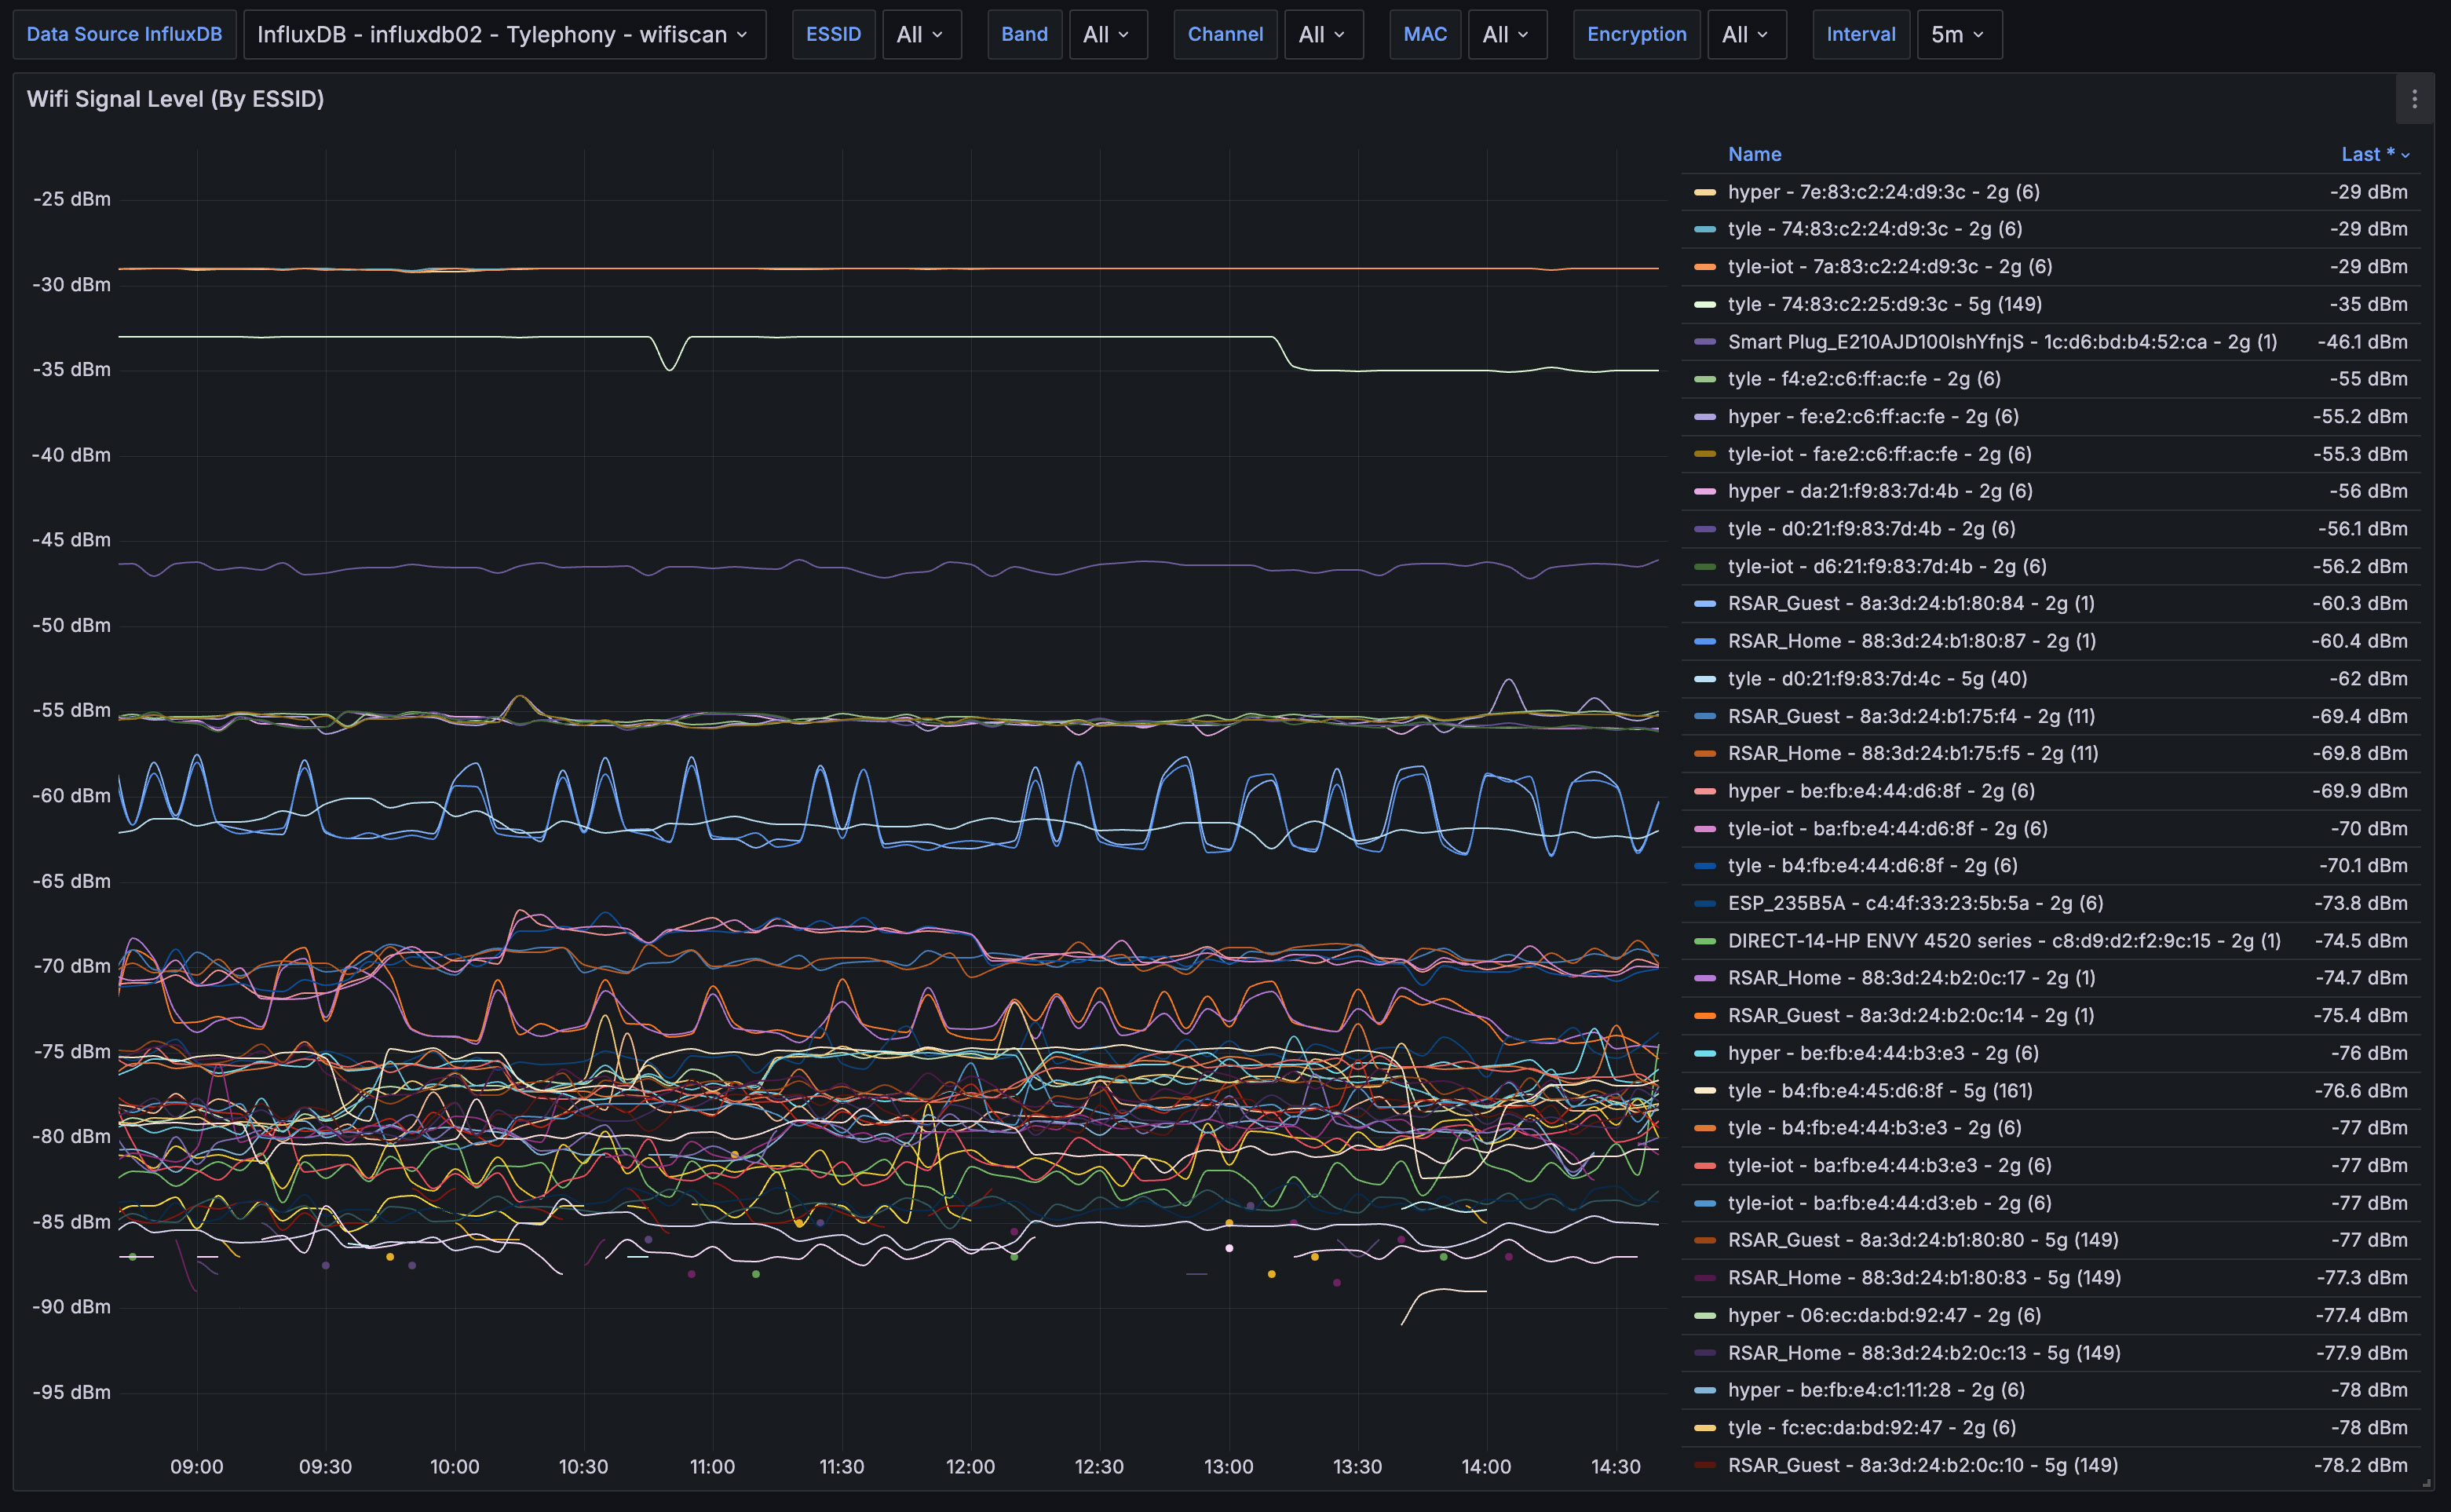
This WiFi Signal Collector dashboard in Grafana provides a comprehensive visualization of WiFi signal levels from various networks (ESSIDs) over time, allowing users to monitor and analyze network performance at a glance. The dashboard features real-time and historical data, showing signal strength in dBm on a time-based graph, making it easy to spot fluctuations and trends in WiFi performance. Users can filter the data by various parameters, including ESSID, WiFi band (e.g., 2.4GHz or 5GHz), channel, MAC address, and encryption type, enabling detailed insights into network conditions. The dashboard is highly interactive, with customizable interval settings for data collection, allowing users to choose between granular or broad time ranges. This flexibility makes the dashboard ideal for troubleshooting connectivity issues, optimizing network performance, or comparing the performance of multiple access points within a specific environment.
More details on these WifiScan Collector dashboards may be found:
Github Project: https://github.com/lux4rd0/wifiscan-collector
Data source config
Collector config:
Upload an updated version of an exported dashboard.json file from Grafana
| Revision | Description | Created | |
|---|---|---|---|
| Download |