jmeter-dashboard-status-server
Dashboard for Jmeter to monitor the status of load generators.
Dashboard for Jmeter to monitor the status of load generators.
Prometheus and Process exporter are used to operate the dashboard.
Detailed information on GitHub.
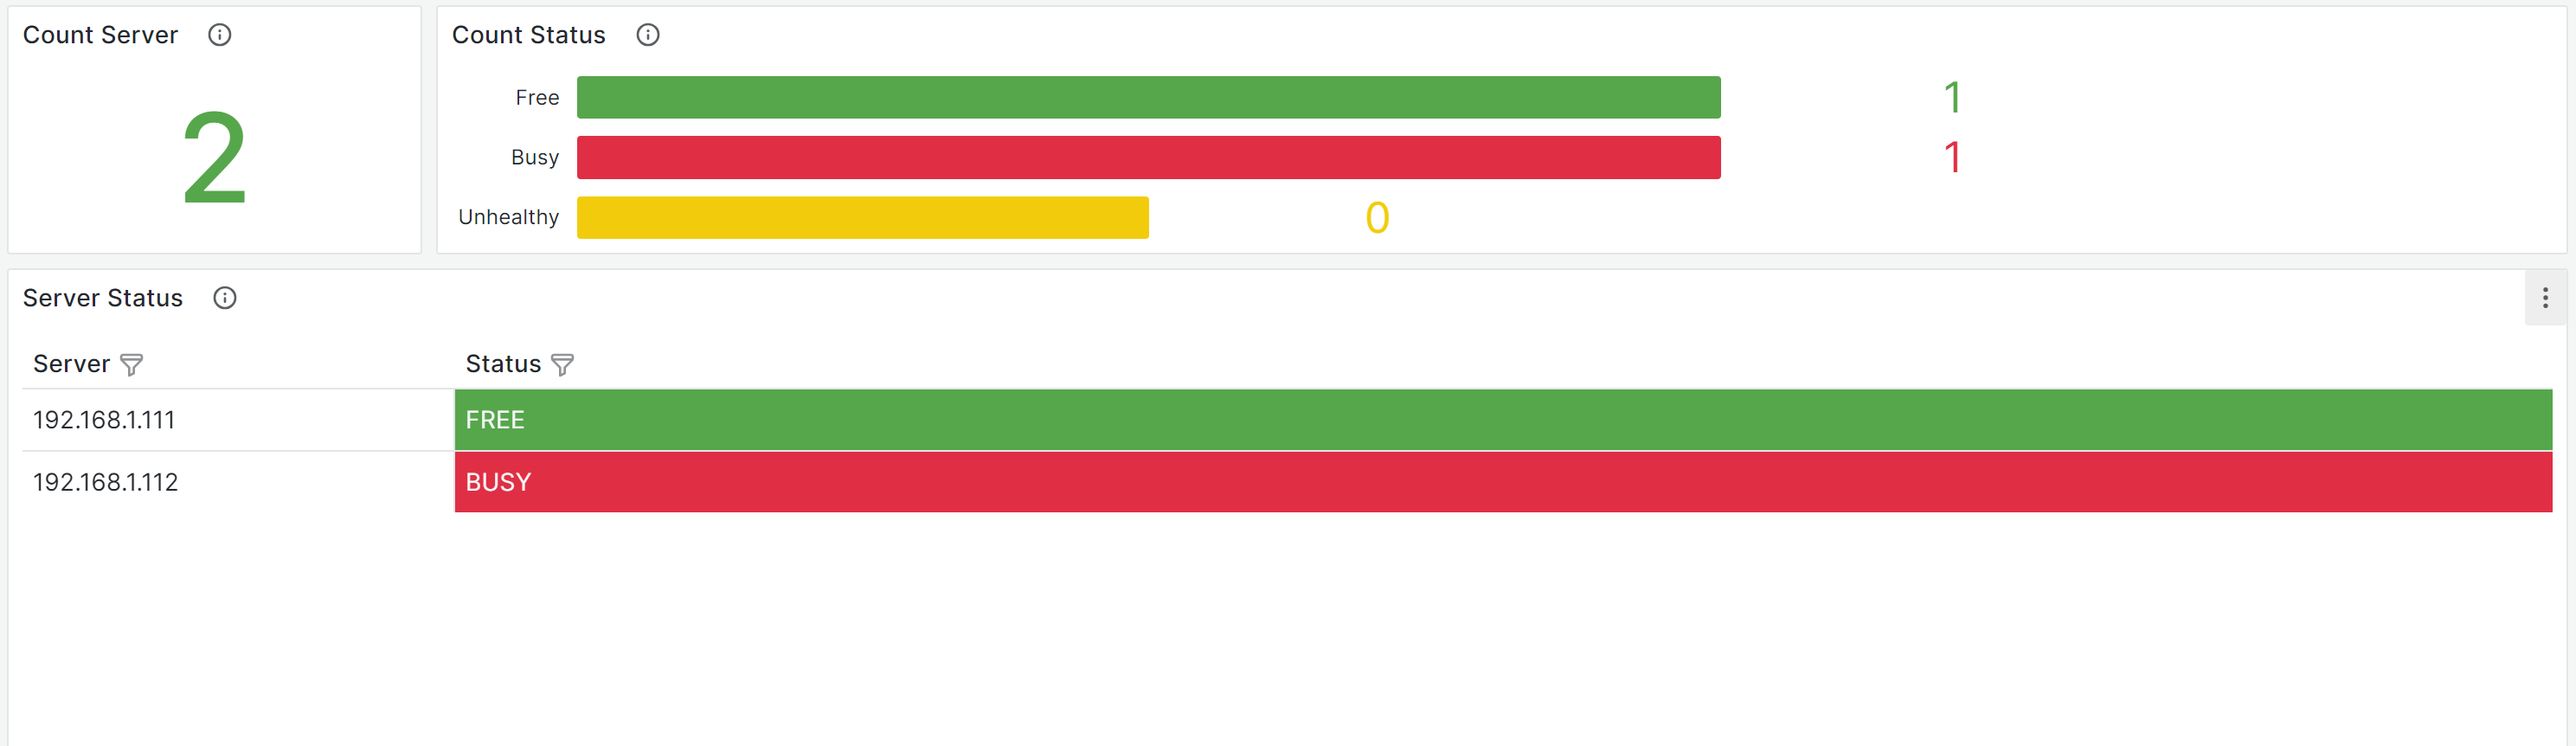
The dashboard contains:
- Count Server - total number of servers
- Count Status - number of servers by availability status:
- Free - free servers
- Busy - busy servers
- Unhealthy - unhealthy servers
- Server Status - table of servers with availability statuses:
- Free - the server is free
- Busy - the server is busy
Data source config
Collector type:
Collector plugins:
Collector config:
Revisions
Upload an updated version of an exported dashboard.json file from Grafana
| Revision | Description | Created | |
|---|---|---|---|
| Download |