Server stats
All the info you need of your Linux server using Telegraf, InfluxDB and of course Grafana!
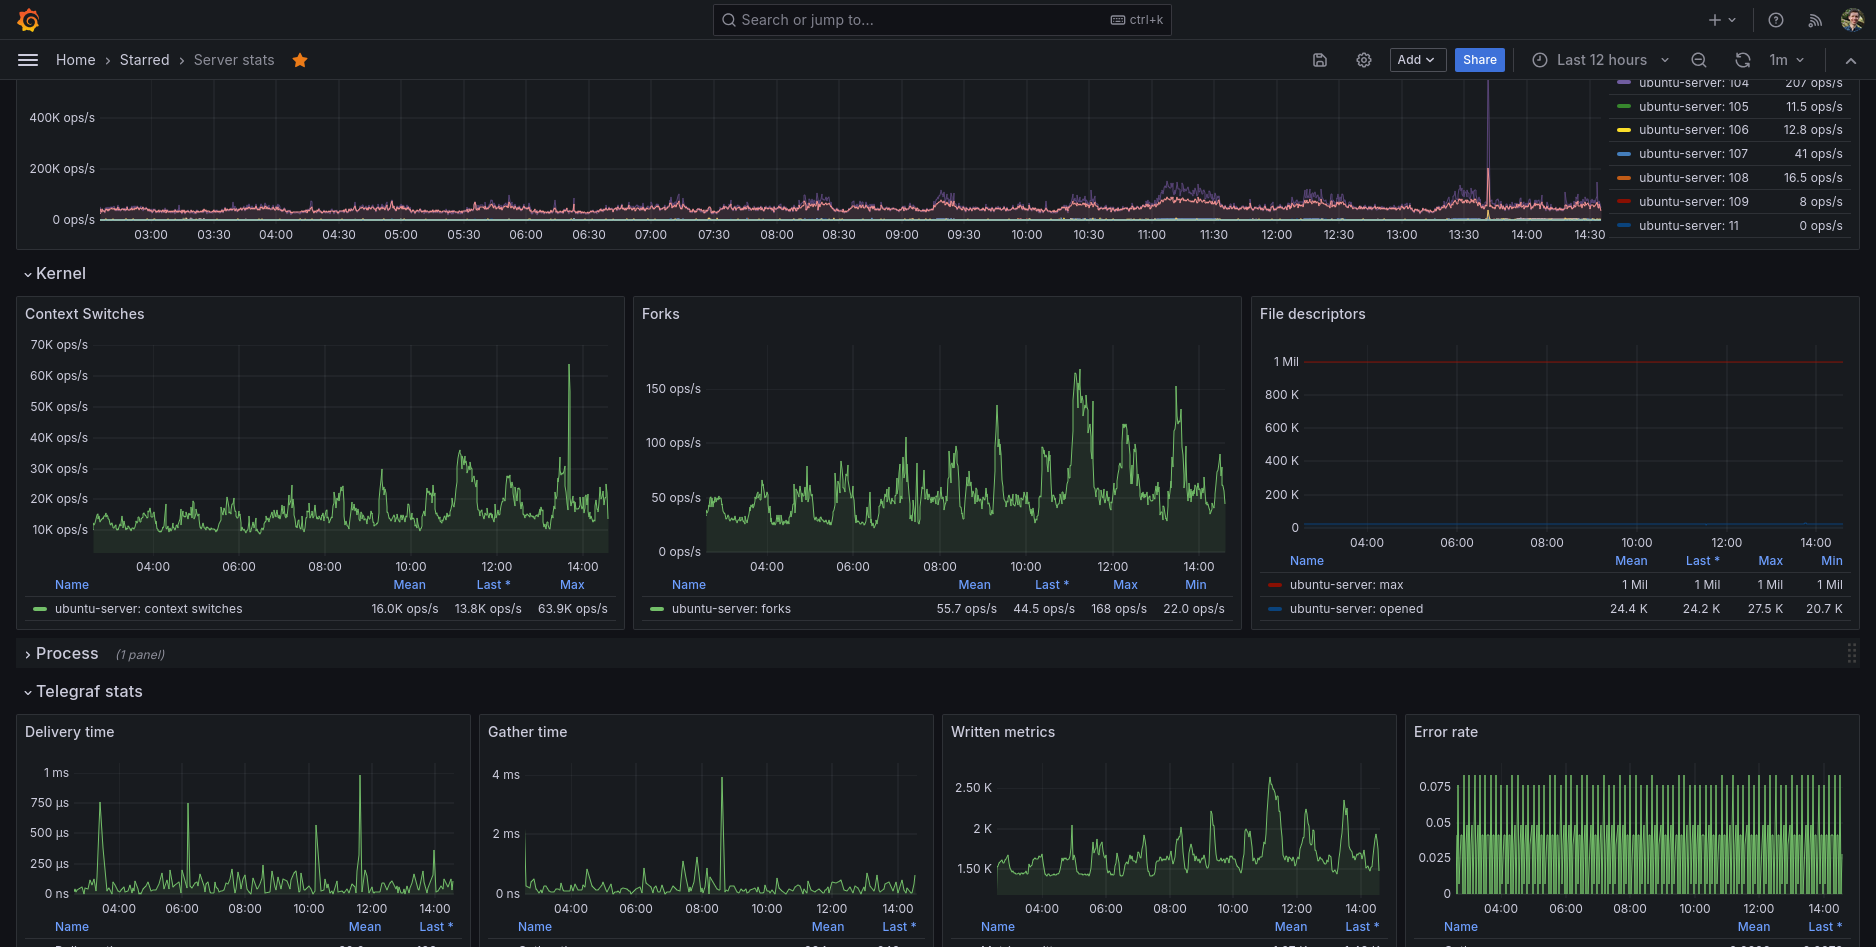
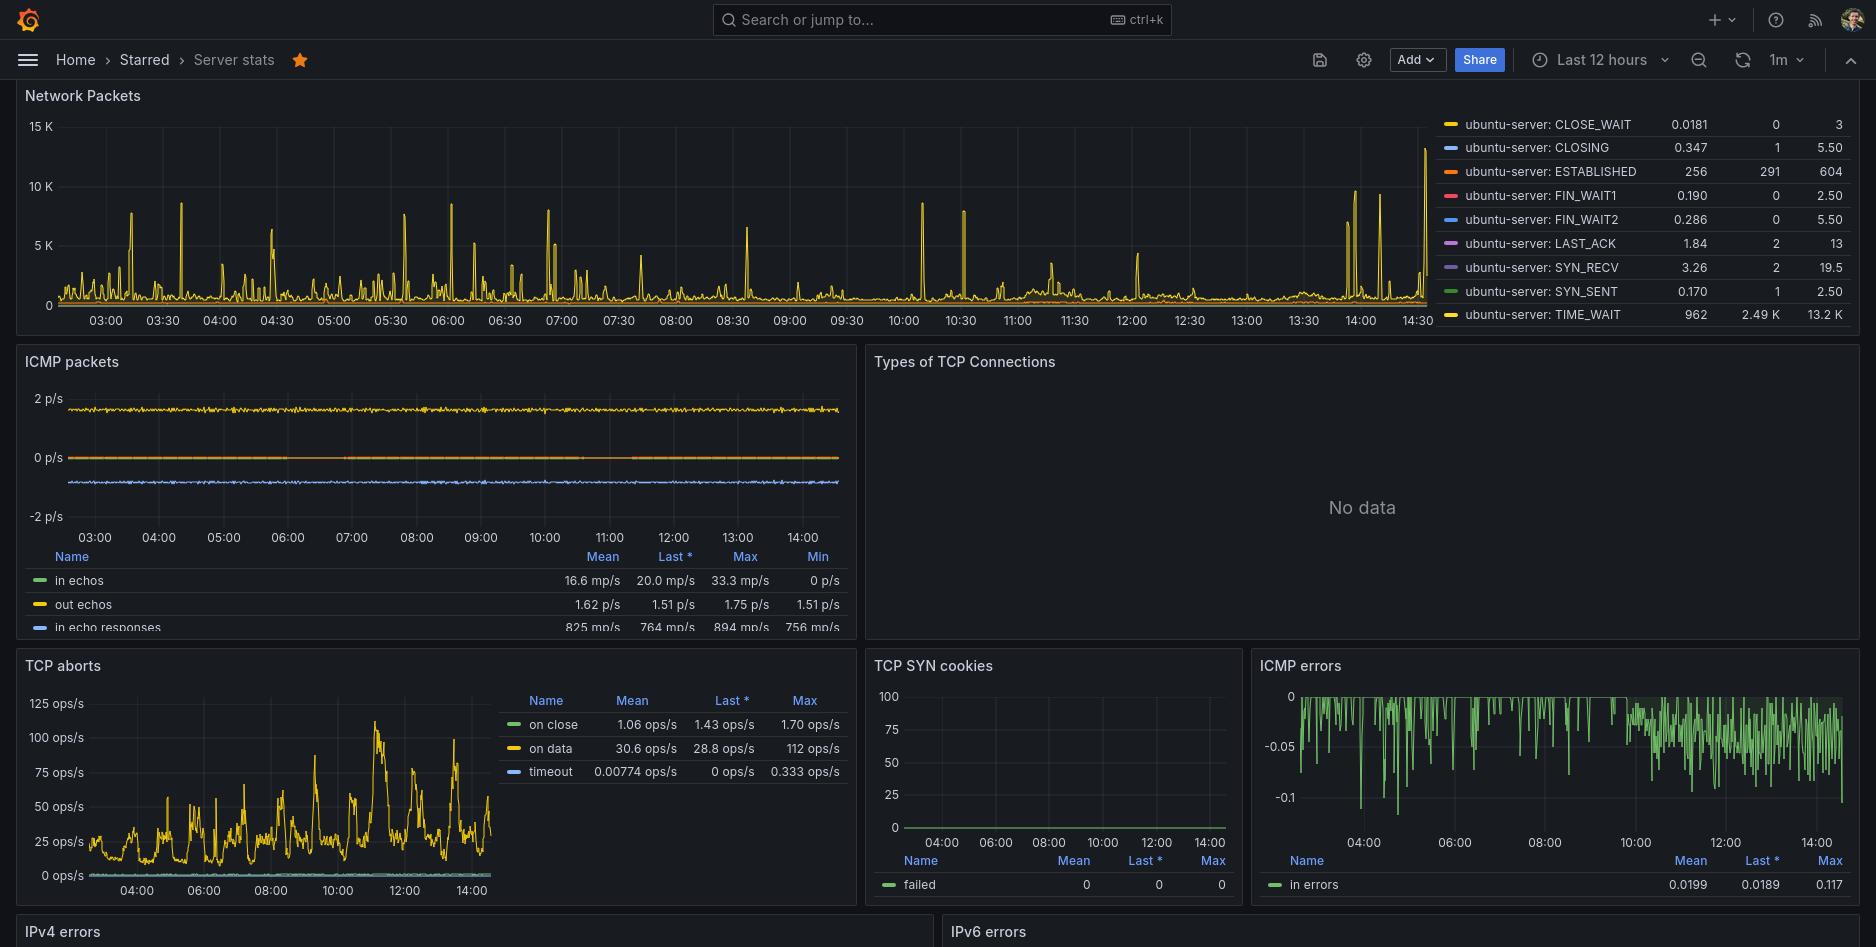
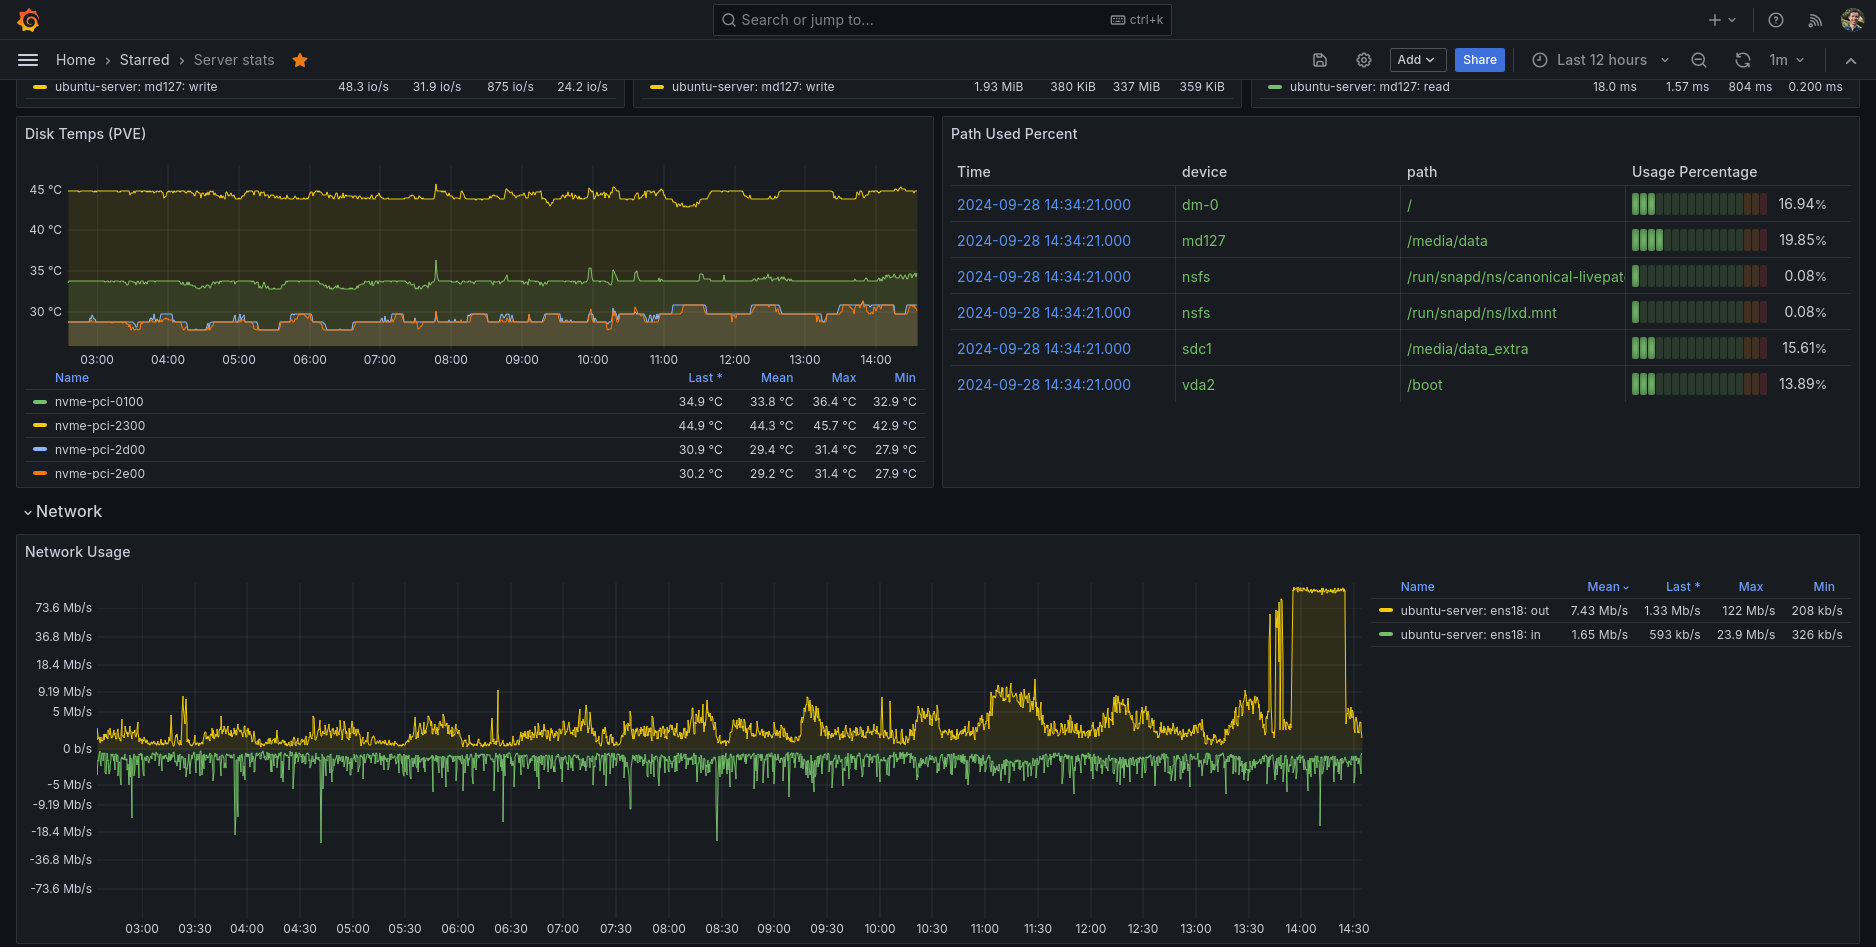
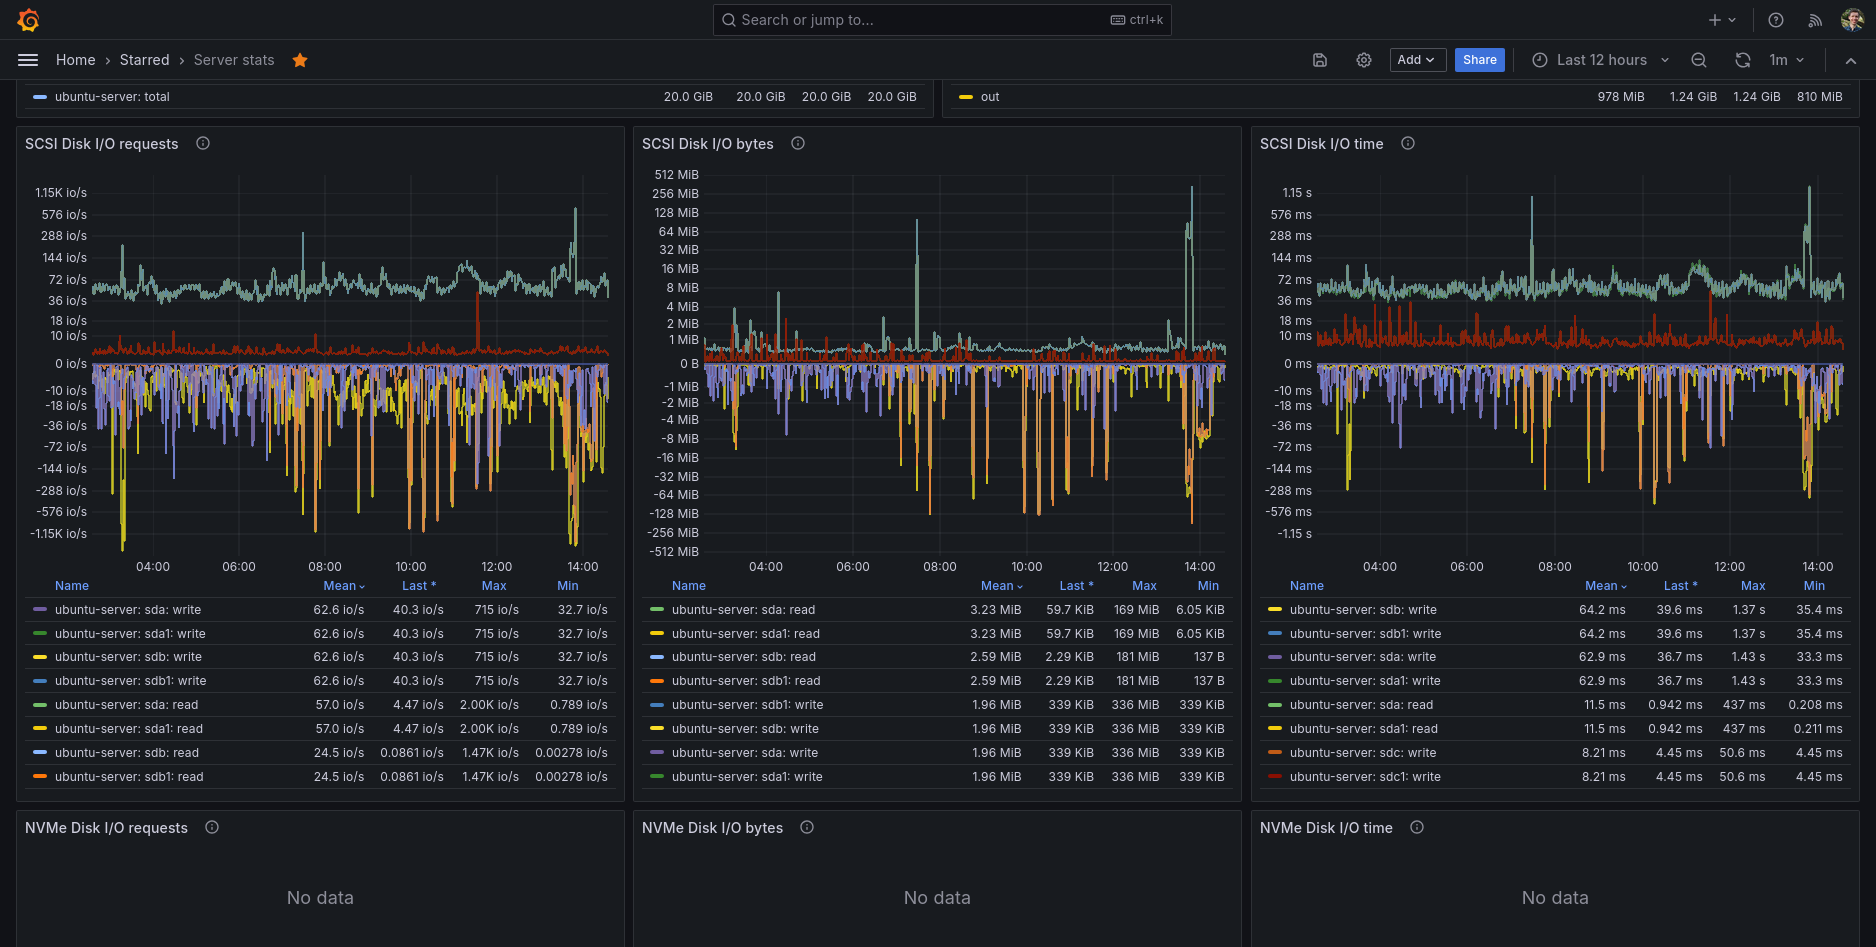
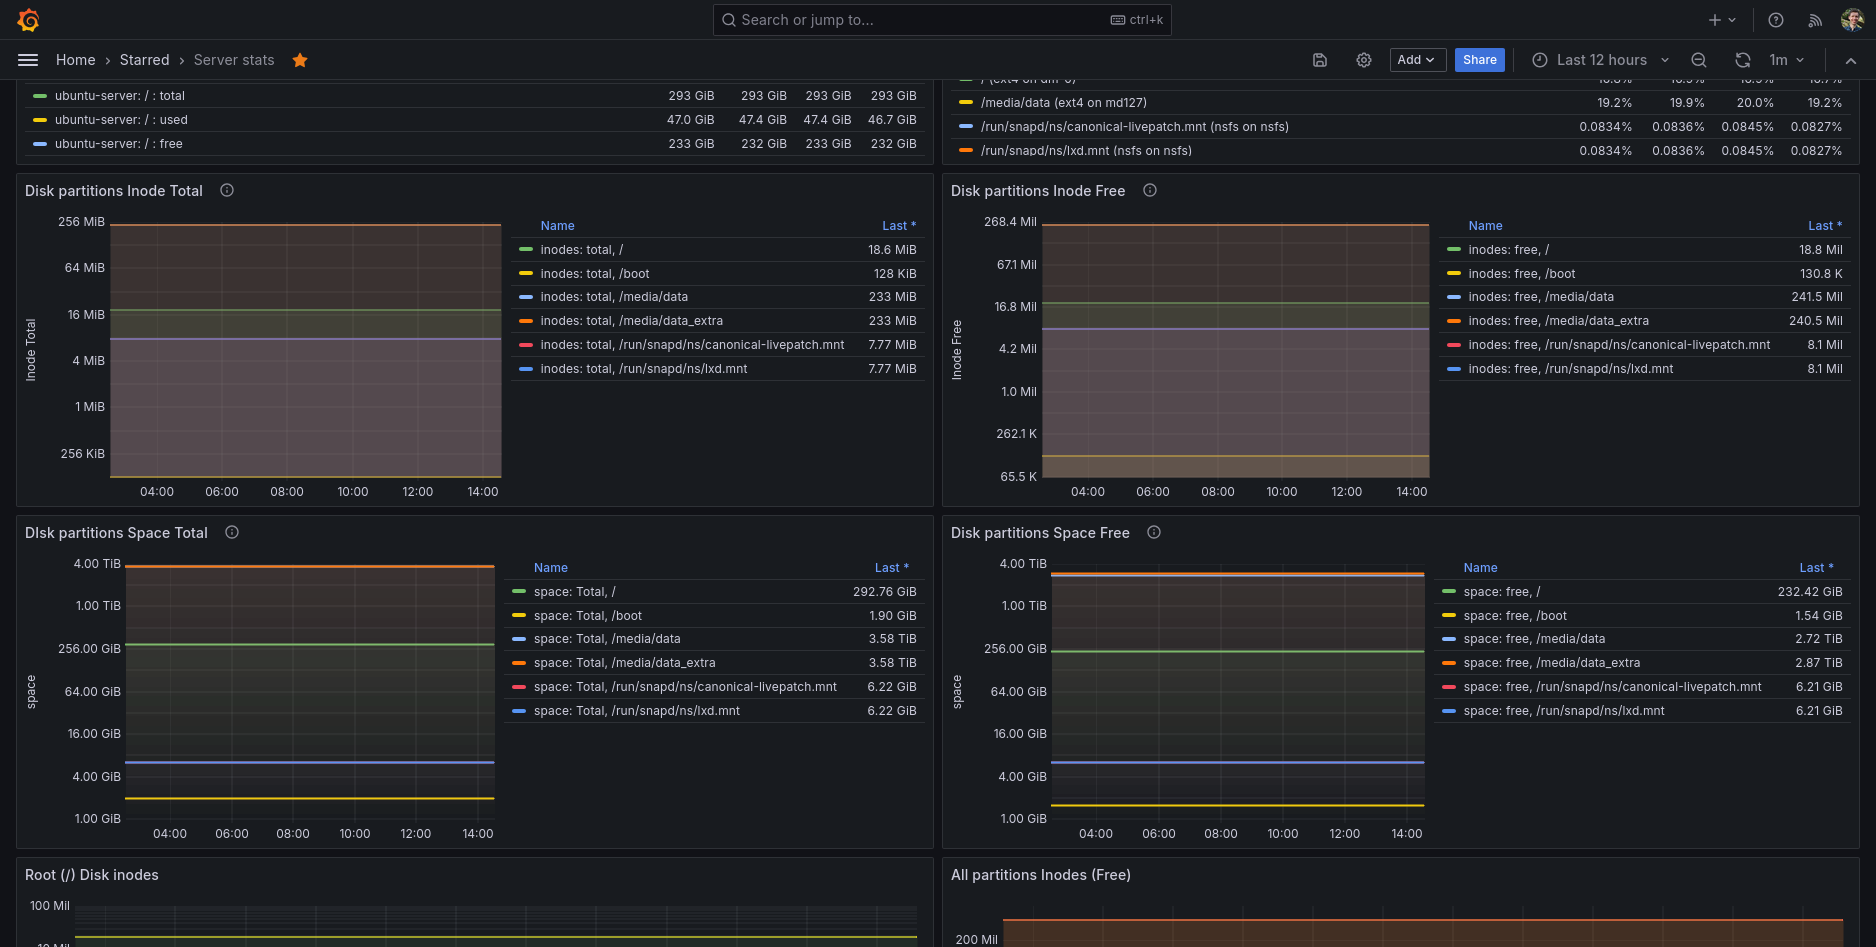
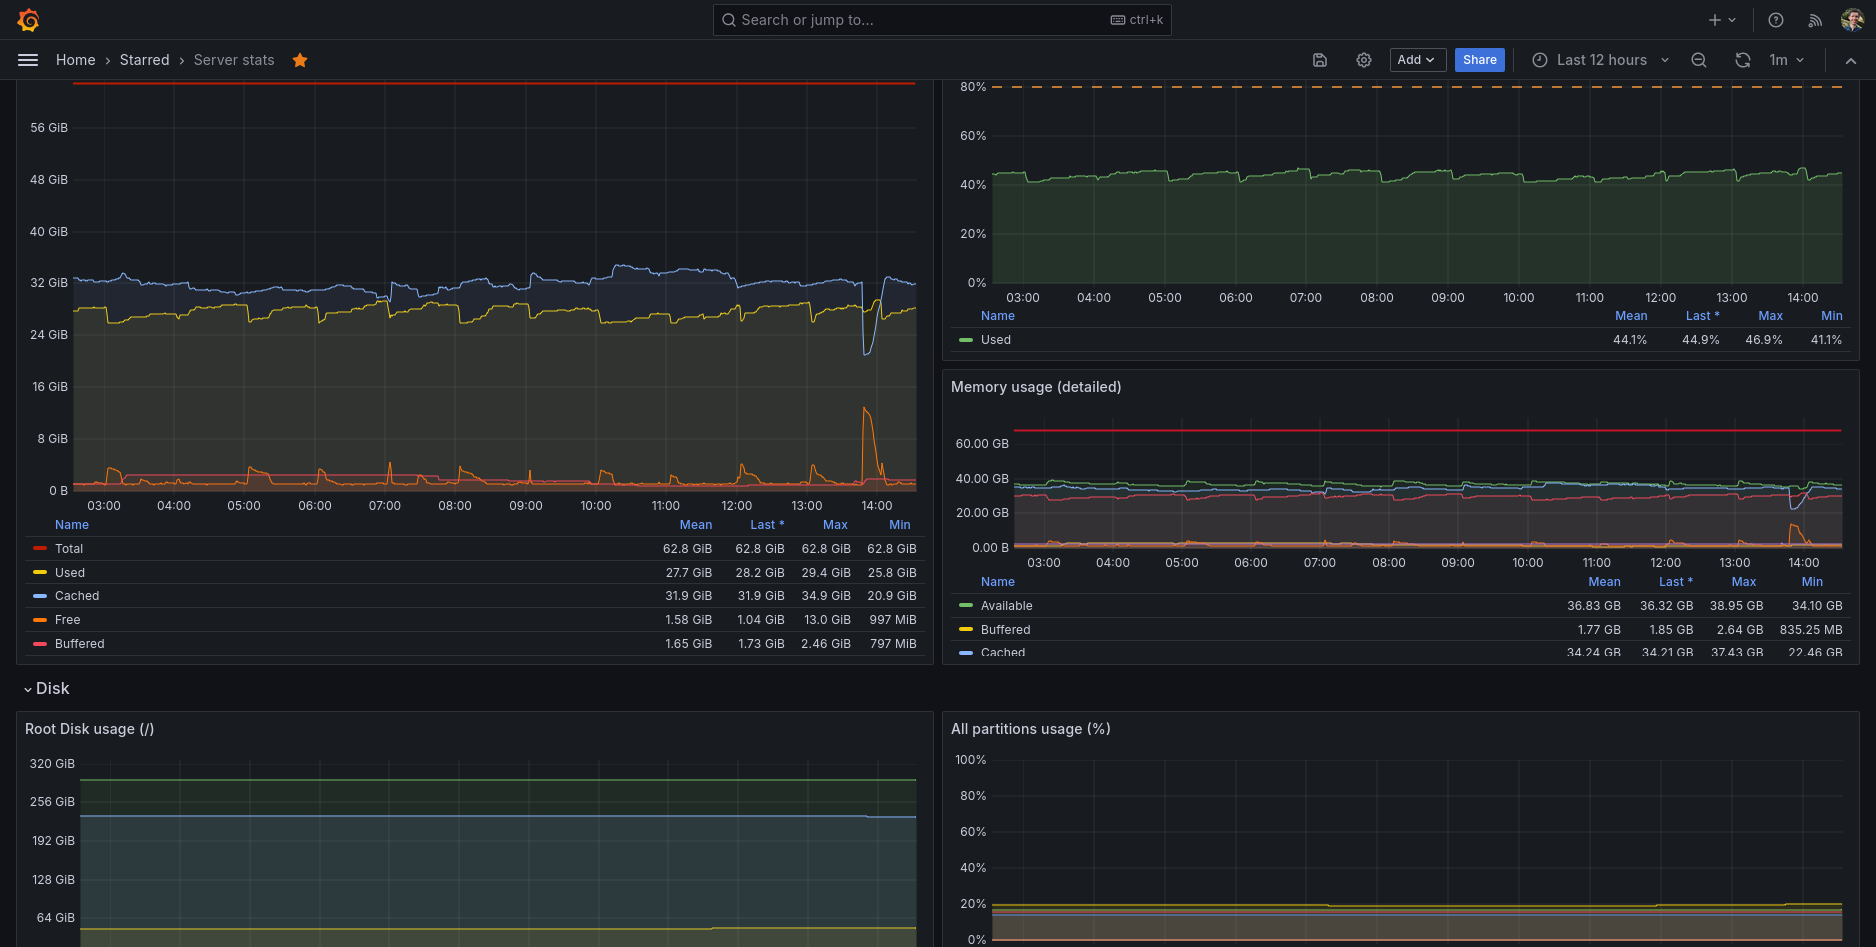
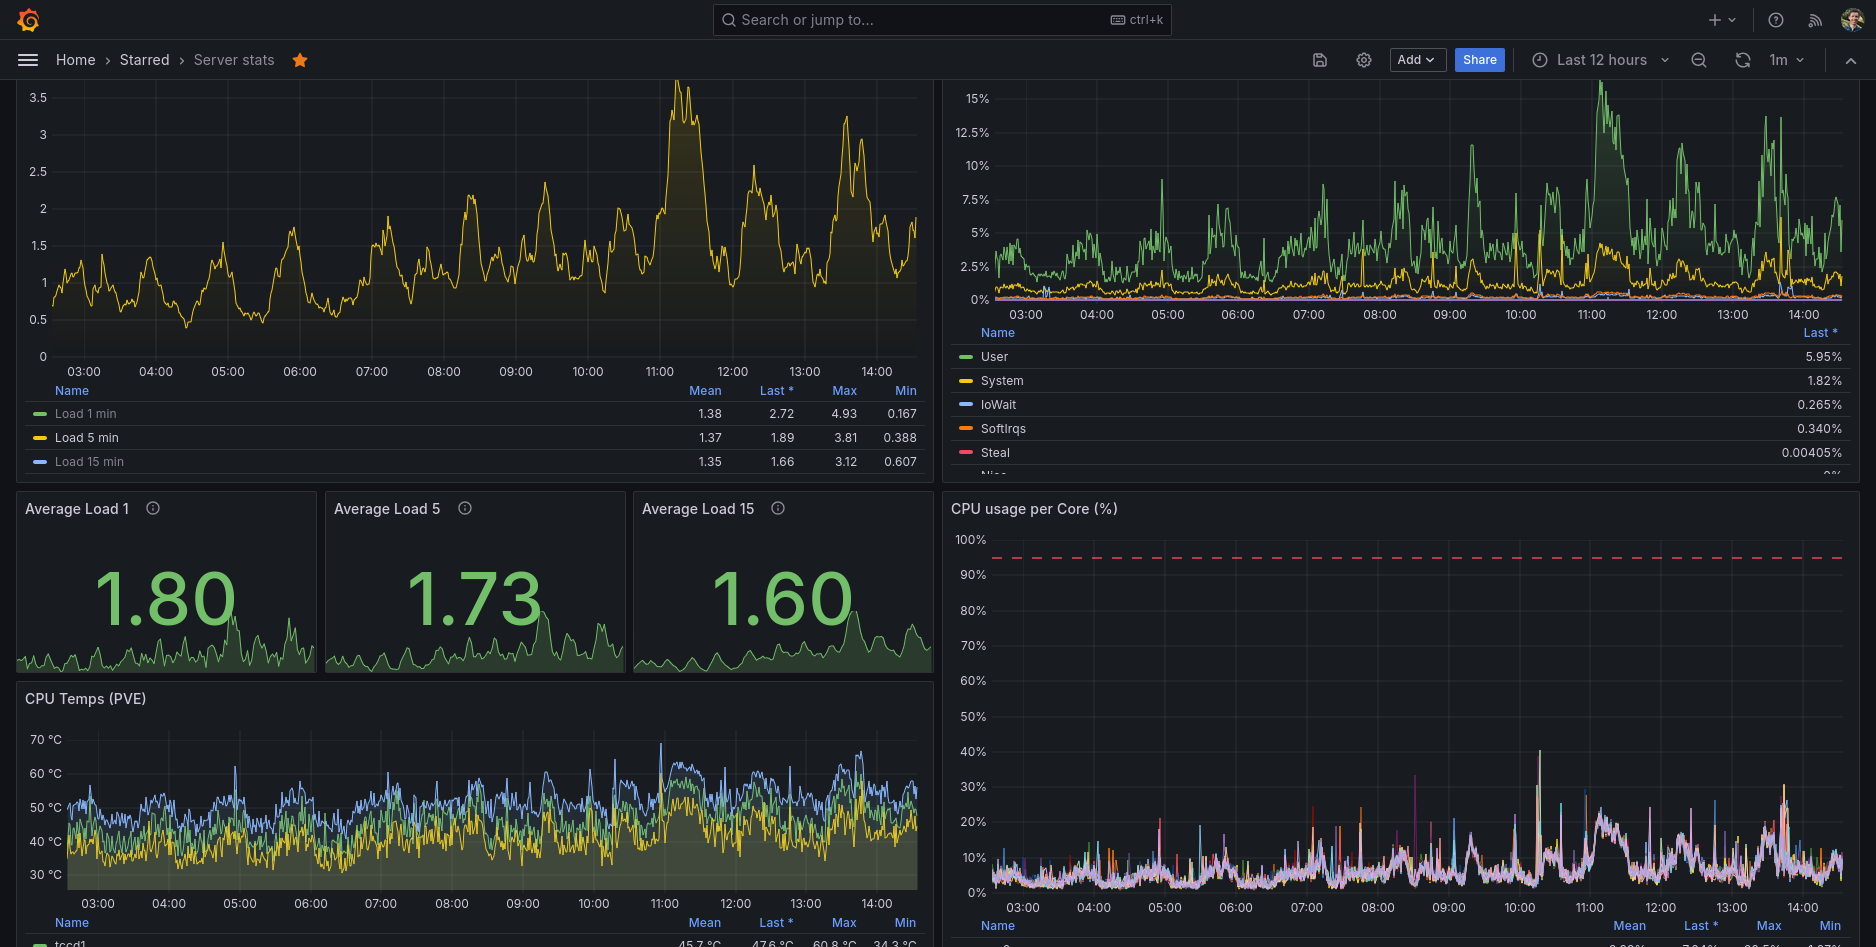
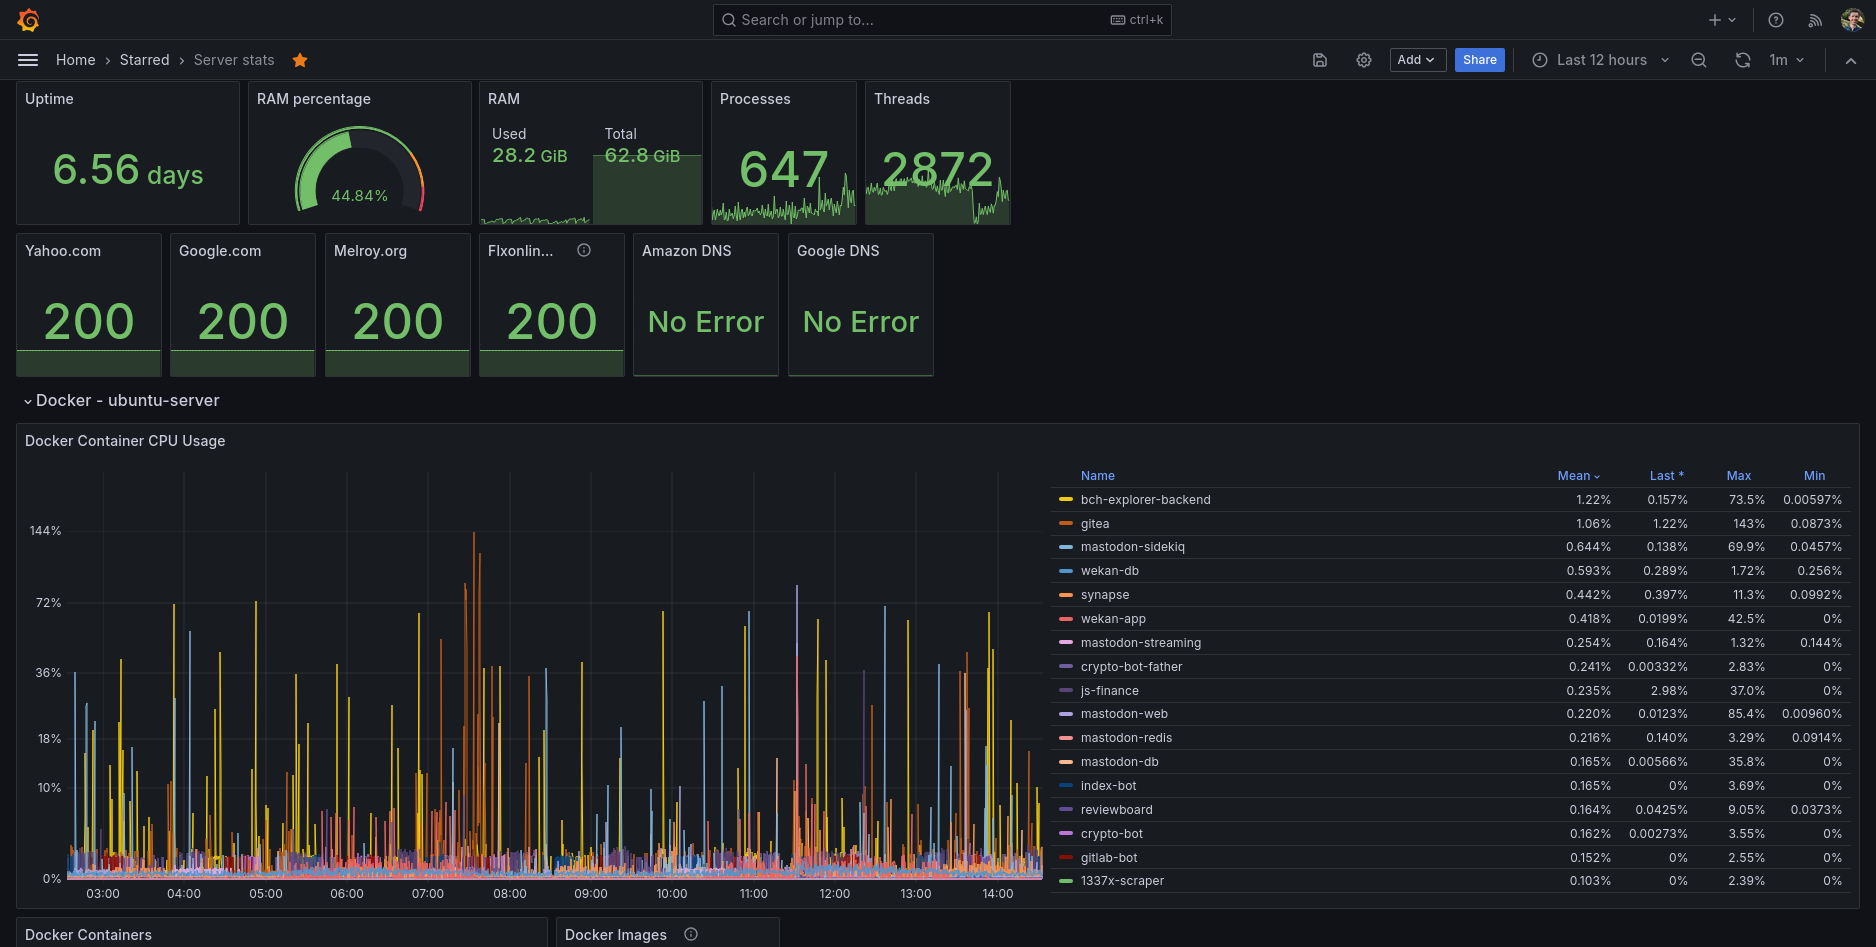
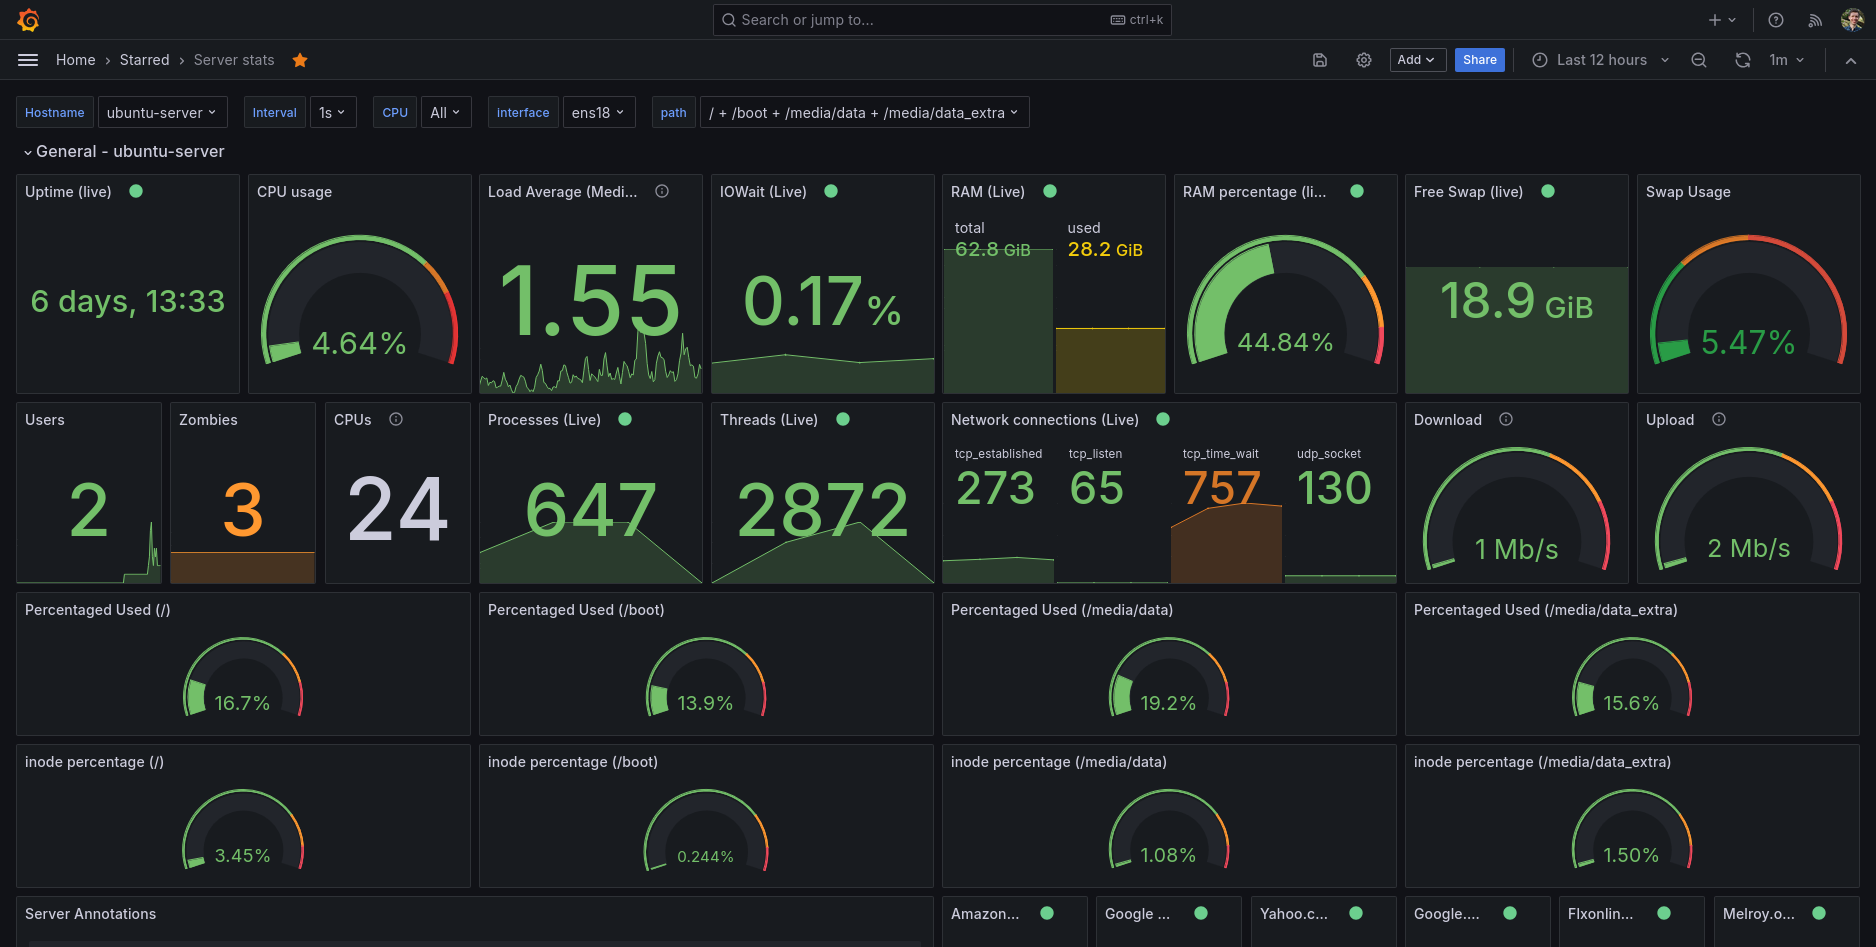
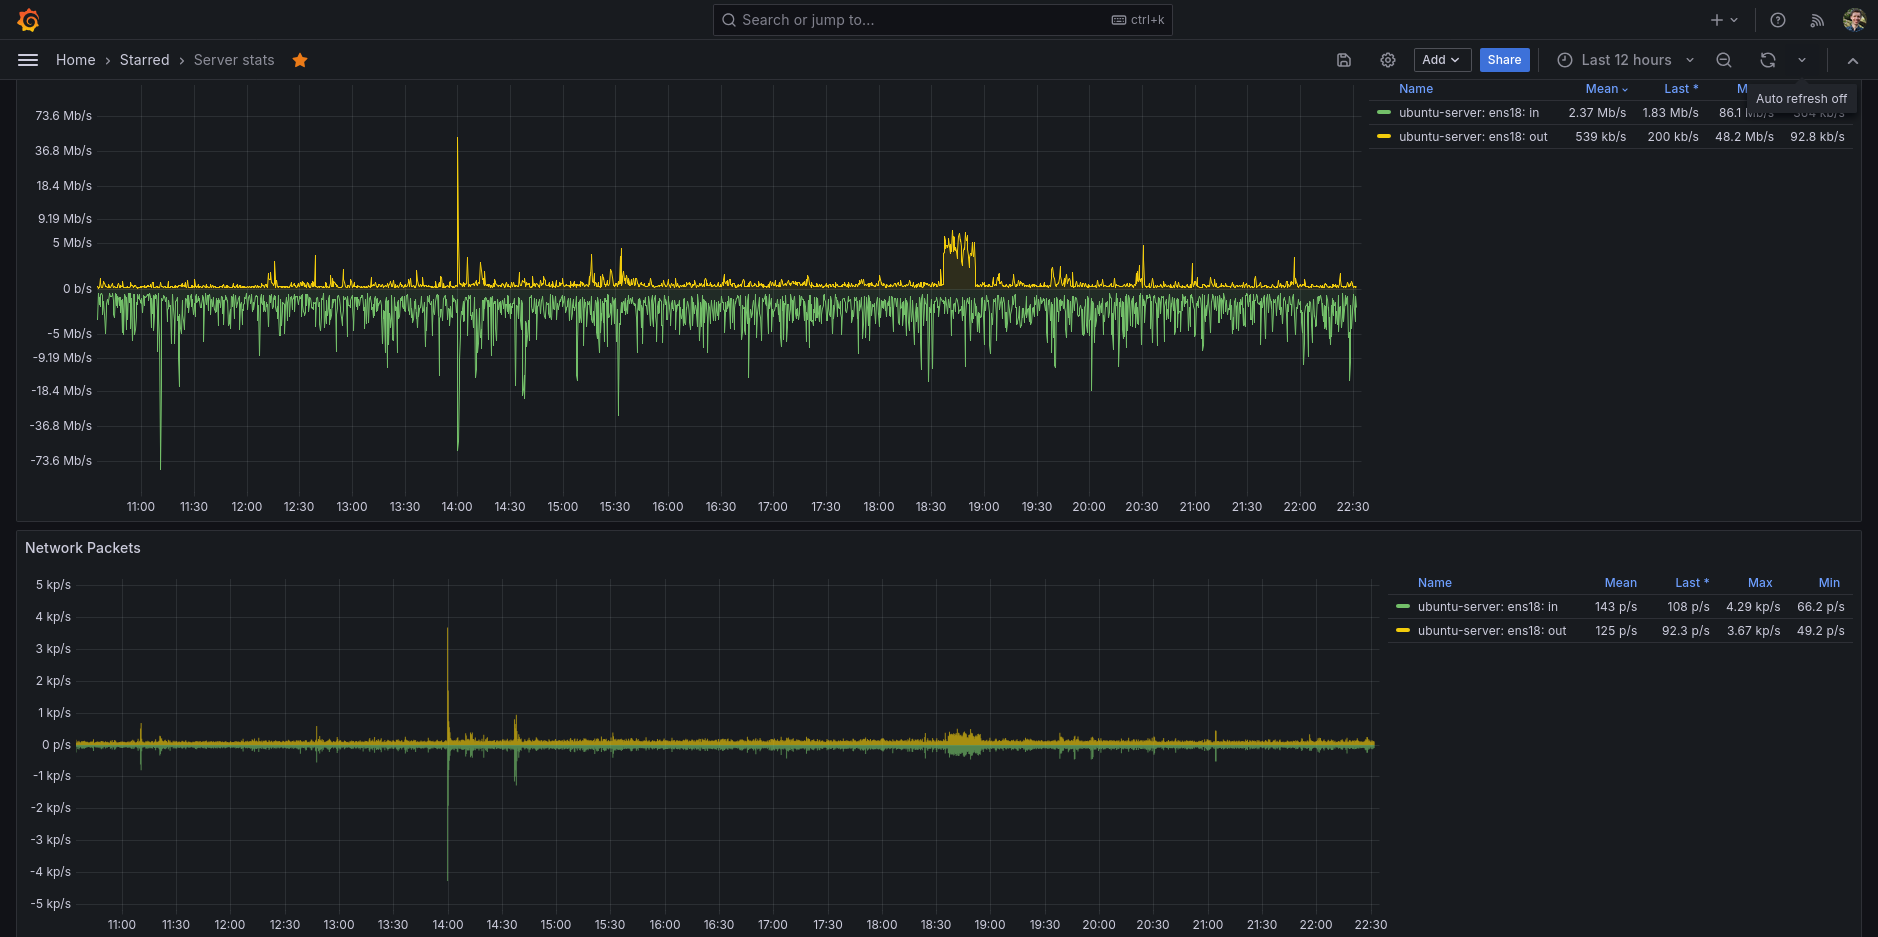
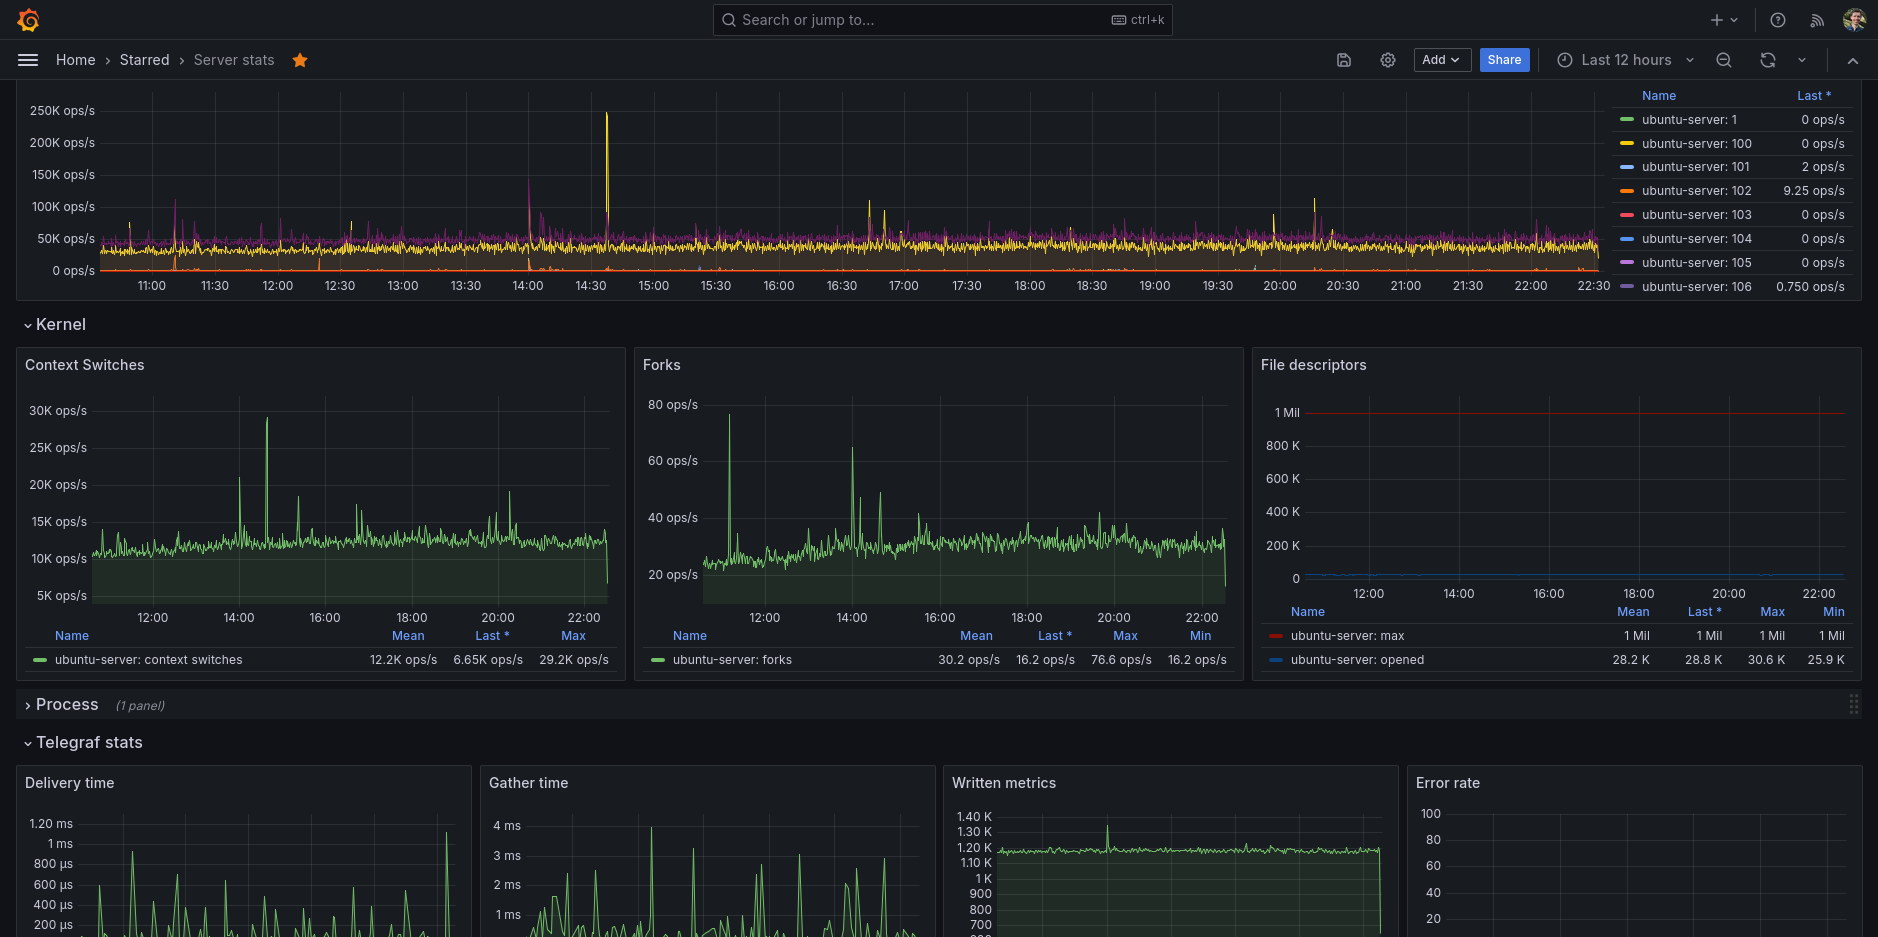
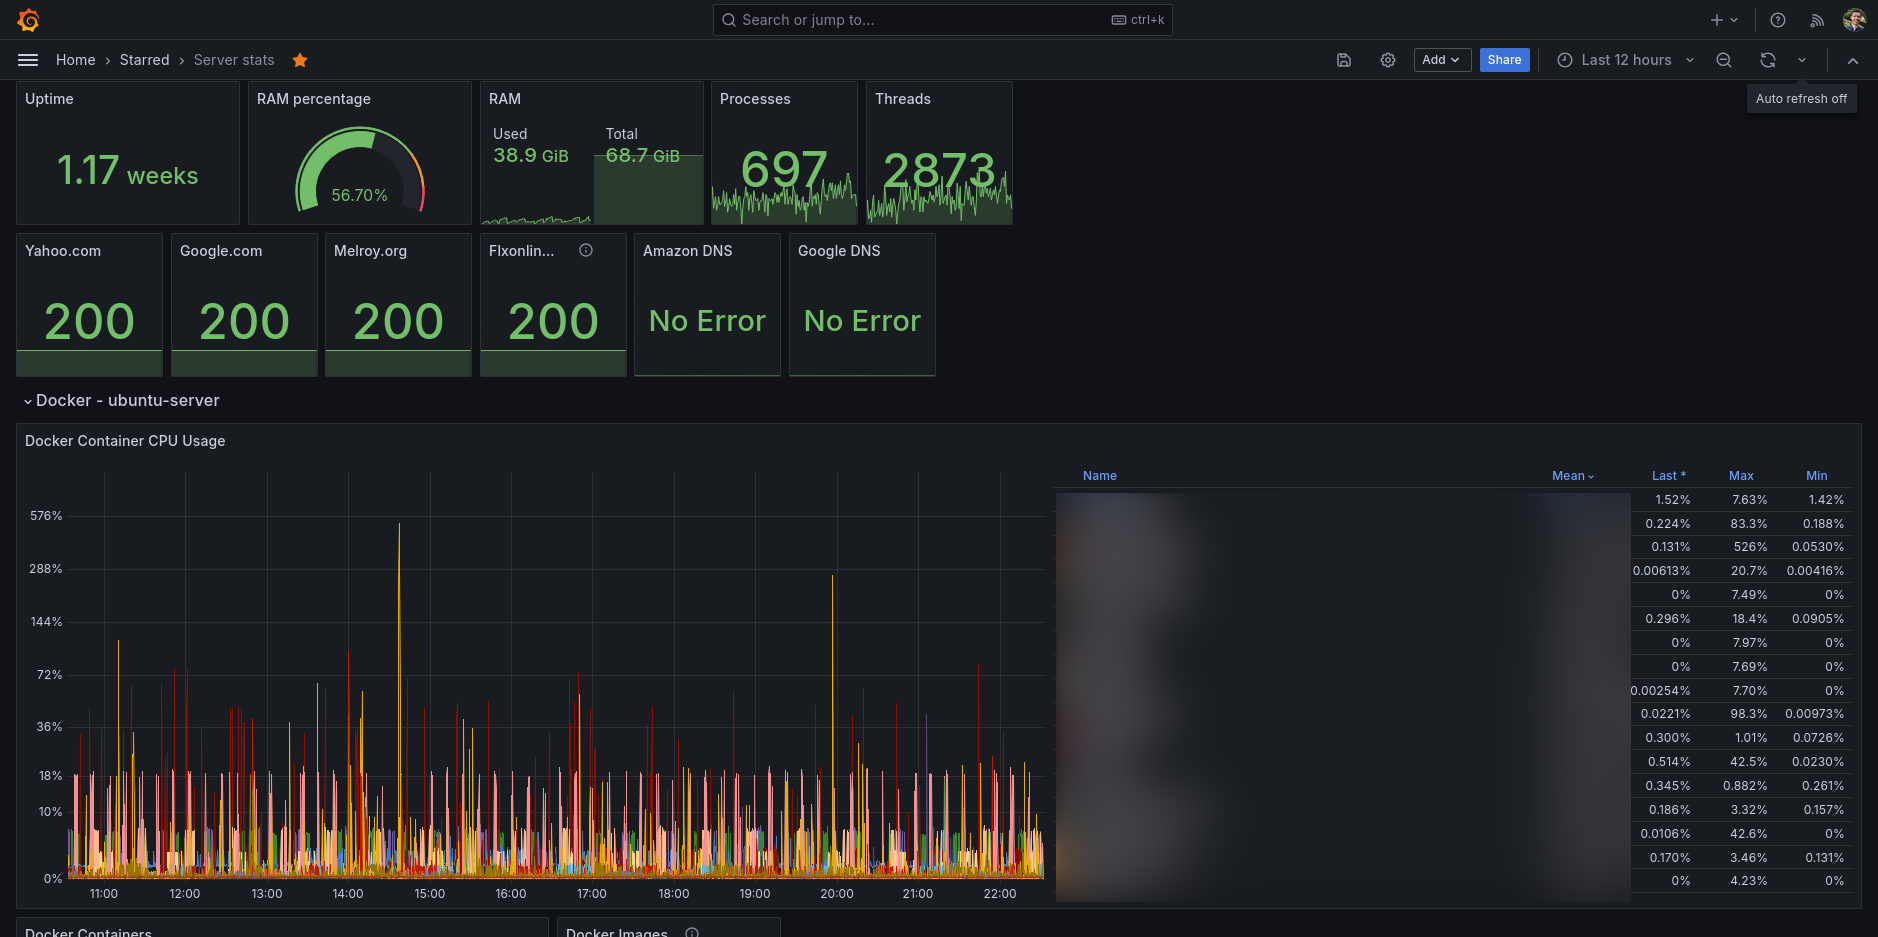
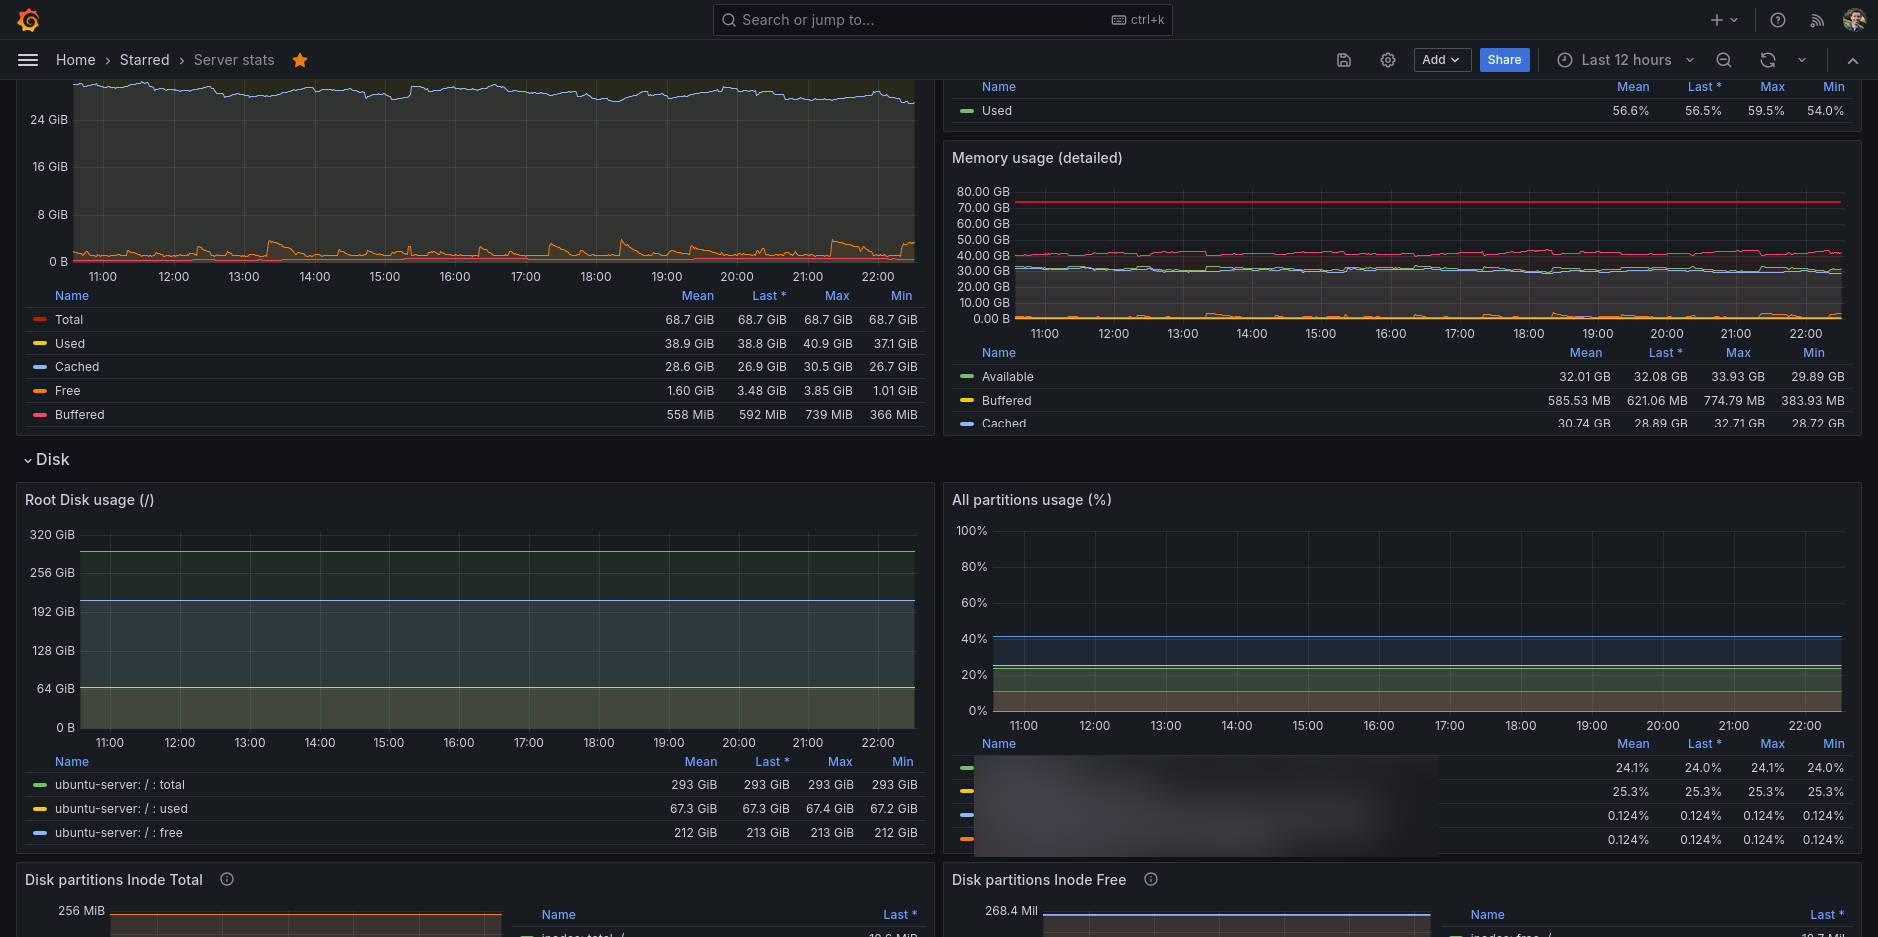
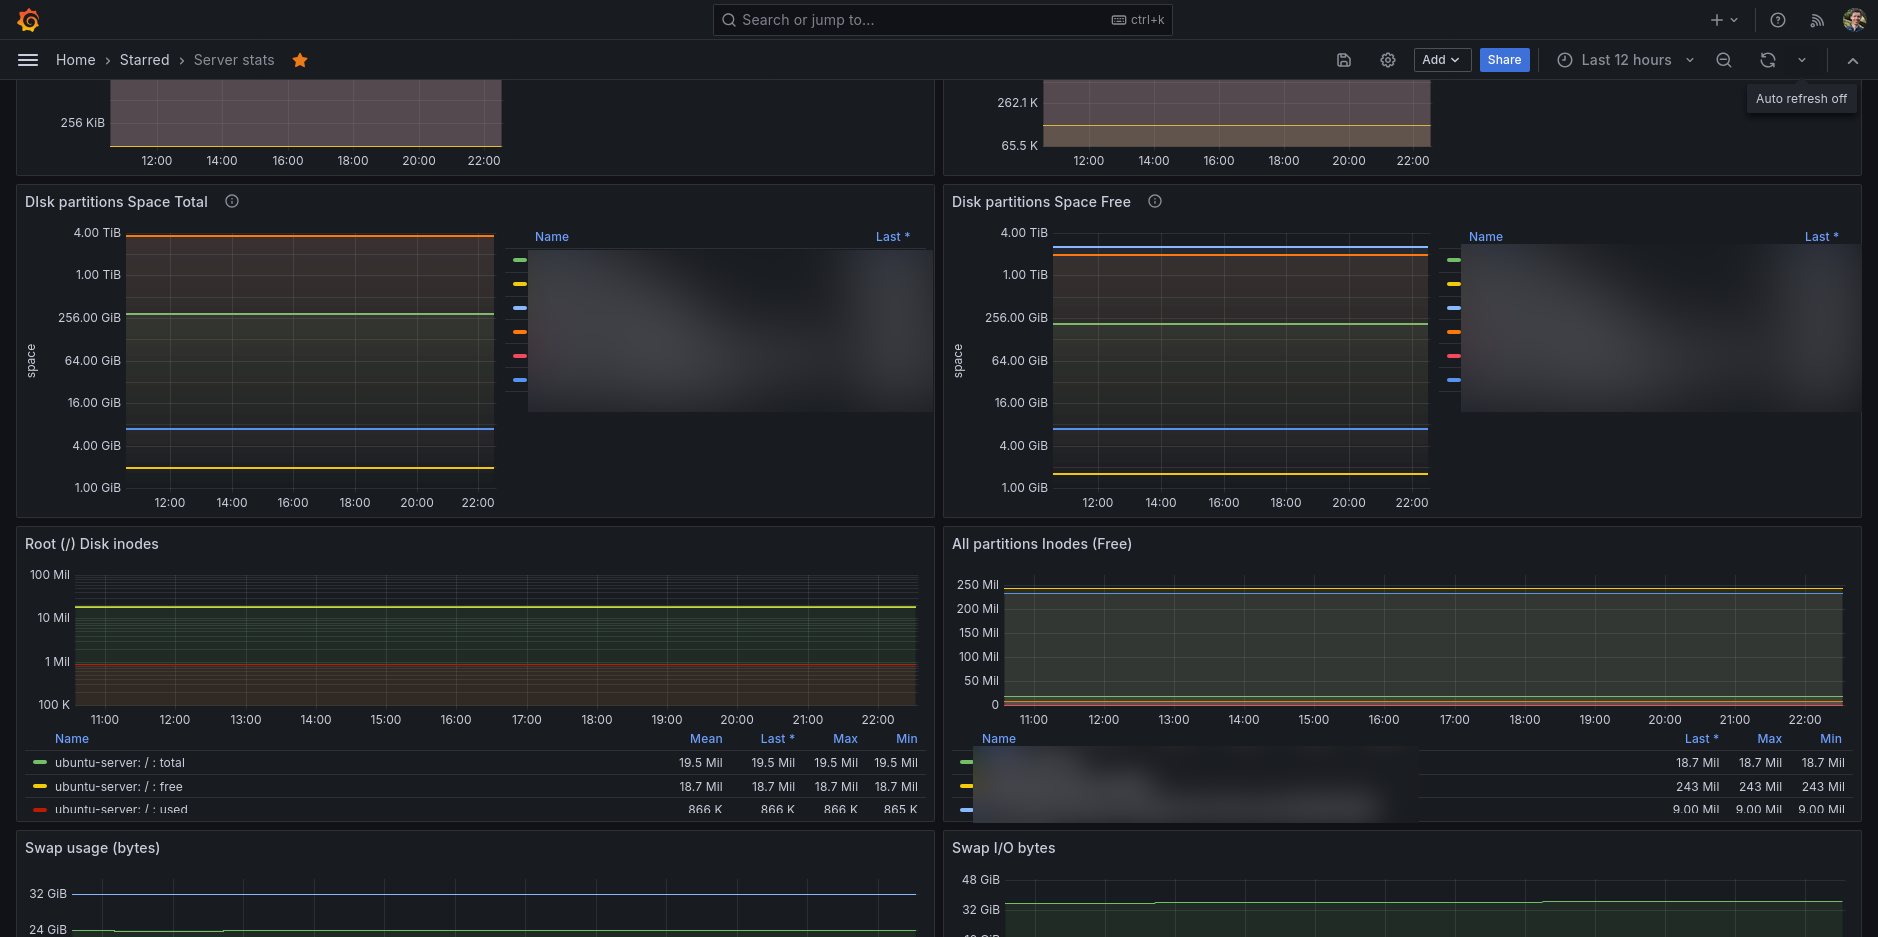
My main go-to Grafana dashboard for my Ubuntu server. A full featured dashboard showing you all the information you ever want to know about your GNU/Linux server.
This dashboard is basically using all the available Telegraf input plugins for monitoring your Linux system. See the collector config for all the details.
Data source config
Collector type:
Collector plugins:
Collector config:
Revisions
Upload an updated version of an exported dashboard.json file from Grafana
| Revision | Description | Created | |
|---|---|---|---|
| Download |