Proxmox Server
Proxmox Dashboard complete written in Flux w/ Cluster support
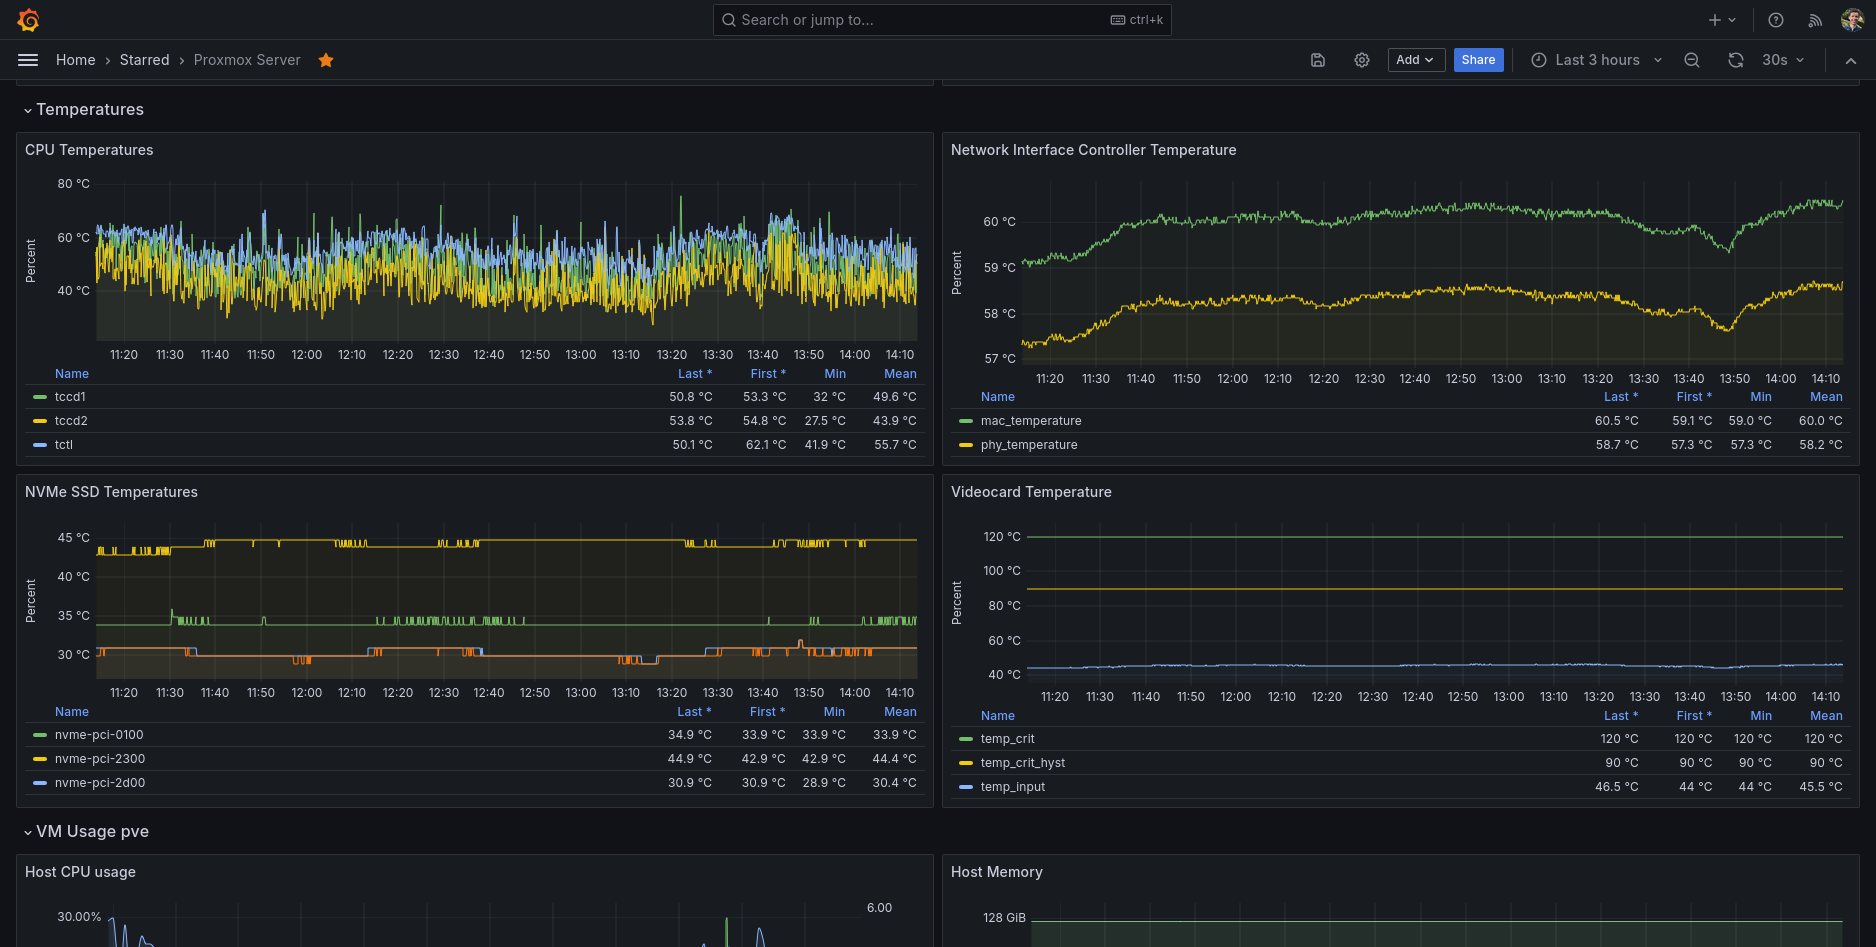
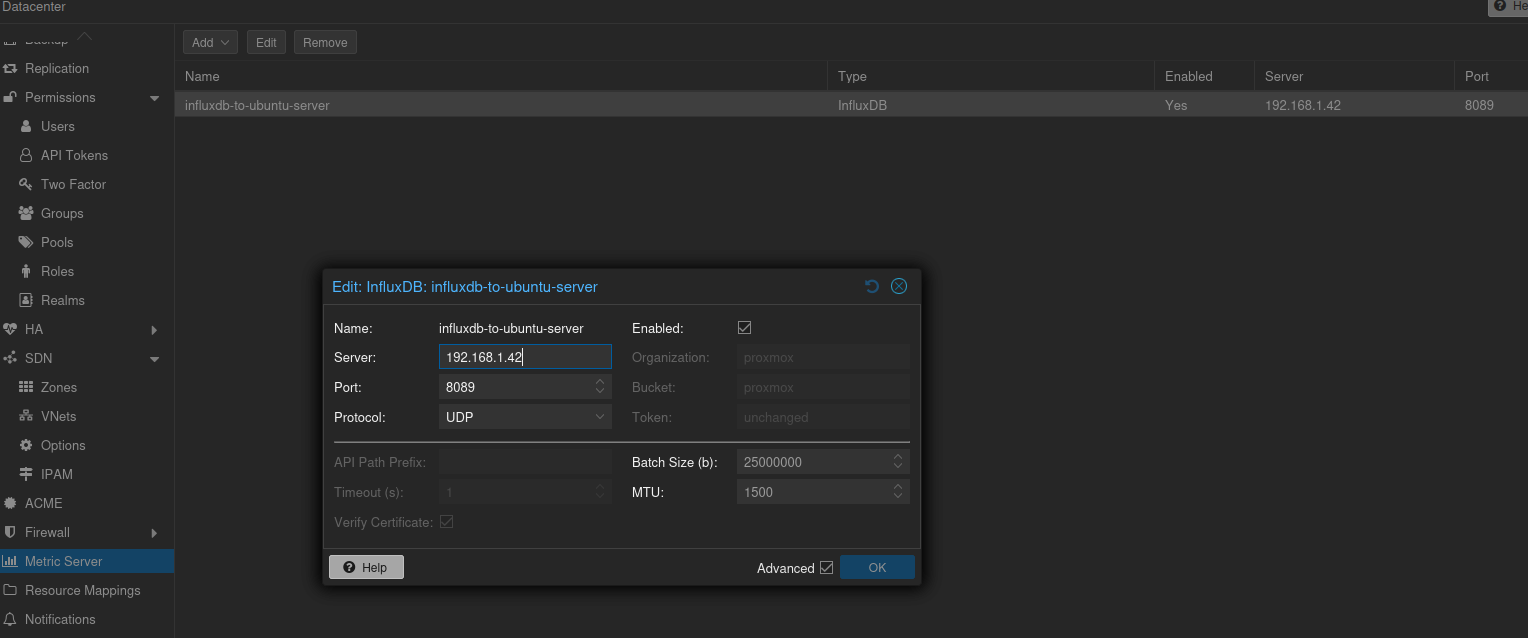
Proxmox virtual environment Grafana dashboard. Using data from influxdb Flux.This requires you to configure and setup a metrics server that sent data from the PVE (Promox server) to your data collection server and use port 8089 UDP in InfluxDB in order to retrieve the metric data.
We run a telegraf service (you need to manually install this on your PVE server). And configure the output plugin to sent to the influxdb on the other host that is running the influxdb (and grafana) server:
[[outputs.influxdb_v2]]
   urls = ["http://192.168.1.42:8086"]
organization = "proxmox"
bucket = "proxmox"
See the whole Telegraf example above at "Collector/Agent Details".
Telegraf on PVE, but the InfluxDB is hosted on another machine. On this other machine that runs InfluxDB service you will need to configure your influxDB to listen on port 8089:
[[udp]]
  enabled = true
  bind-address = "0.0.0.0:8089"
  database = "proxmox"
  batch-timeout = "2s"
Data source config
Collector config:
Upload an updated version of an exported dashboard.json file from Grafana
| Revision | Description | Created | |
|---|---|---|---|
| Download |