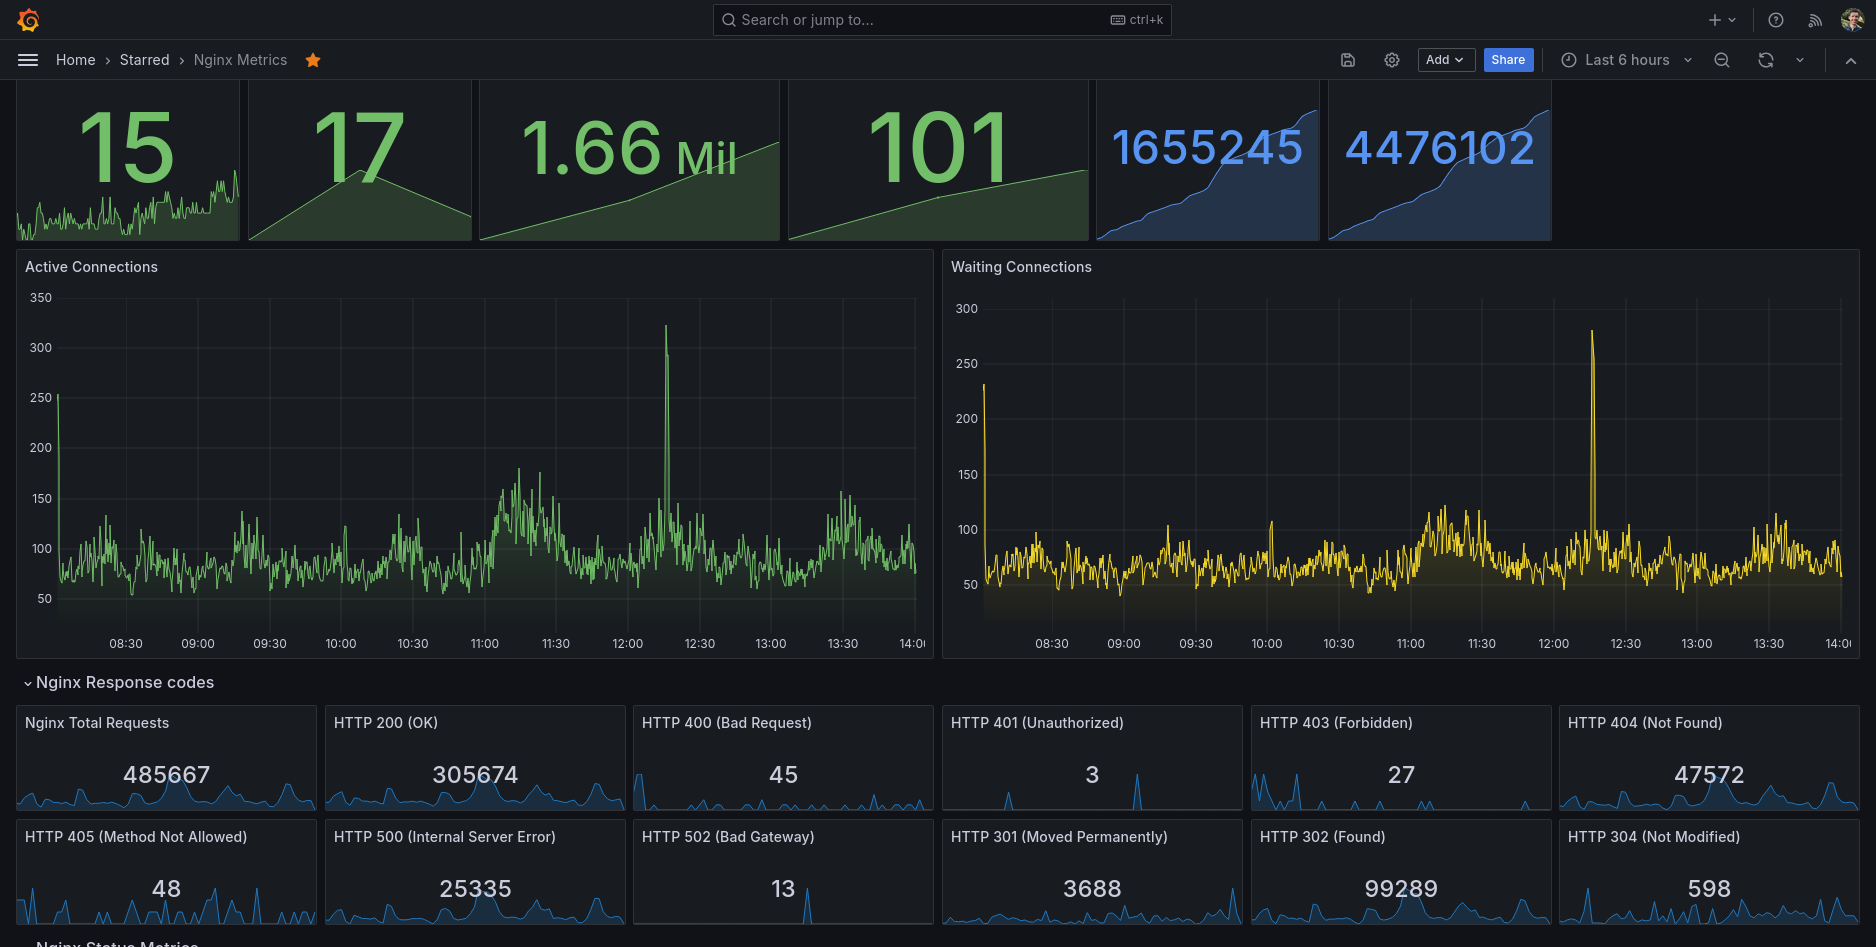
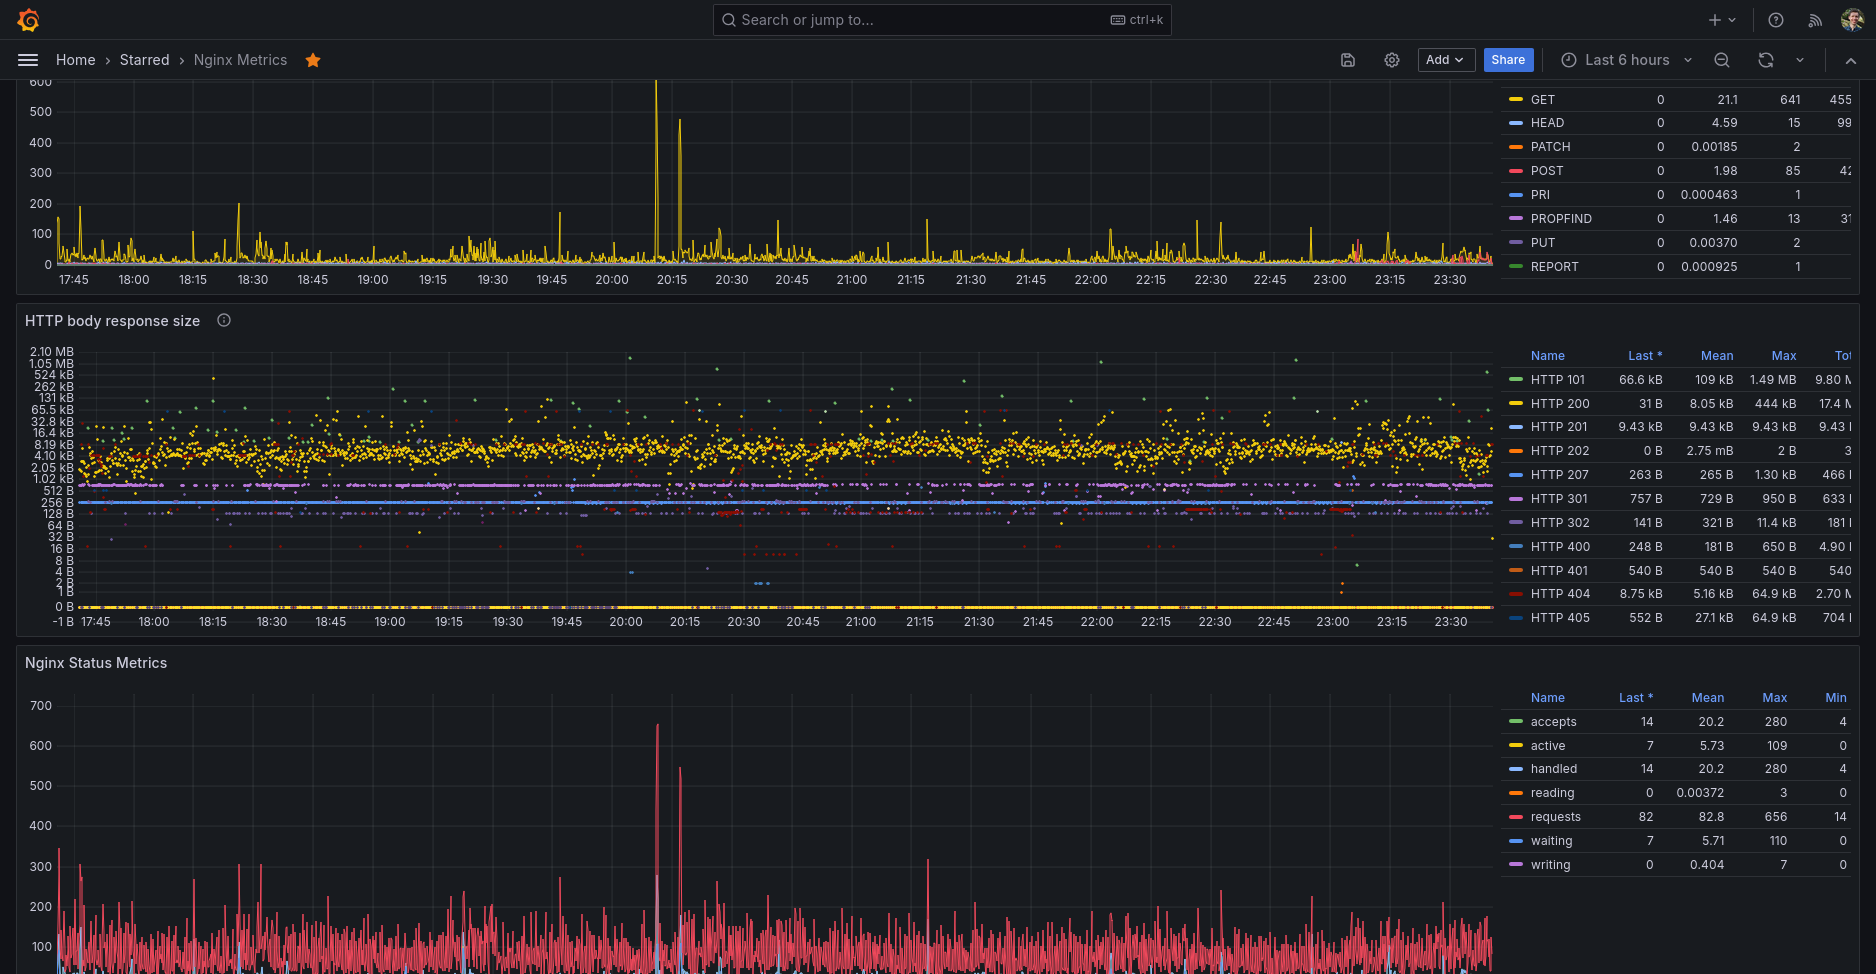
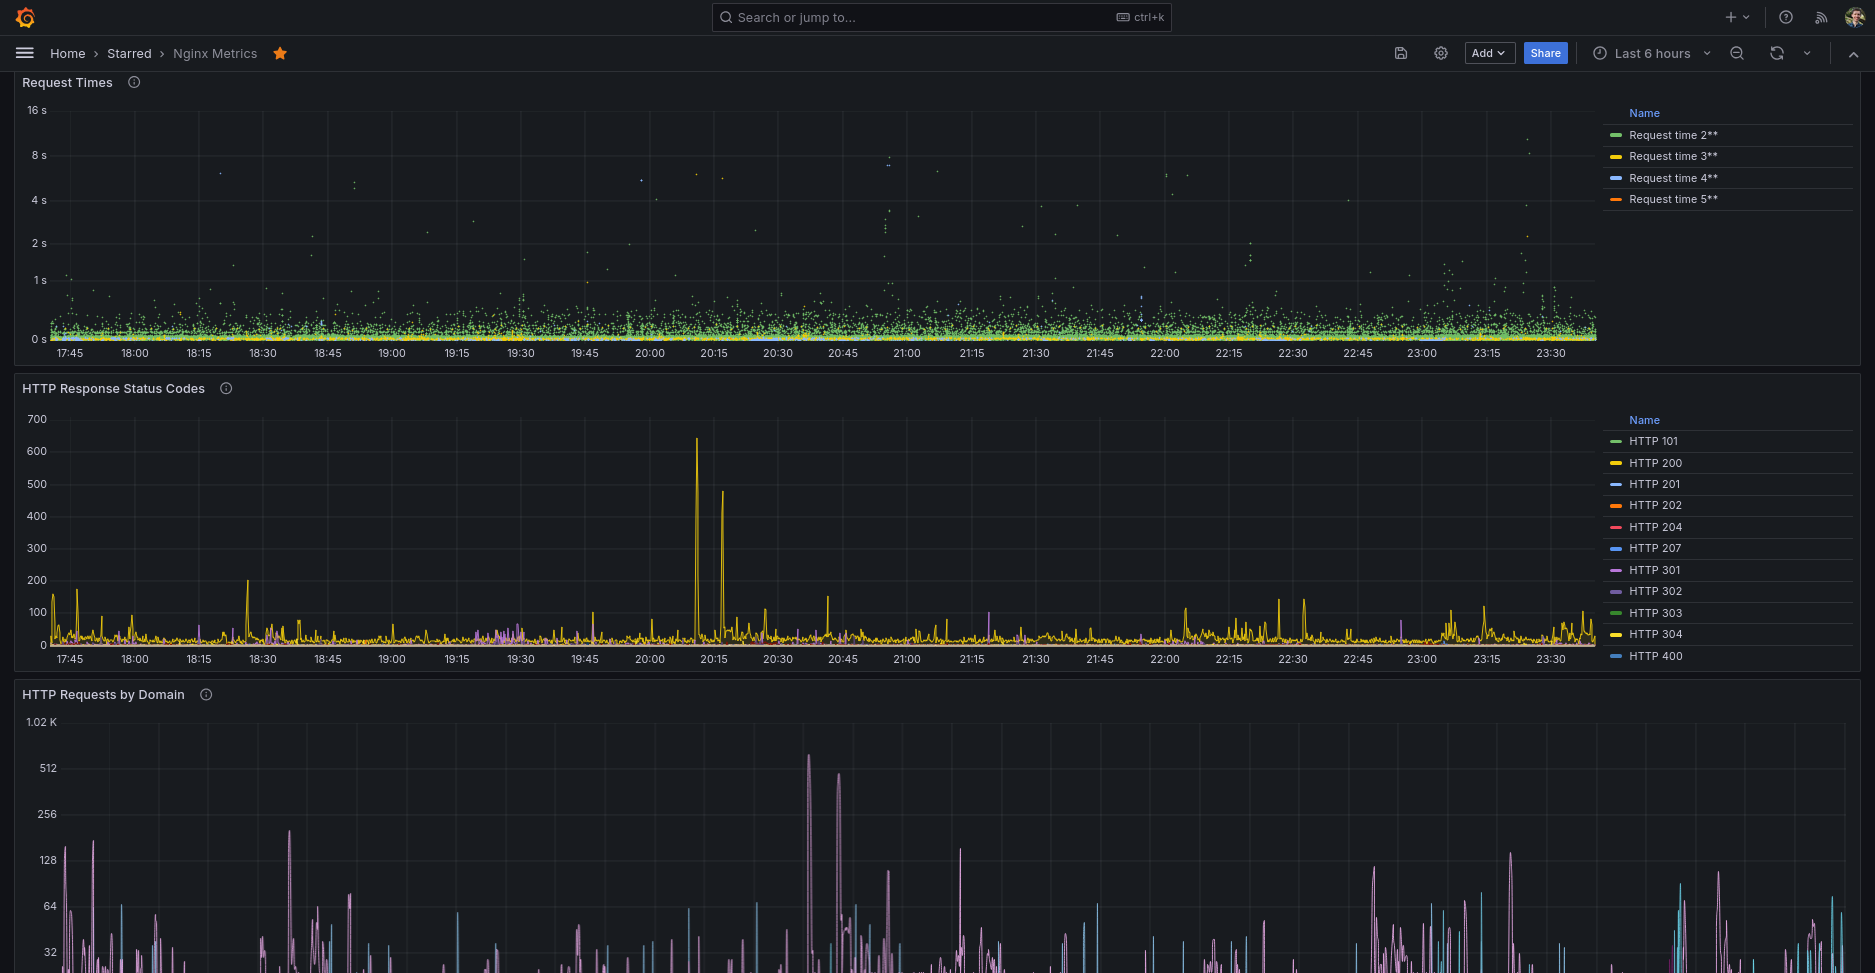
Nginx Metrics
Performance metrics for Nginx (or OpenResty).
Do not forget to enable server_status location configuration in your main server Nginx section. For example:
    location /server_status {
        # Turn on nginx stats
        stub_status on;
        access_log   off;
        # Security: Only allow access from the following IPs
        allow 127.0.0.1;
        allow 192.168.1.0/24;
        deny all;
    }
inputs.nginx plugin will use this data for gather the Nginx metrics.
And the inputs.tail plugin will be used together with grok parser to retrieve data from the Nginx access log.
If you wish to use Angie (fork of Nginx), please use my other dashboard: https://grafana.com/grafana/dashboards/24461-angie-metrics/
Data source config
Collector type:
Collector plugins:
Collector config:
Revisions
Upload an updated version of an exported dashboard.json file from Grafana
| Revision | Description | Created | |
|---|---|---|---|
| Download |
NGINX
Easily monitor NGINX, an open source software for web serving, reverse proxying, caching, load balancing, media streaming, and more, with Grafana Cloud's out-of-the-box monitoring solution.
Learn more