Kubernetes Overview
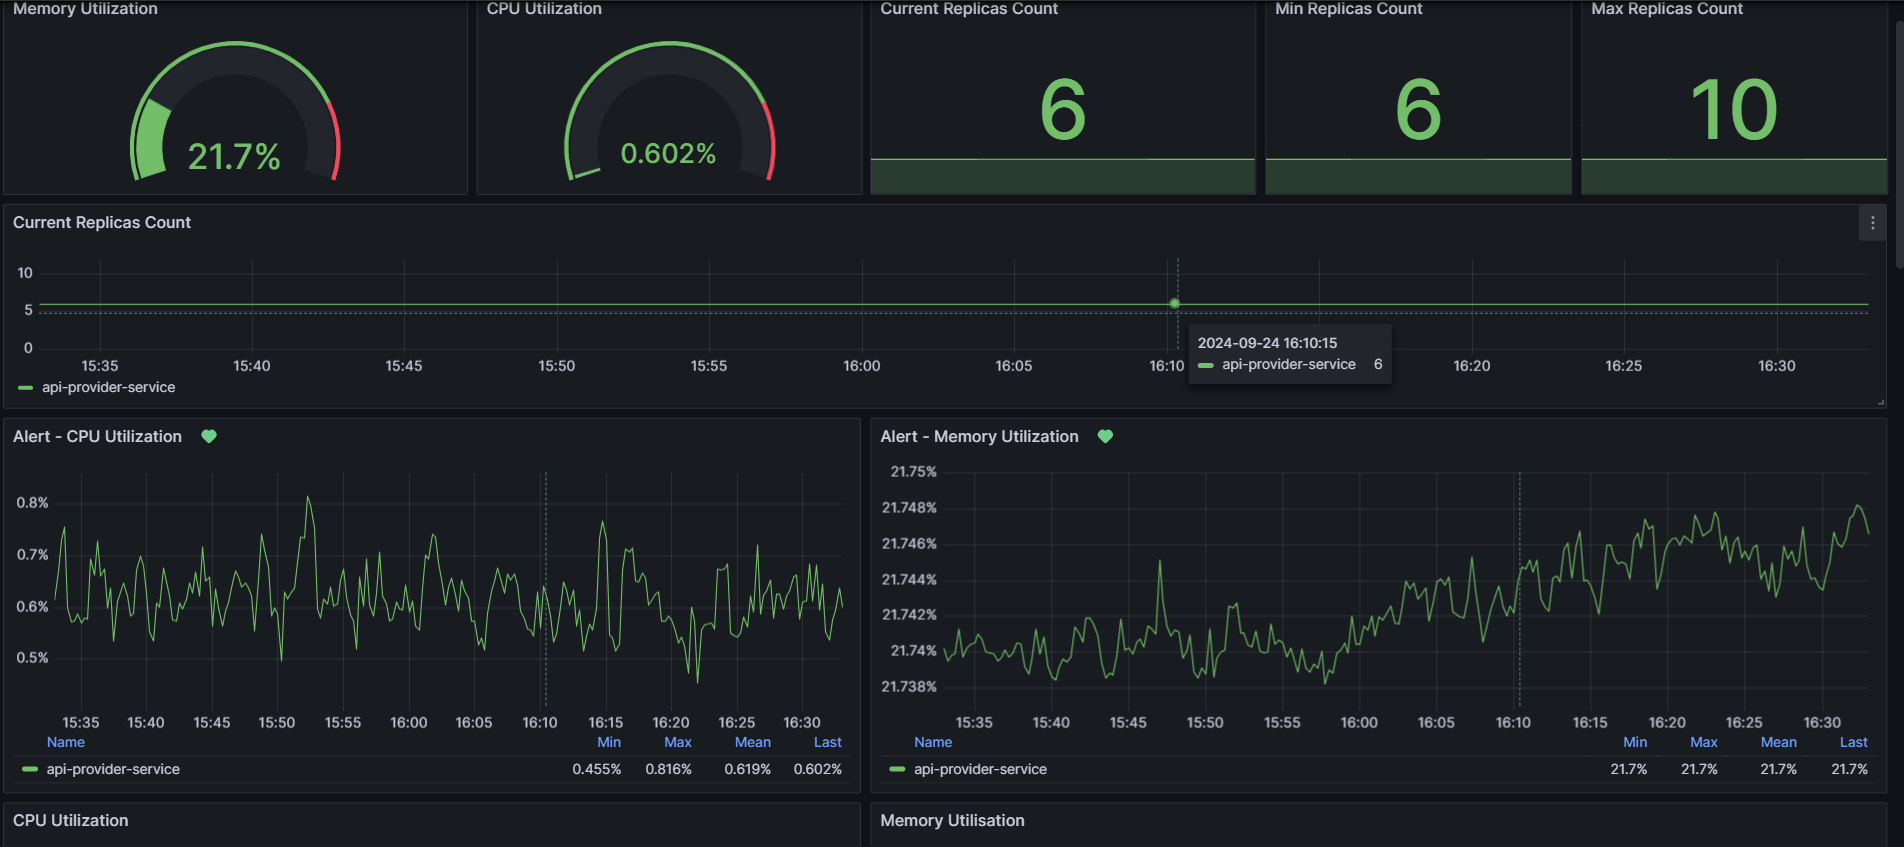
This comprehensive EKS (Kubernetes) dashboard provides a unified view of key metrics and performance indicators to monitor and observe your Kubernetes clusters effectively. Built with Prometheus as the primary datasource, the dashboard visualizes essential details like CPU and memory usage, network I/O, and replica status across all deployments. It integrates both Kube State Metrics and cAdvisor metrics to offer deep insights into cluster resource utilization, allowing you to track container-level and node-level consumption in real time. The dashboard’s pre-configured panels display important metrics such as CPU usage per deployment, memory consumption trends, and network traffic flow, making it easy to diagnose potential bottlenecks or resource imbalances. In addition to visualizing overall cluster health, the dashboard provides detailed statistics on individual pod performance, giving you the ability to identify underperforming deployments or overused resources. Advanced templating options allow dynamic filtering by nodes, deployments, and containers, enhancing the flexibility of your monitoring. The dashboard is ideal for DevOps teams and system administrators looking to ensure the high availability and efficiency of their Kubernetes environments. It enables proactive monitoring and helps in maintaining optimal resource allocation, reducing downtime, and improving response times to incidents. With automatic refresh intervals, live monitoring, and customizable alerts, this dashboard simplifies the process of managing and scaling EKS clusters, empowering teams to make data-driven decisions to improve system performance.
Data source config
Collector config:
Upload an updated version of an exported dashboard.json file from Grafana
| Revision | Description | Created | |
|---|---|---|---|
| Download |
Kubernetes
Monitor your Kubernetes deployment with prebuilt visualizations that allow you to drill down from a high-level cluster overview to pod-specific details in minutes.
Learn more