Website Monitoring Reports
Overview: This Grafana dashboard is designed to monitor the performance and availability of various websites, providing insights into their uptime, response times, and SSL certificate expiration dates. The dashboard is useful for web administrators, DevOps teams, and anyone interested in the health and performance of these websites.
Key Components:
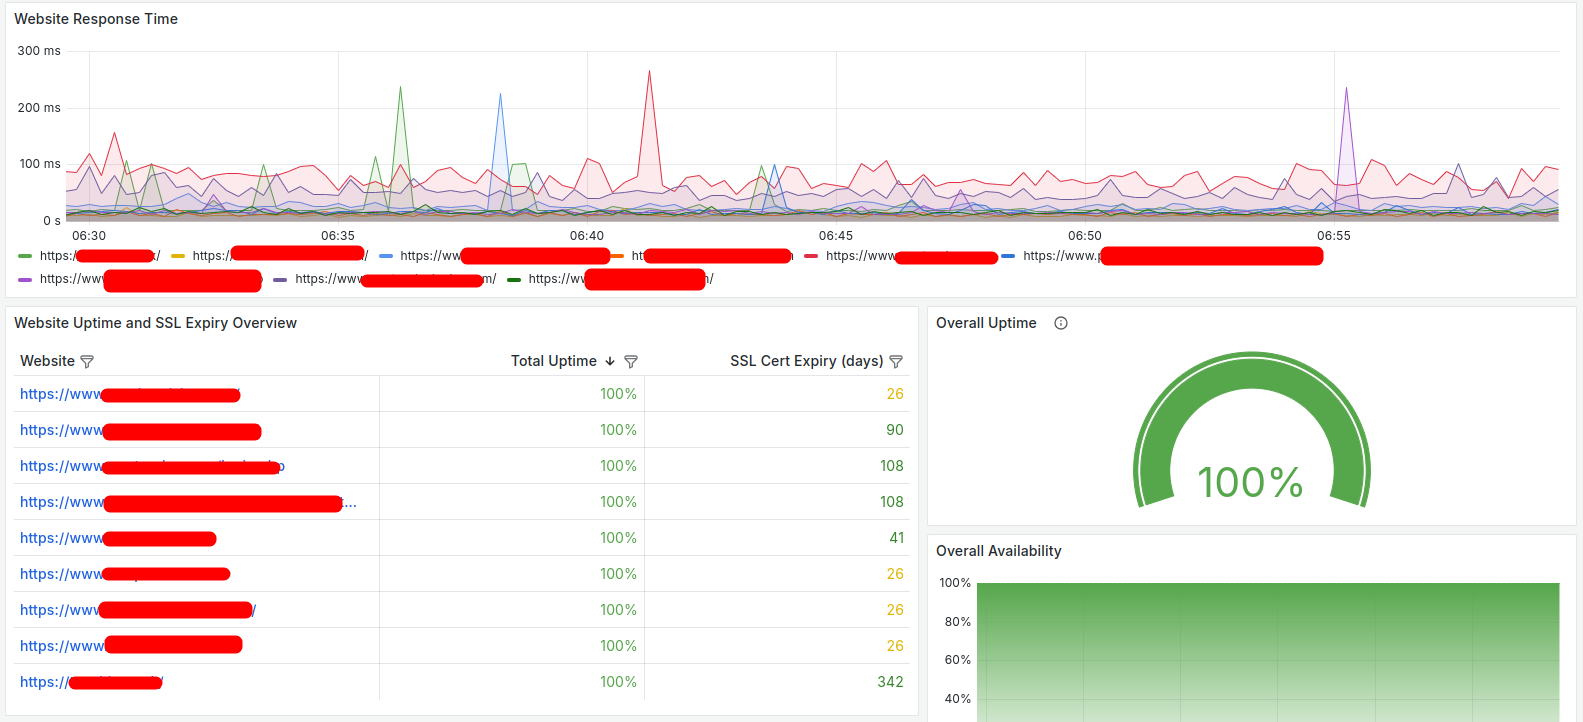
- Website Response Time
This section displays the mean, minimum, and maximum response times for each listed website. The data helps in understanding the performance of each website over time.
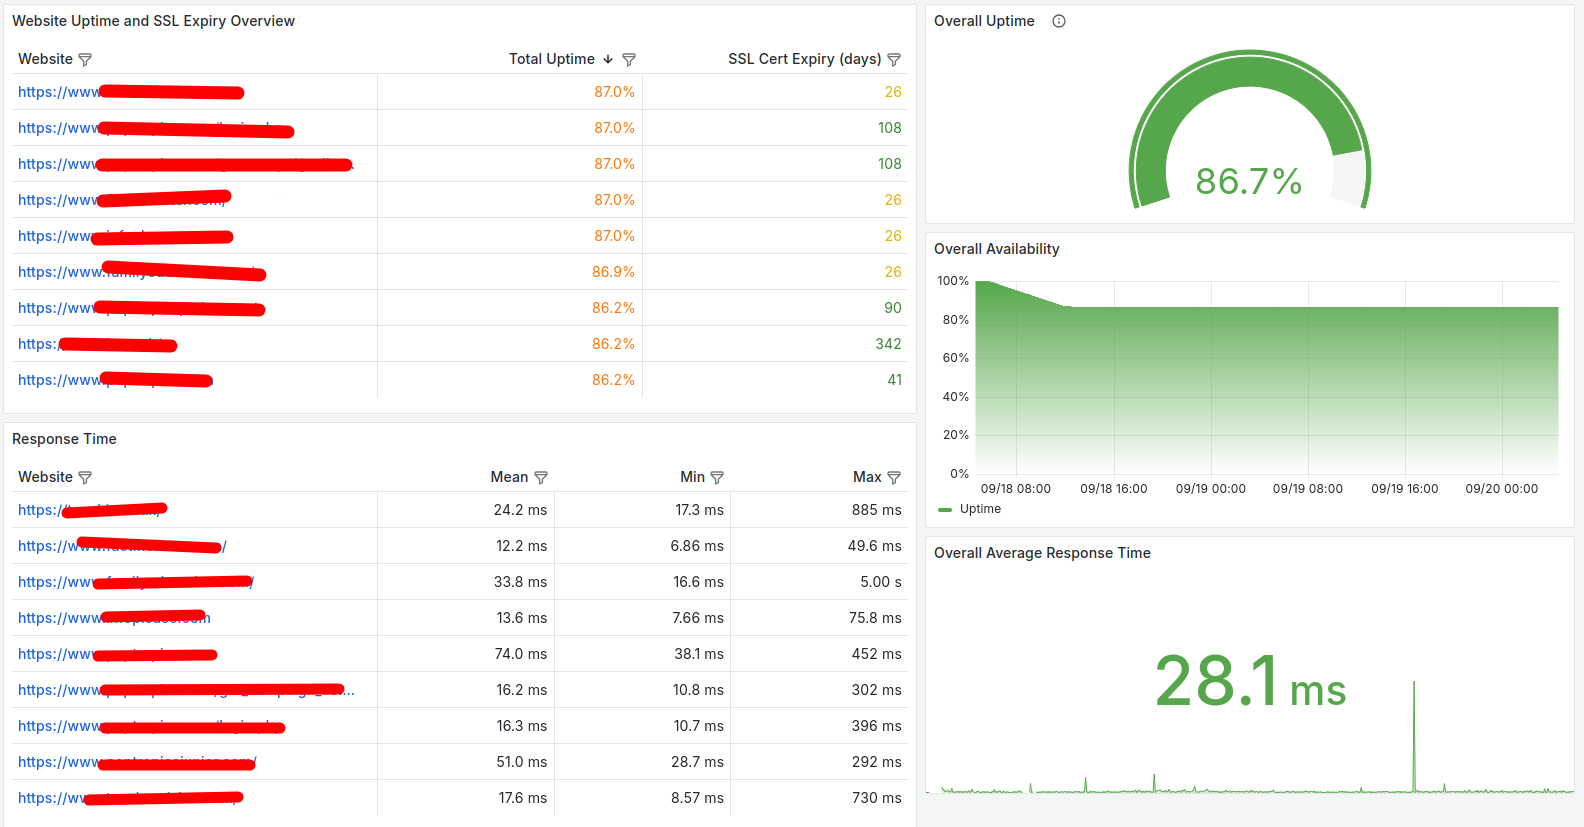
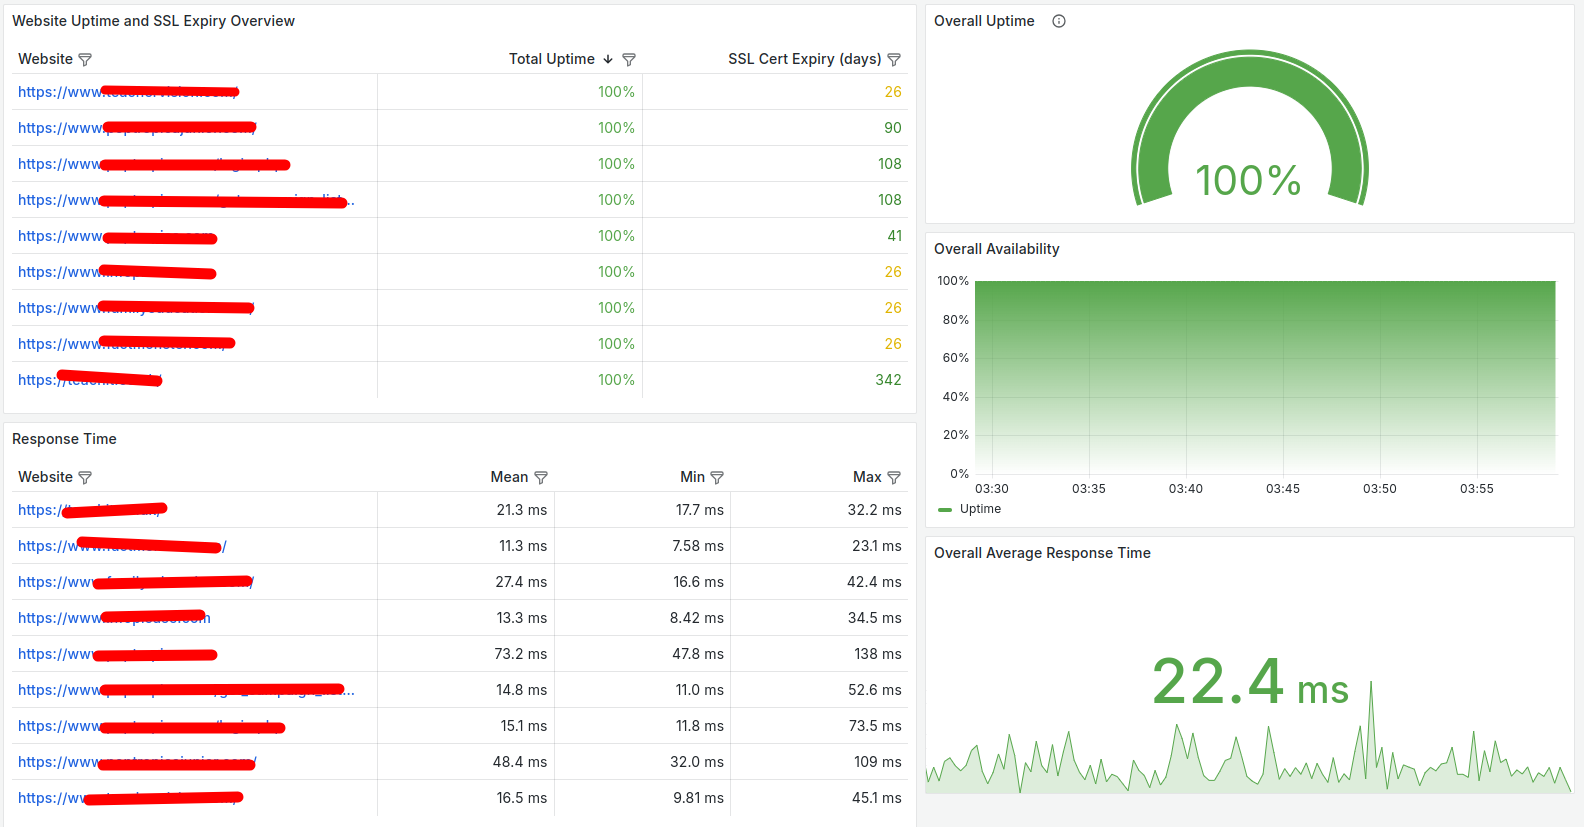
- Website Uptime and SSL Expiry Overview -
This section provides an overview of the uptime percentage and SSL certificate expiration dates for each website.
Uptime Percentages: Each website's uptime percentage is displayed, along with the number of days until the SSL certificate expires.
Overall Uptime and Availability: The dashboard also shows the overall uptime and availability of all monitored websites.
- Overall Metrics
Overall Average Response Time: The average response time for all monitored websites is calculated and displayed.
Overall Uptime: The aggregate uptime percentage of all websites is shown.
This dashboard is particularly useful for:
-Monitoring Website Performance: It helps in identifying slow or unresponsive websites and trending performance over time.
-Ensuring Uptime: The dashboard ensures that websites are up and running, providing critical insights into their availability.
-SSL Certificate Management: It alerts administrators to upcoming SSL certificate expirations, preventing potential security issues.
Data source config
Collector config:
Upload an updated version of an exported dashboard.json file from Grafana
| Revision | Description | Created | |
|---|---|---|---|
| Download |