Pino HTTP Logs
Pino Logging Dashboard
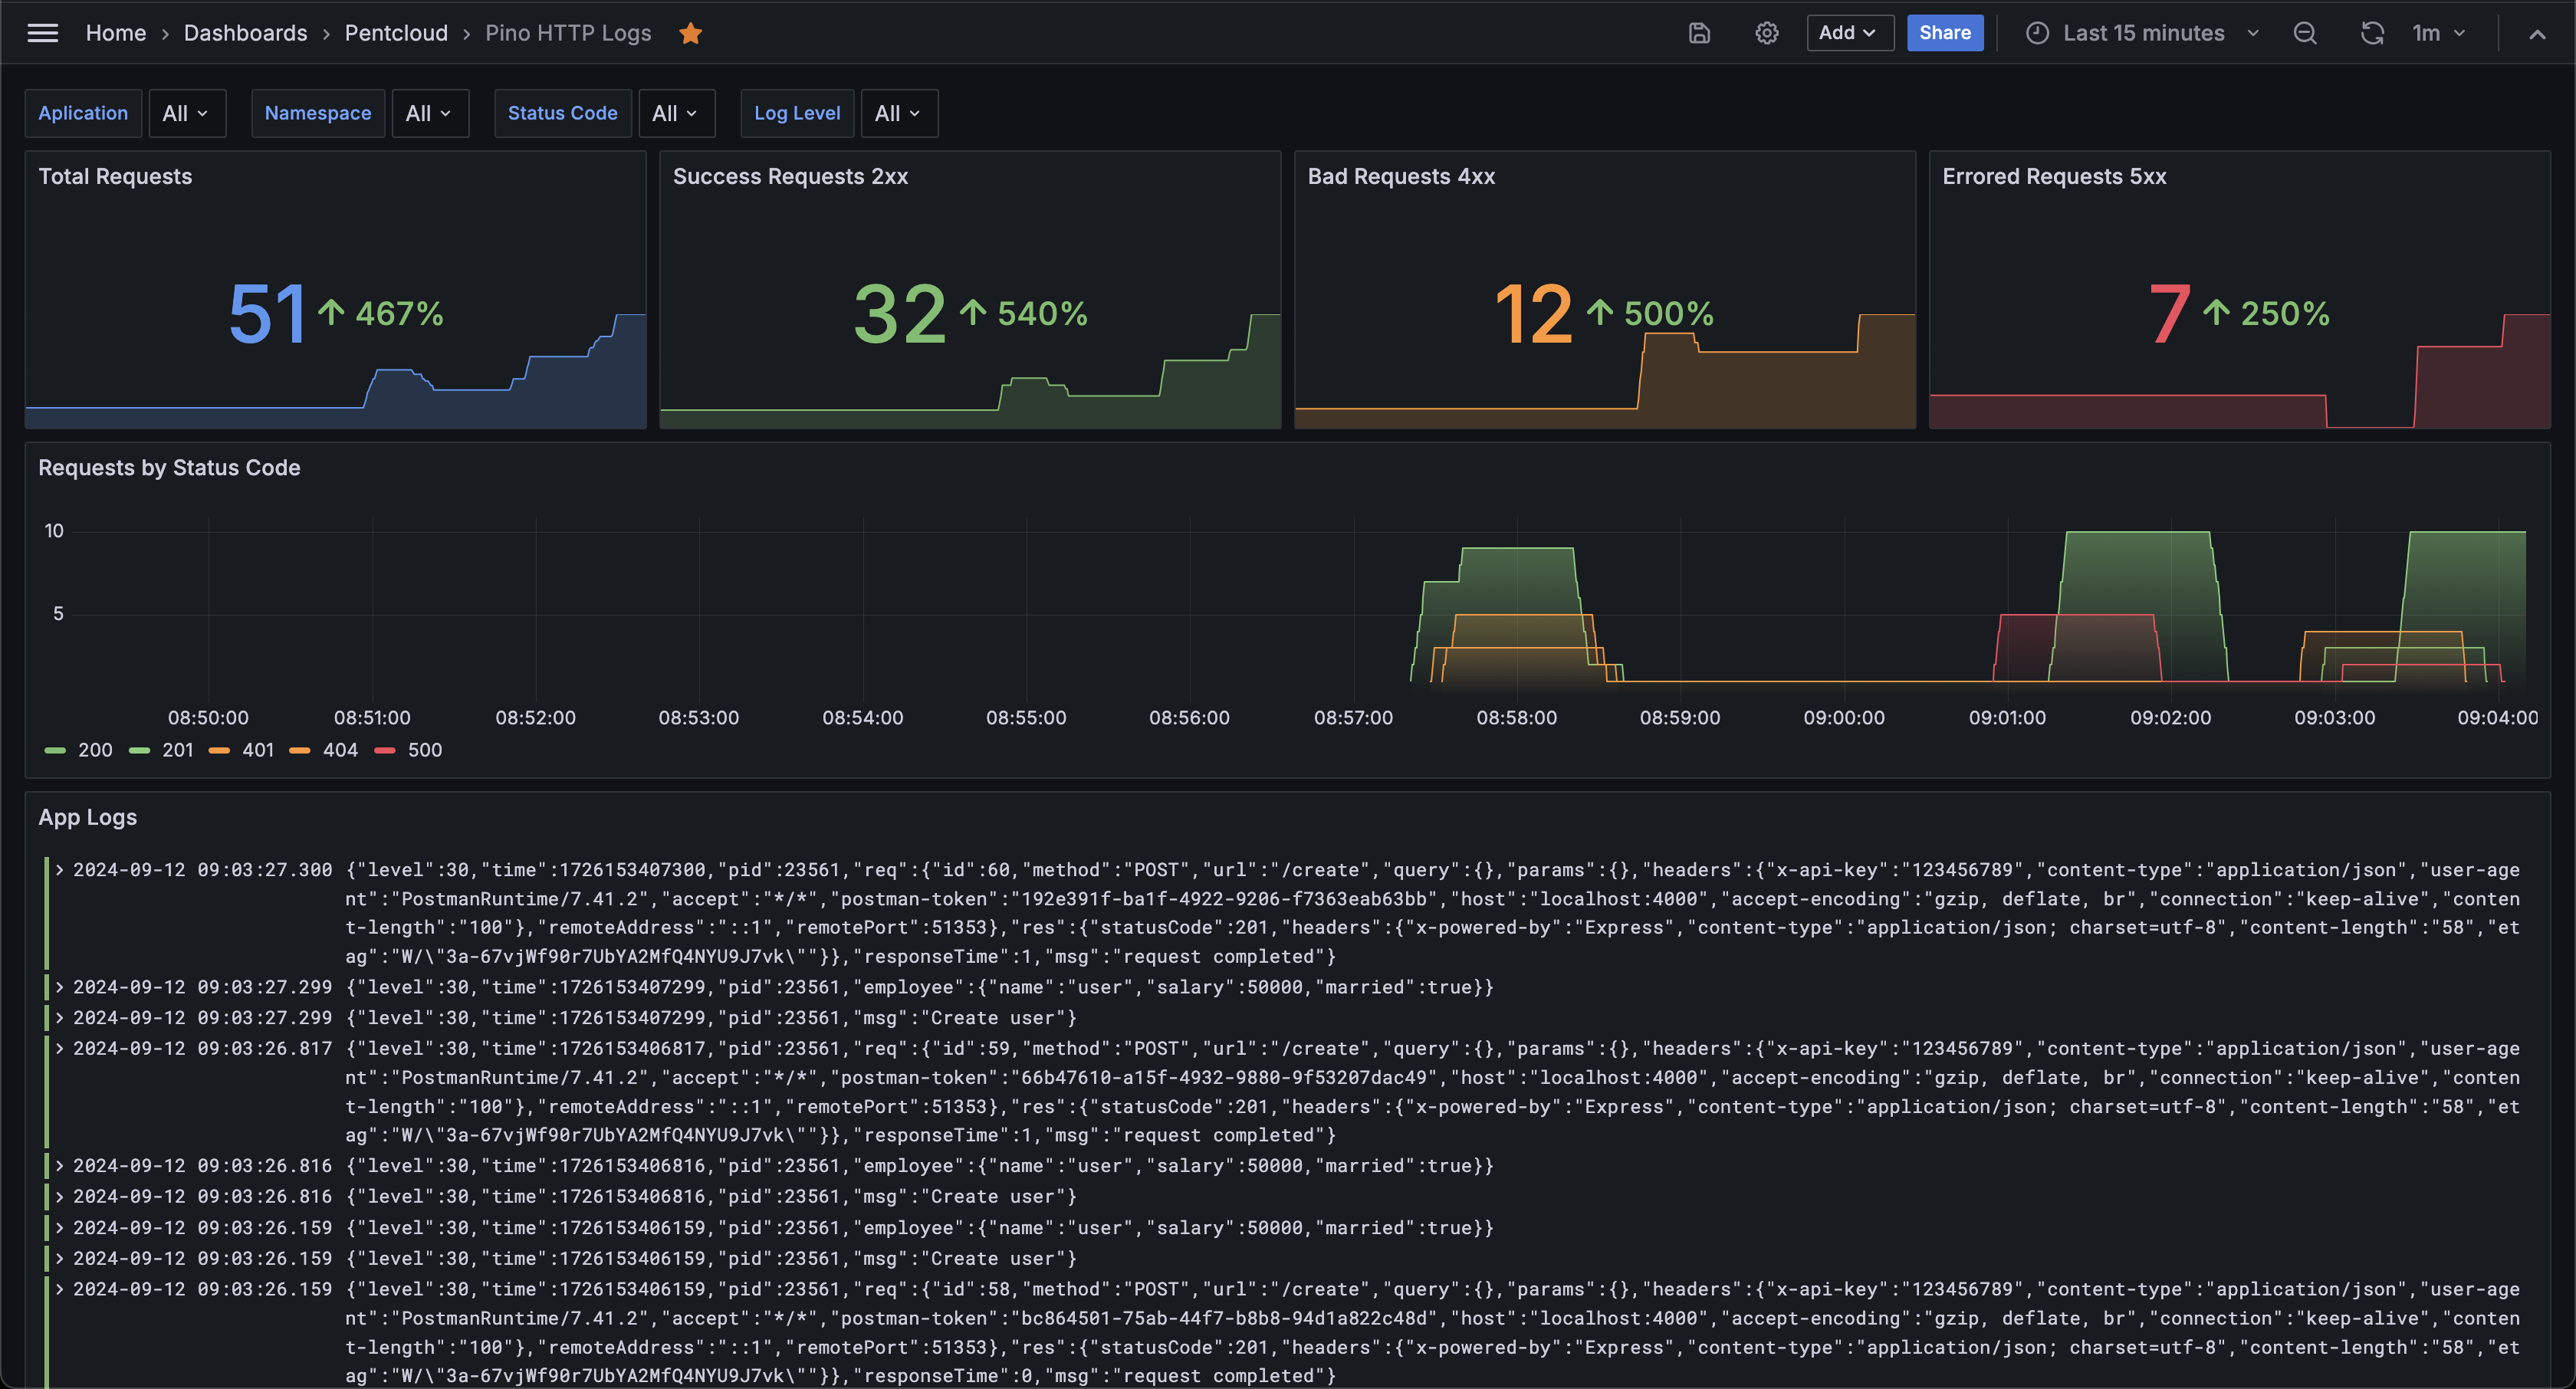
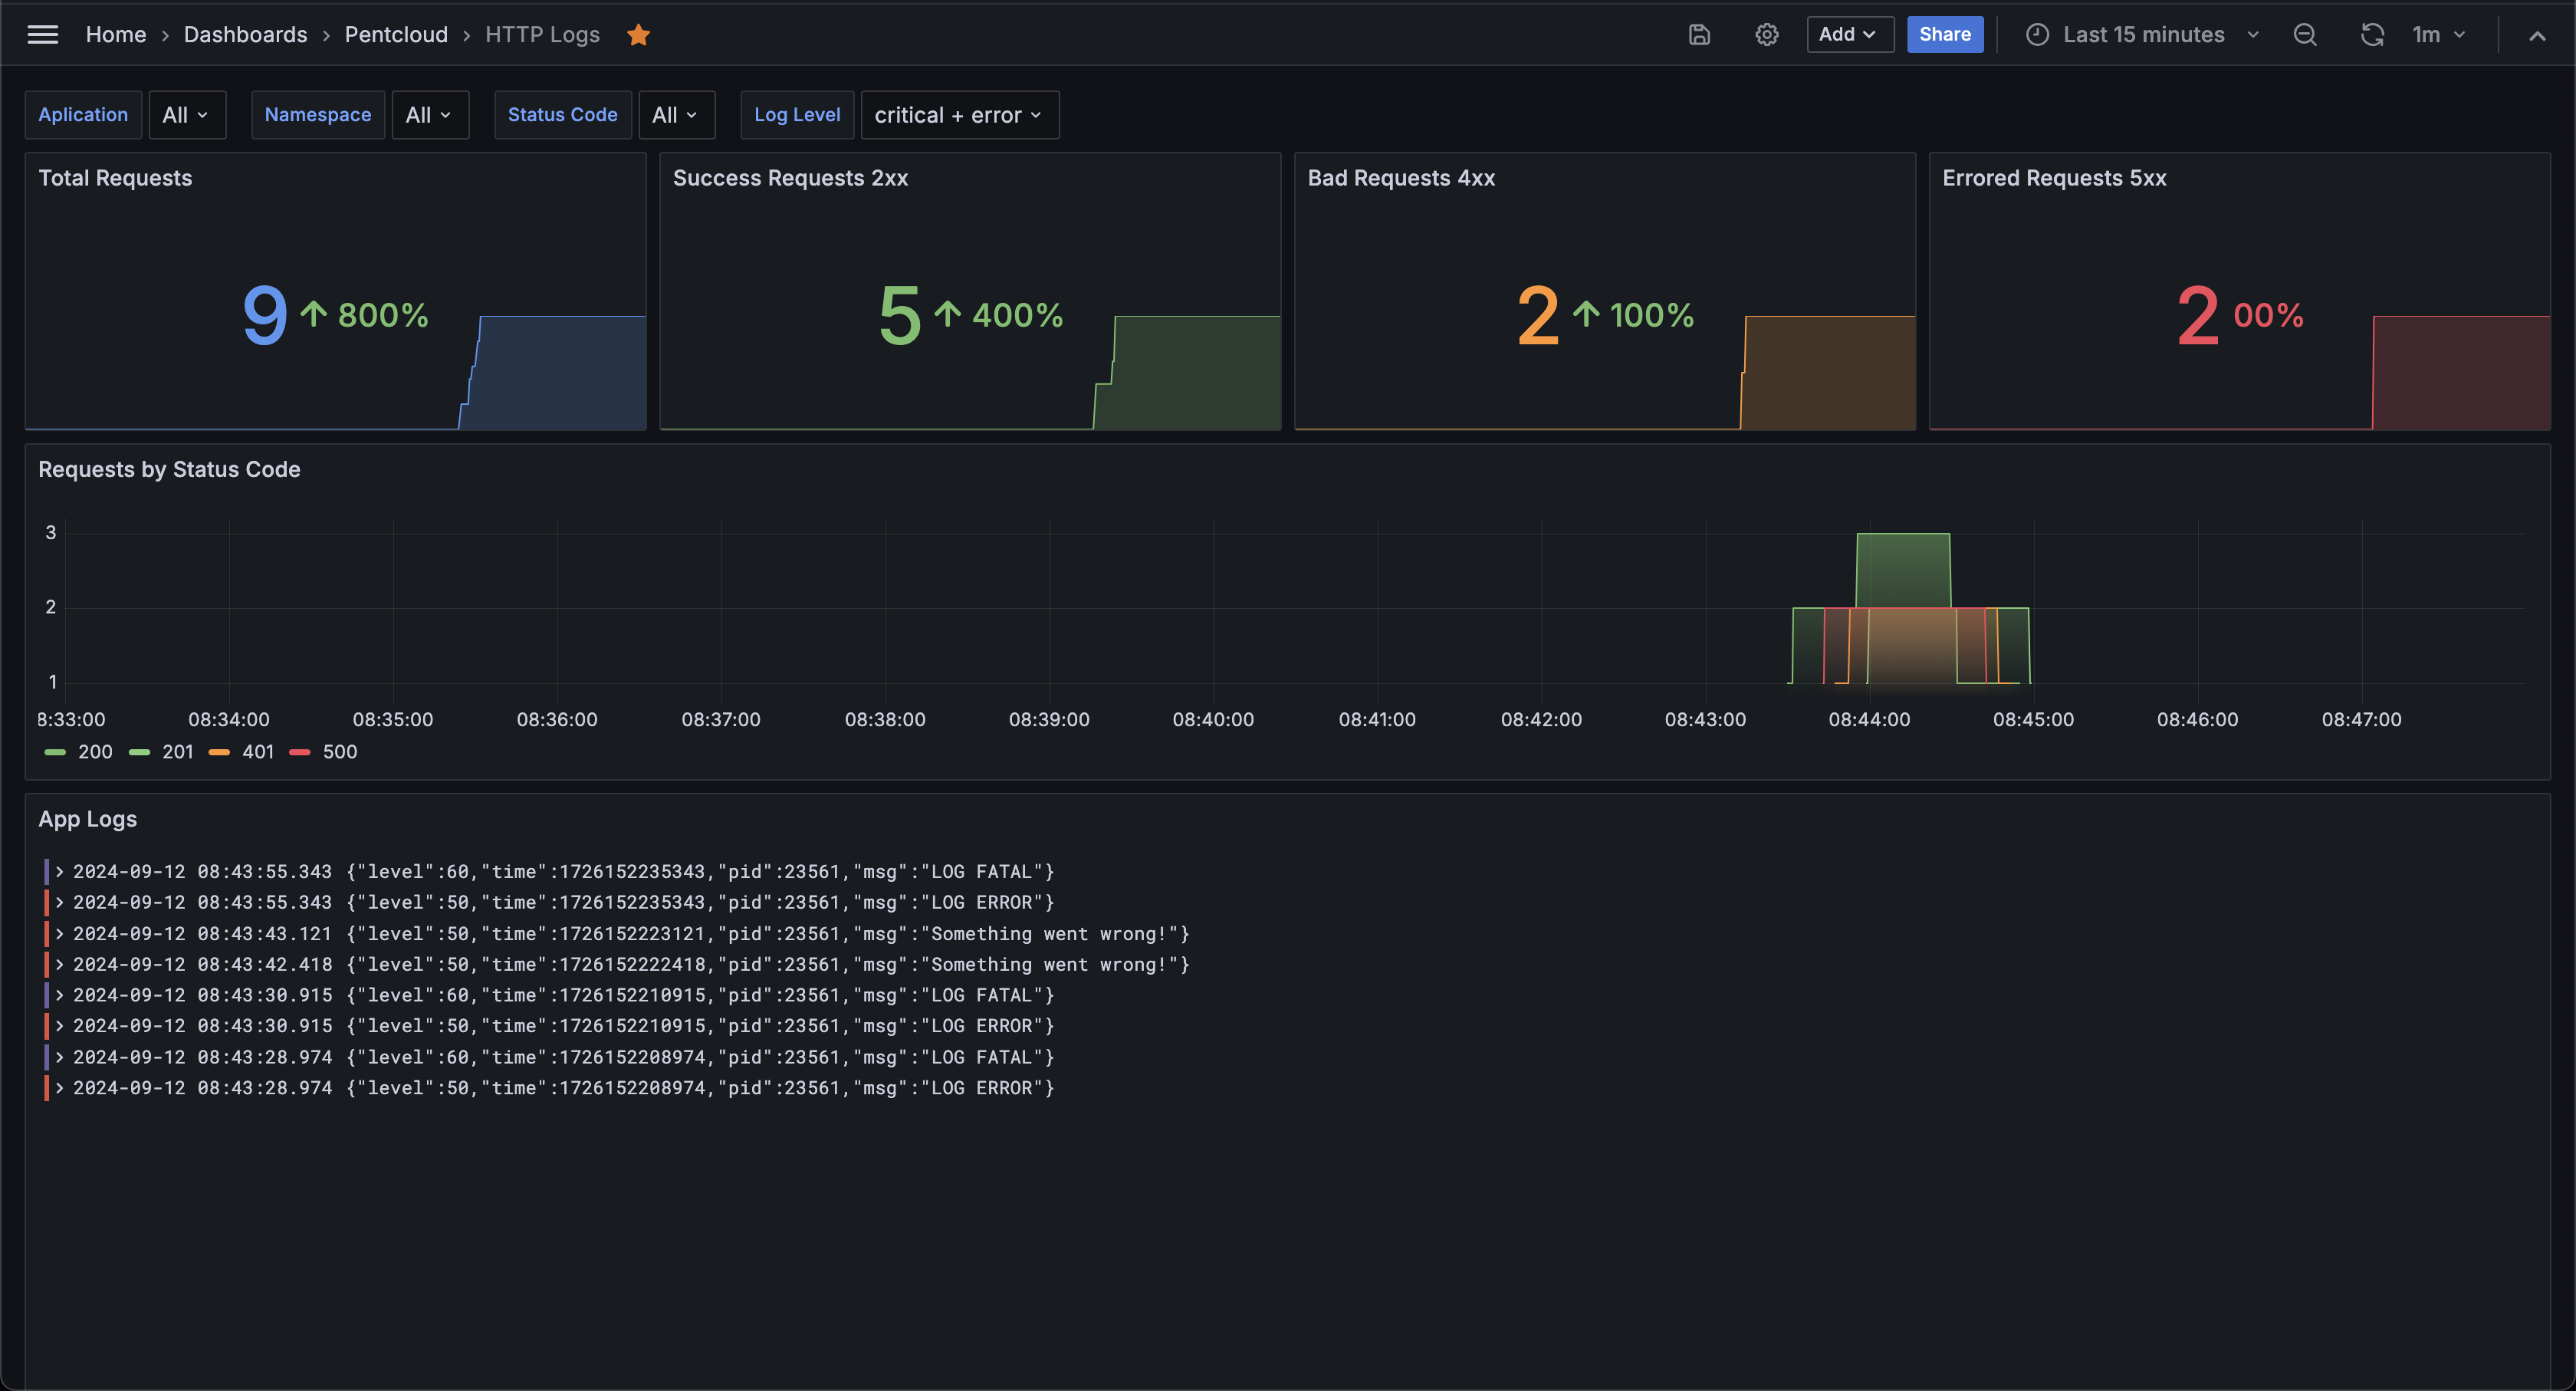
This Grafana dashboard utilizes the Loki data source to visualize and analyze logs generated by the Pino logging library. Logs from HTTP requests are captured using the Pino-HTTP plugin and are sent to a Loki instance via the Pino-Loki plugin, enabling real-time monitoring and historical analysis. The dashboard includes graph and table panels to display key metrics such as request status codes, response times, and error rates, making it easy to track application behavior and identify performance issues.
Flow Overview:
- Pino: Captures structured logs in a JSON format.
- Pino-HTTP: Specifically designed to handle HTTP request/response logging, capturing details such as request method, URL, and status code.
- Pino-Loki: Transmits the structured logs to a Loki instance, which acts as the centralized log storage and query engine.
For a detailed setup guide of how to configure Pino, Pino-HTTP, and Pino-Loki, visit:
https://gist.github.com/diegofcornejo/7b94a0f384f916e58a44e7618e6e57e2
Data source config
Collector config:
Upload an updated version of an exported dashboard.json file from Grafana
| Revision | Description | Created | |
|---|---|---|---|
| Download |
Apache HTTP Server
Easily monitor Apache HTTP Server, an open source HTTP server for modern operating systems including UNIX and Windows, with Grafana Cloud's out-of-the-box monitoring solution.
Learn more