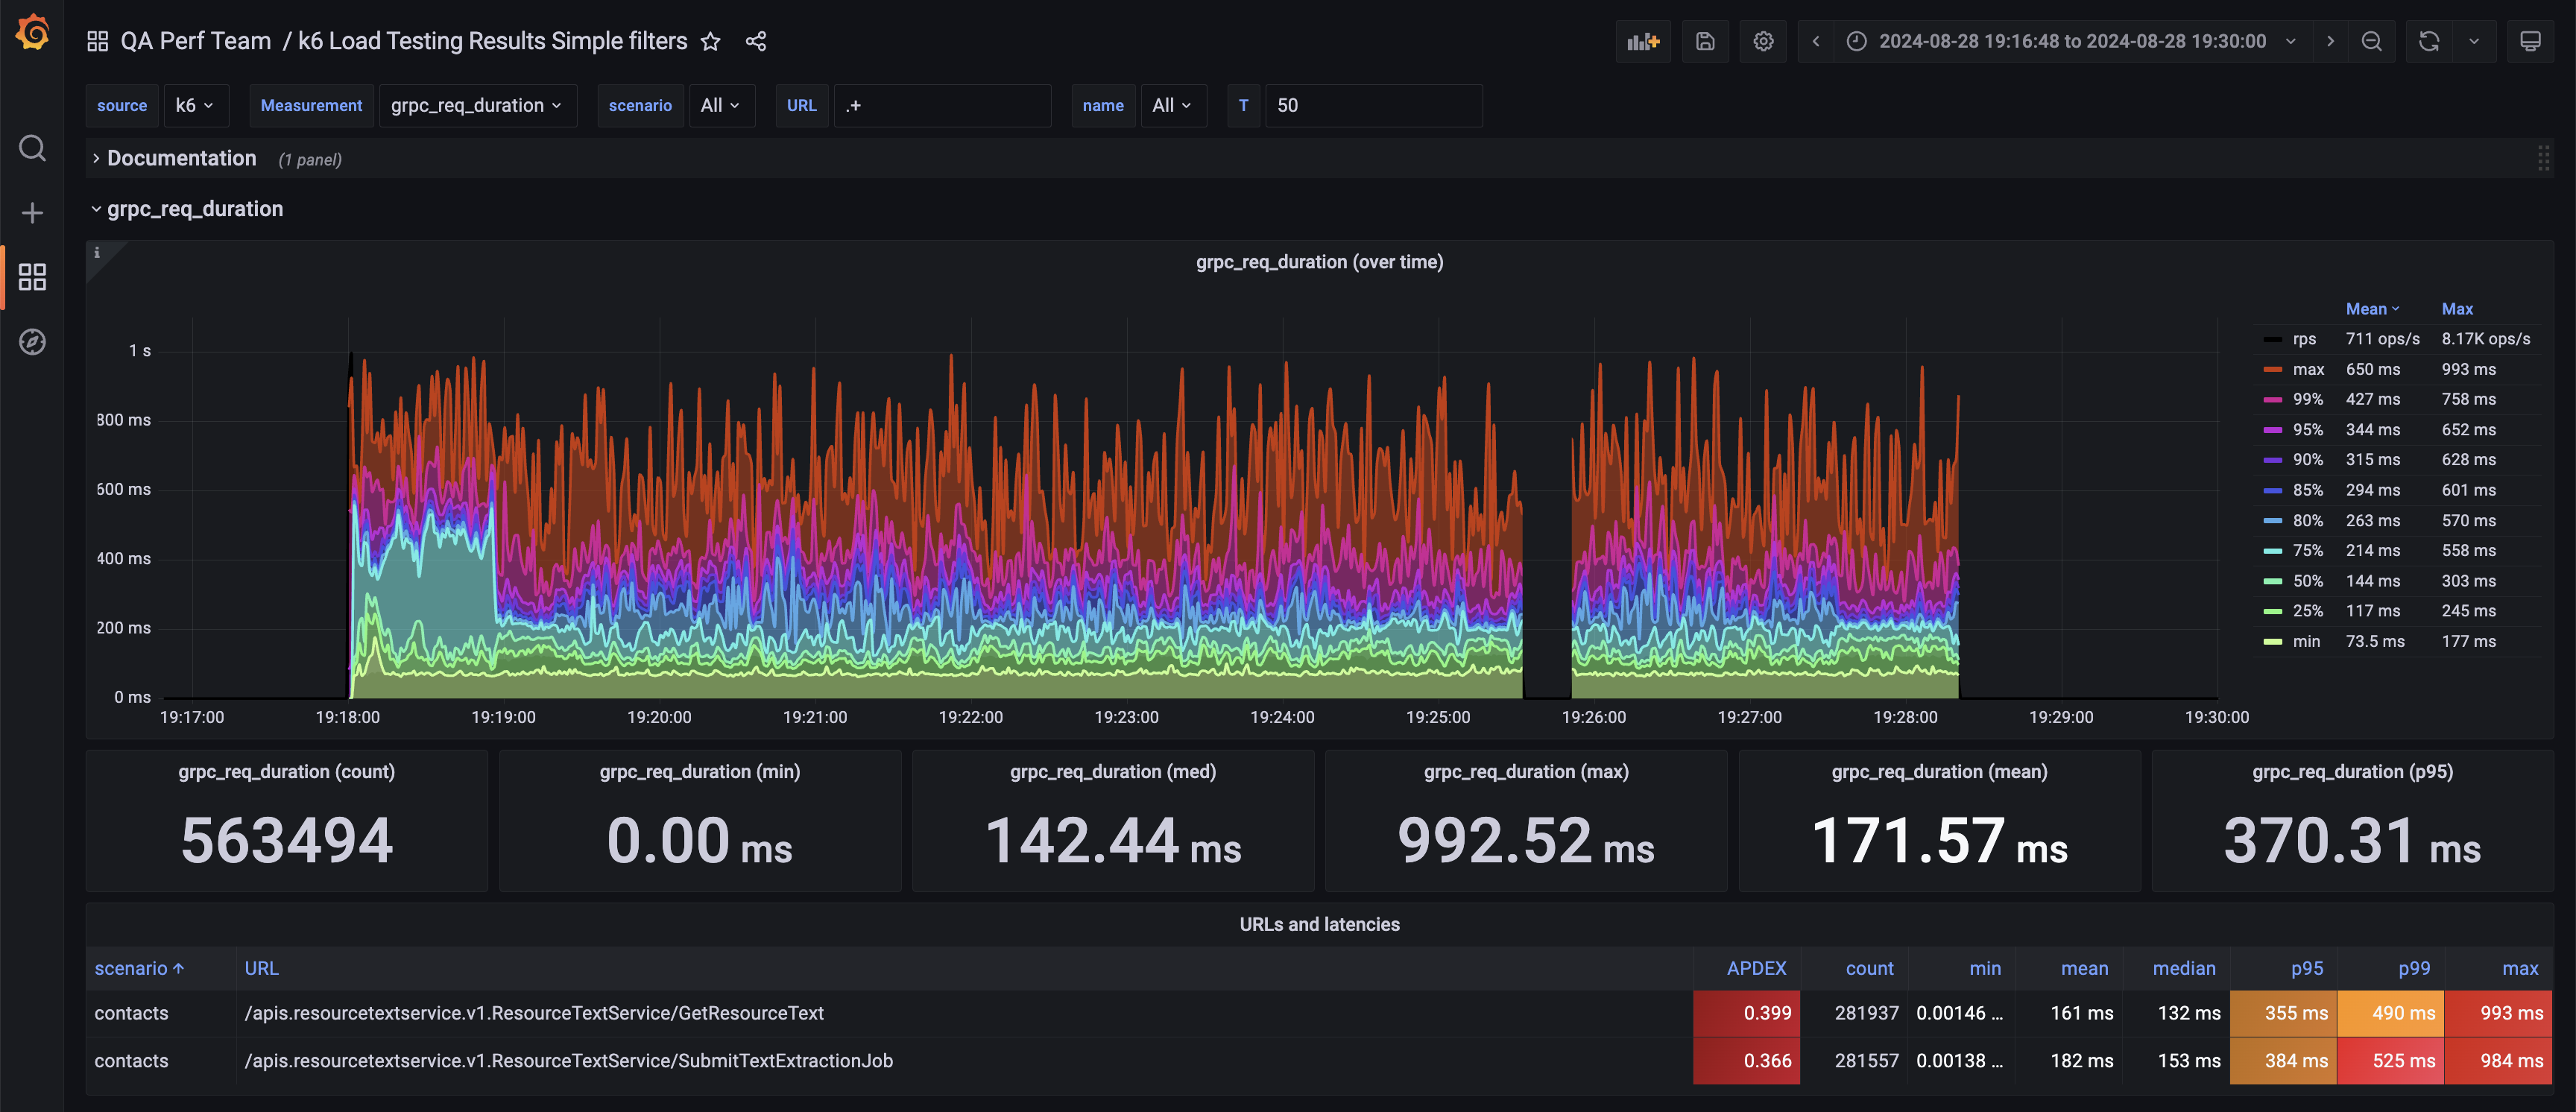
k6 Load Testing Results Simple filters
A dashboard for visualizing results from the k6.io load testing tool, using the InfluxDB exporter. It supports http, ws, grpc, ... metrics
export K6_INFLUXDB_USERNAME=login
export K6_INFLUXDB_PASSWORD=password
export K6_INFLUXDB_PUSH_INTERVAL=3s

export K6_SUMMARY_EXPORT=summary.json

export K6_NO_USAGE_REPORT=true

k6 run --out influxdb=http://influxdb:8086/k6 ./scenario.js
It supports http, ws, grpc, kafka, ... metrics.
You feel free to add any of them in one variable. It has APDEX as well
Based on https://grafana.com/dashboards/4411
Data source config
Collector type:
Collector plugins:
Collector config:
Revisions
Upload an updated version of an exported dashboard.json file from Grafana
| Revision | Description | Created | |
|---|---|---|---|
| Download |