jmeter-dashboard-influxdb
Dashboard for Jmeter using Backend listener and InfluxDB.
Dashboard for Jmeter using Backend listener and InfluxDB.
Detailed information on GitHub.
A similar dashboard for VictoriaMetrics is jmeter-dashboard-victoriametrics.
The dashboard contains:
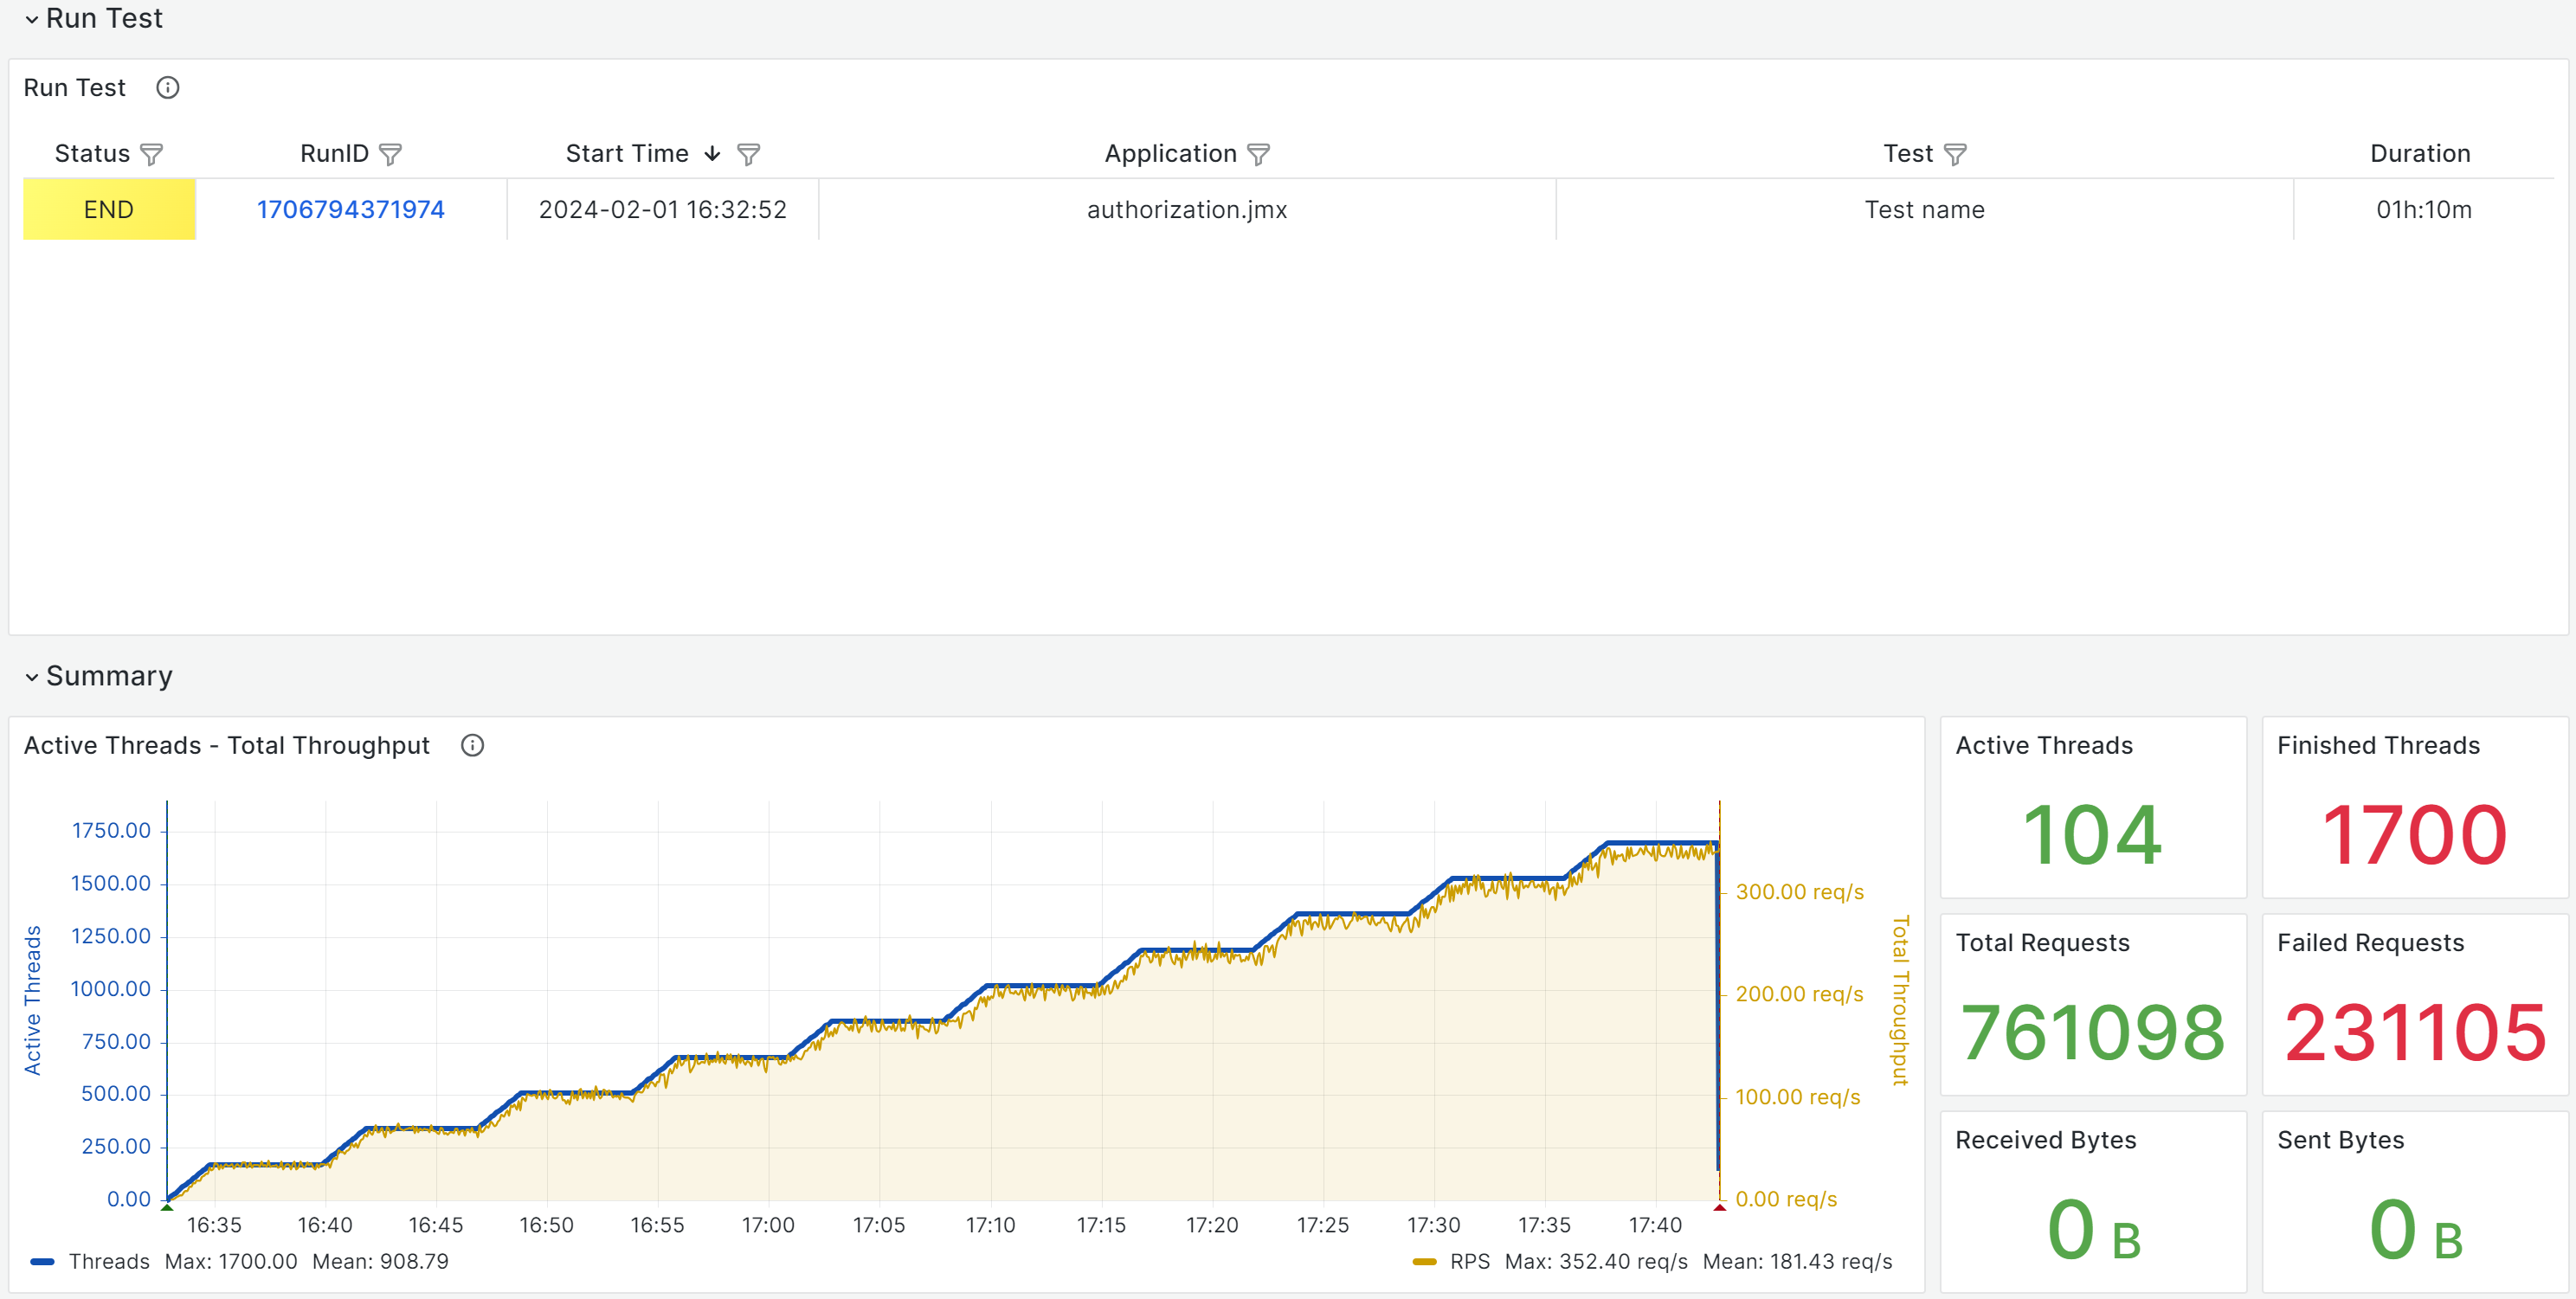
- Run Test - status of running / completed tests
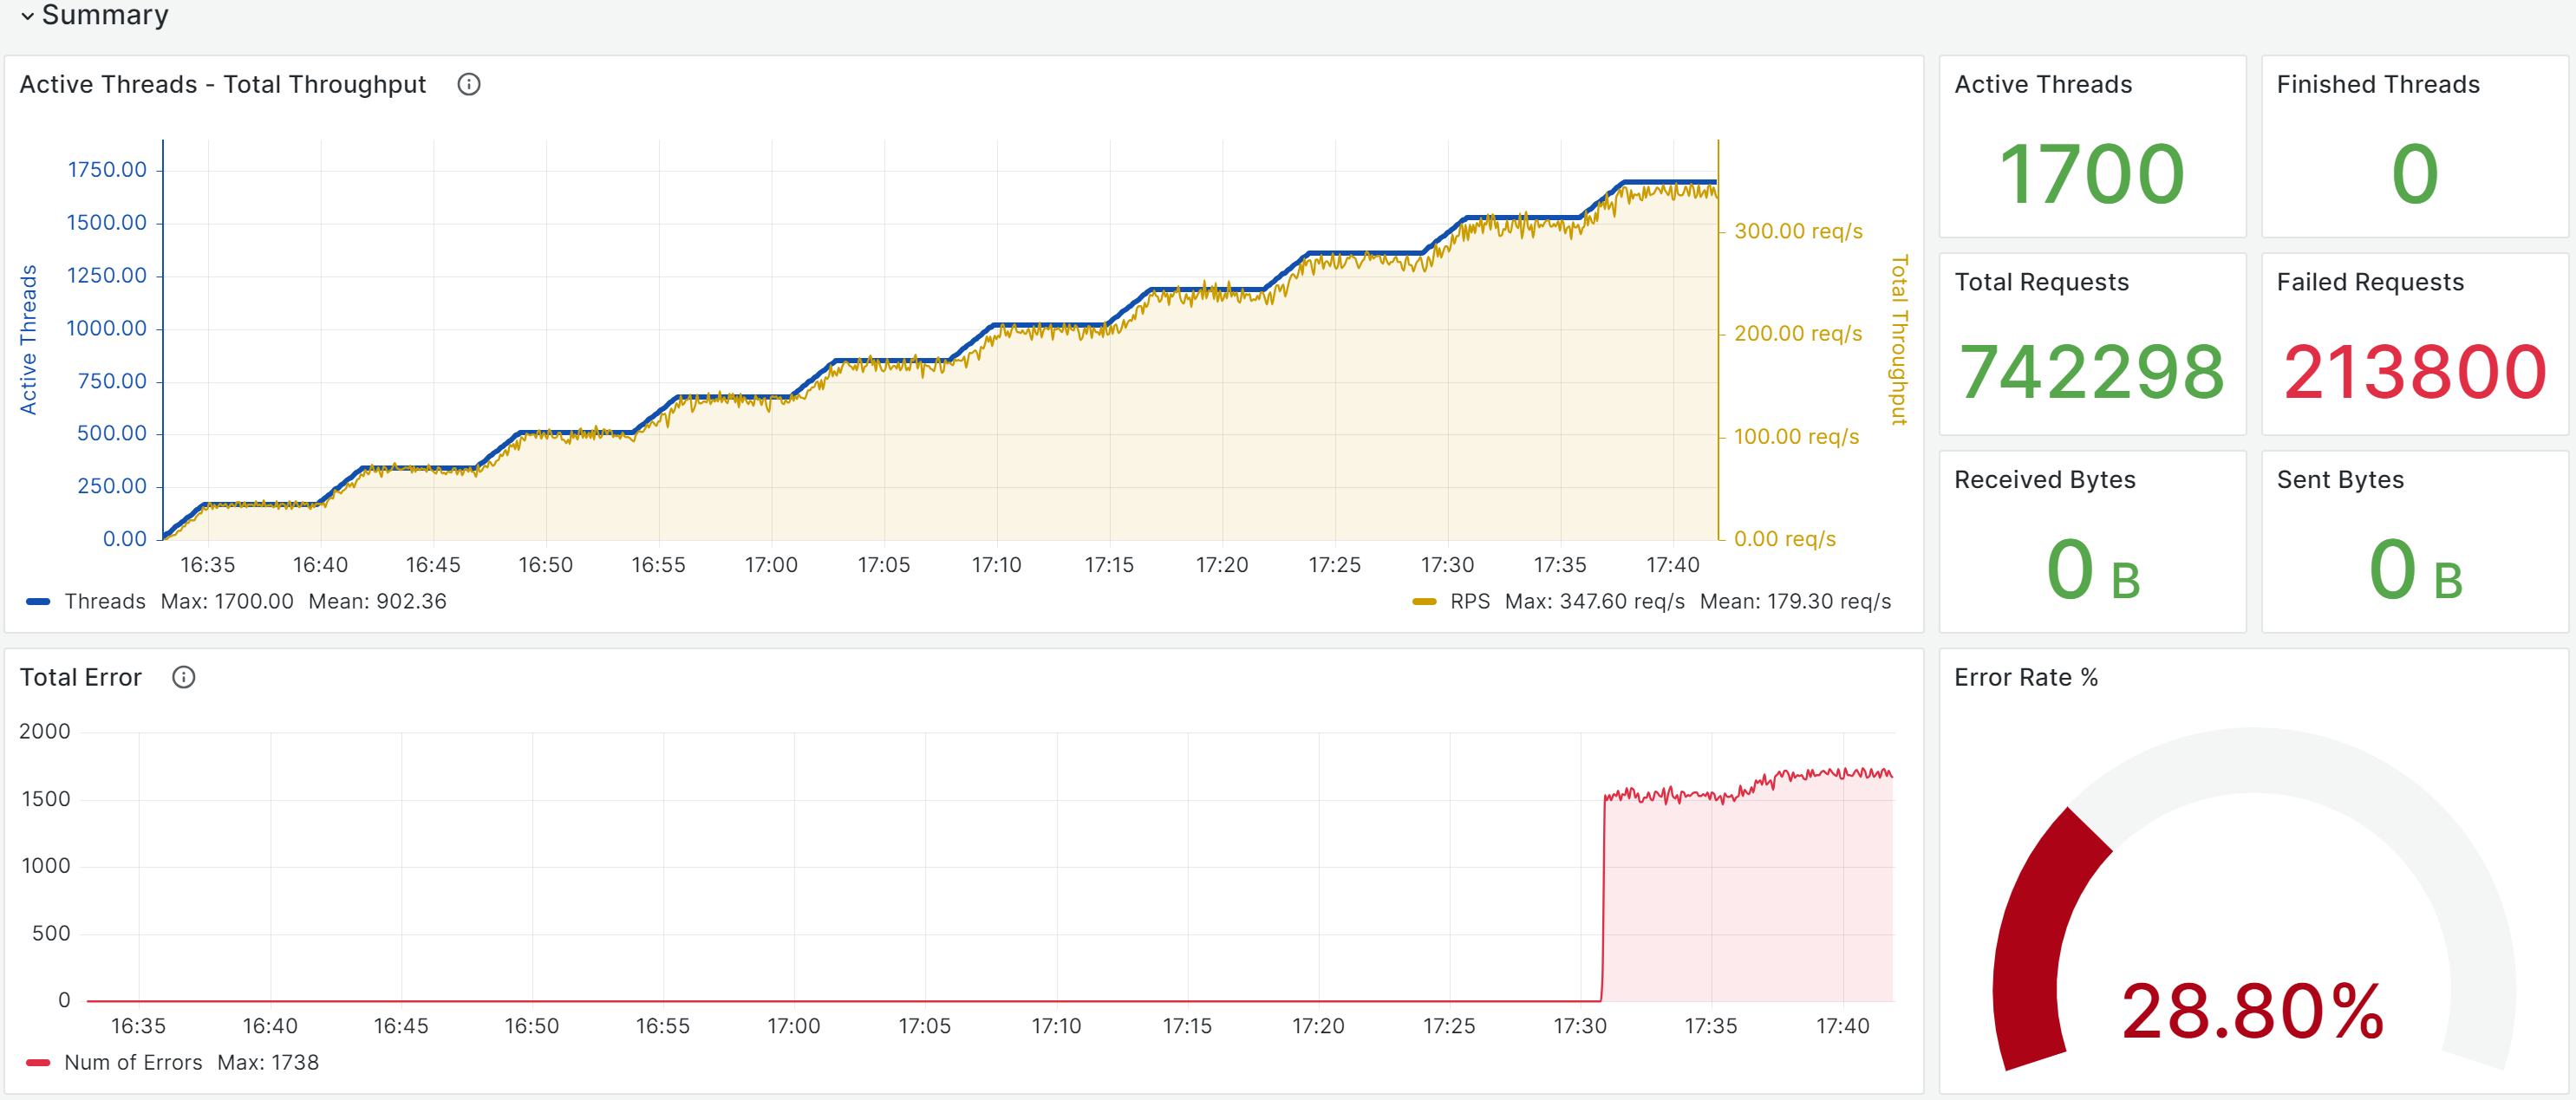
- Summary - basic information for analysis
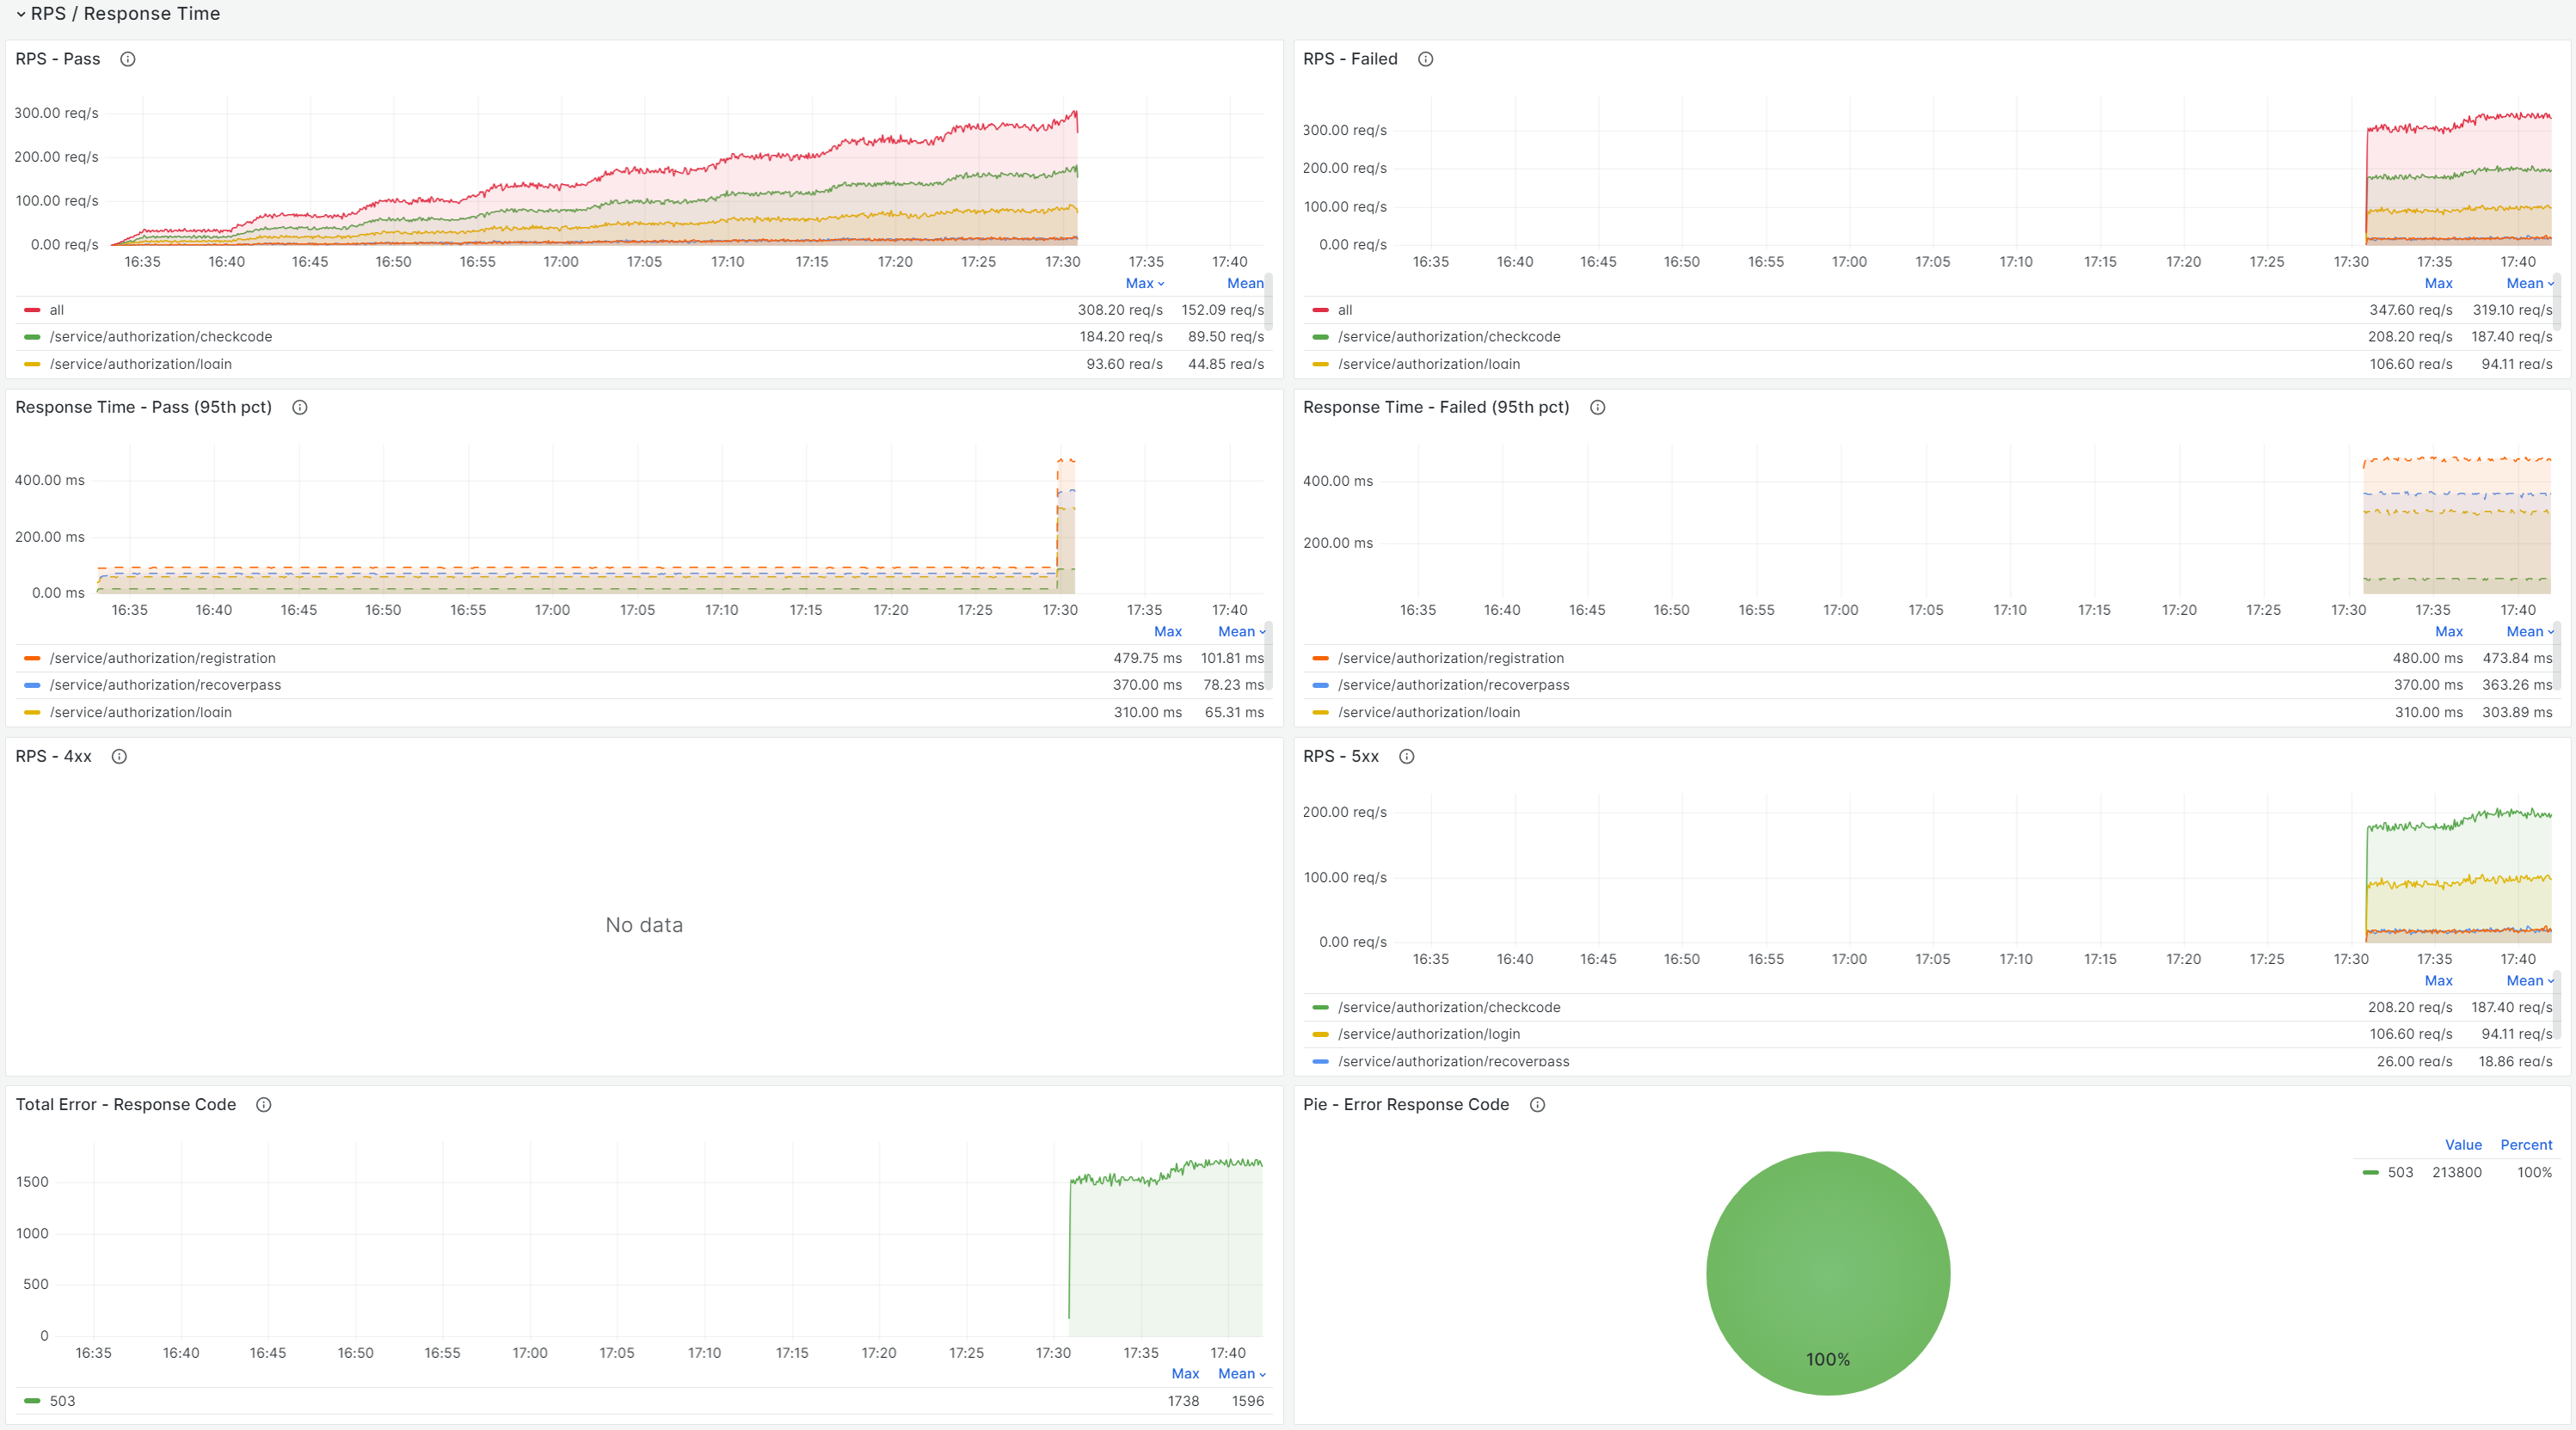
- RPS / Response Times - successful and unsuccessful requests, response times
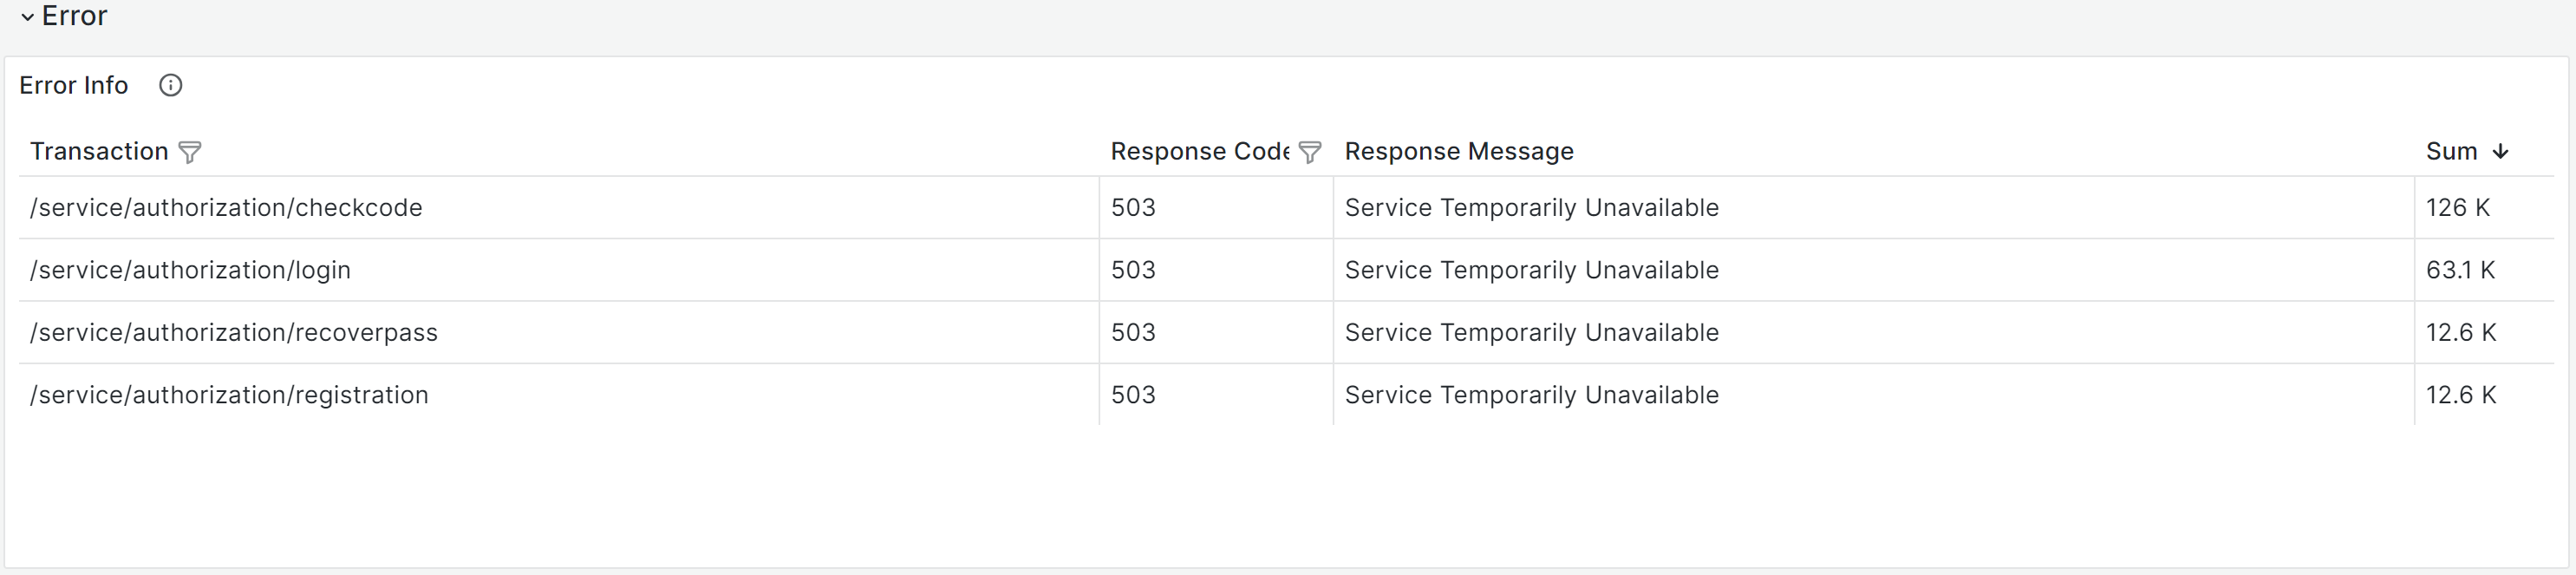
- Error - error information
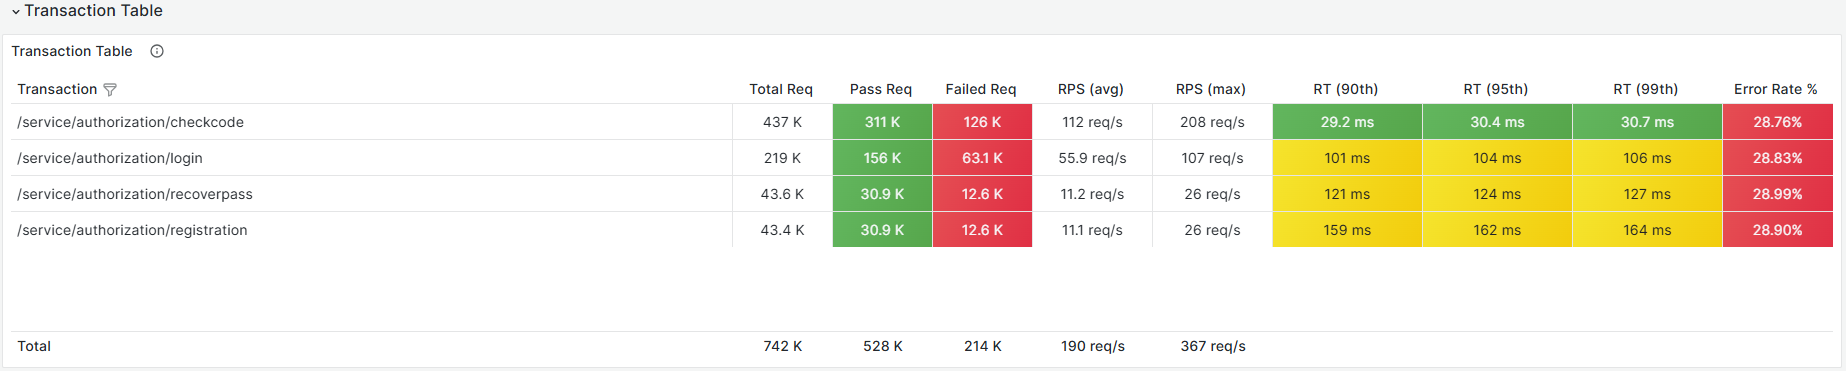
- Transaction Table - request / transaction statistics
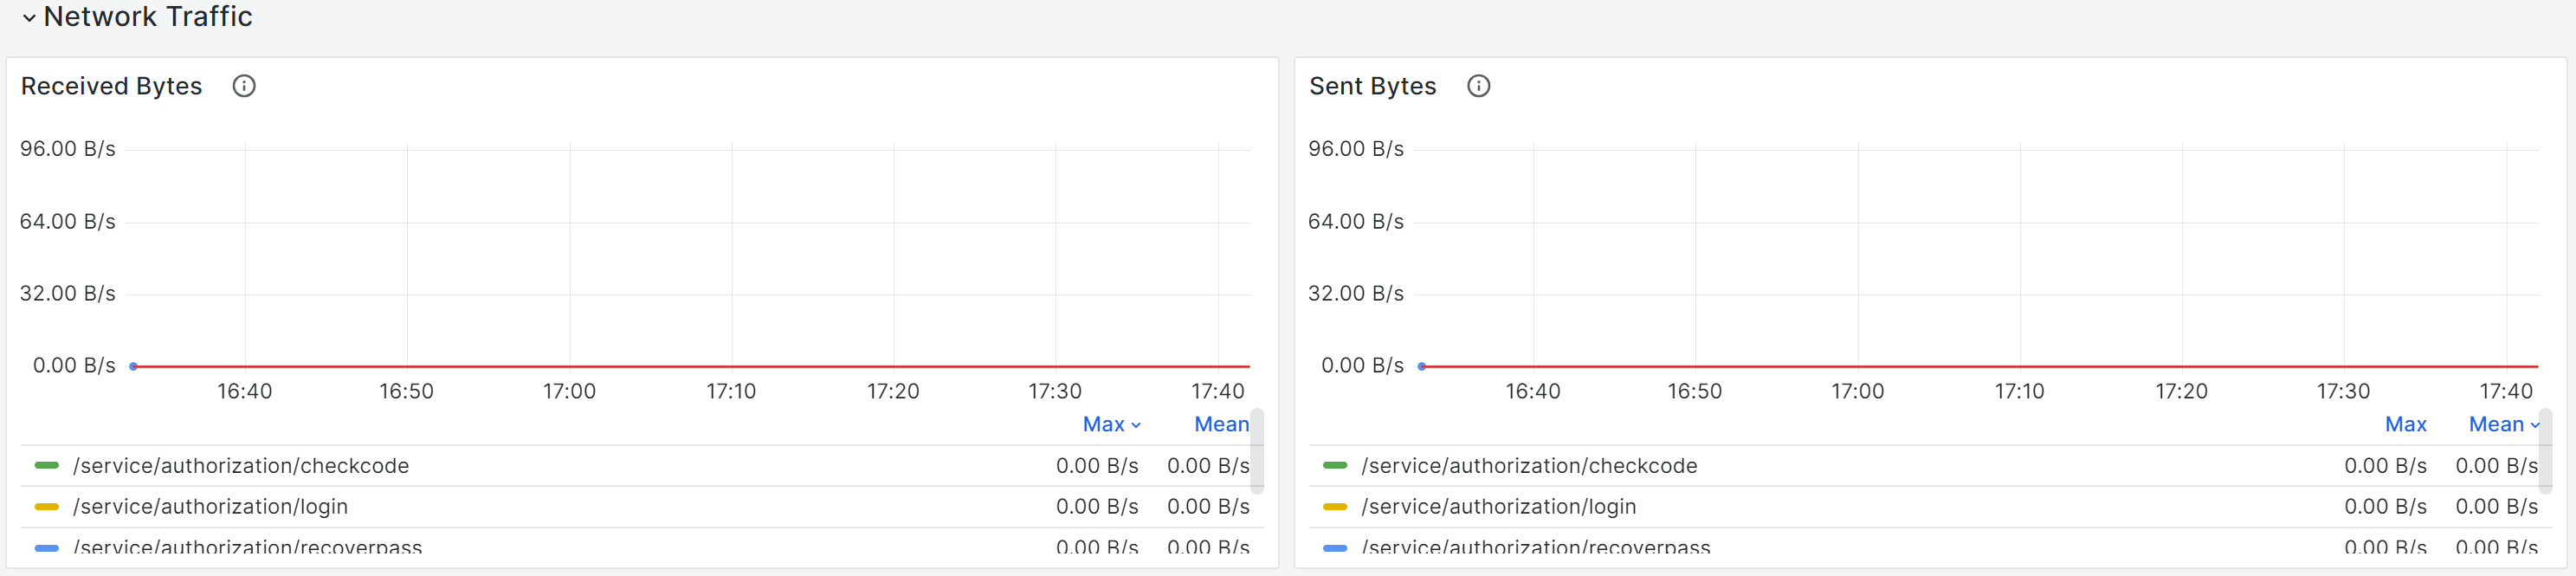
- Network Traffic - bytes received / bytes sent
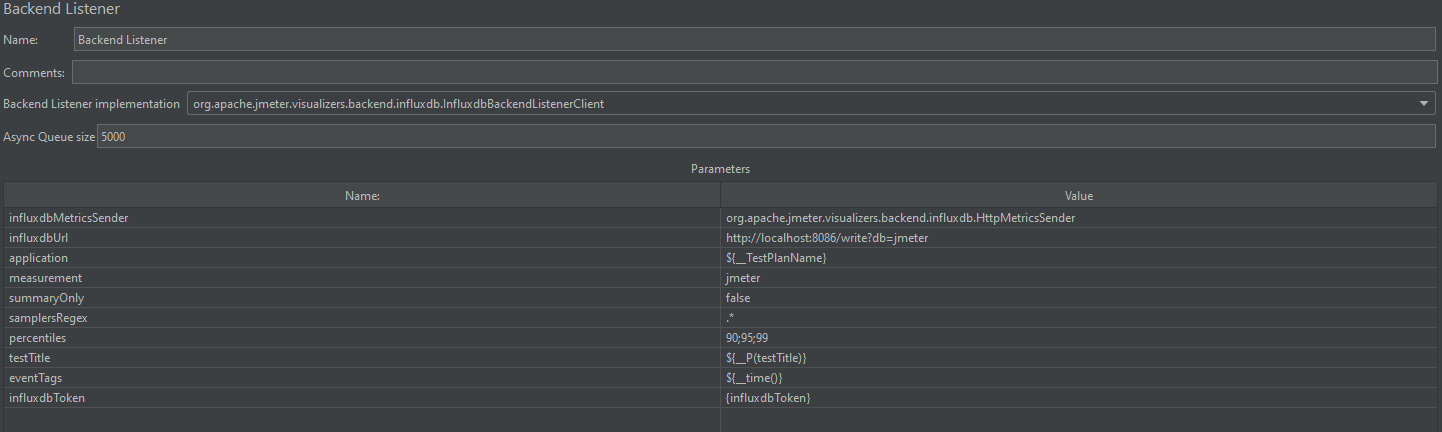
Before running the test for the first time, you need to change the Backend Listener:
- Backend Listener implementation = InfluxdbBackendListenerClient
- application = ${__TestPlanName} --> name jmx-file
- testTitle = ${__P(testTitle)} --> test title (property is passed at startup)
- eventTags = ${__time()} --> unique RunID
- influxdbToken = {influxdbToken} --> influxdb API Token
Data source config
Collector type:
Collector plugins:
Collector config:
Revisions
Upload an updated version of an exported dashboard.json file from Grafana
| Revision | Description | Created | |
|---|---|---|---|
| Download |
InfluxDB
Easily monitor InfluxDB, an open source time series database, with Grafana Cloud's out-of-the-box monitoring solution.
Learn more