Jenkins Build Status Dashboard - Enhanced Version
Dashboard to display Jenkins job details from InfluxDB
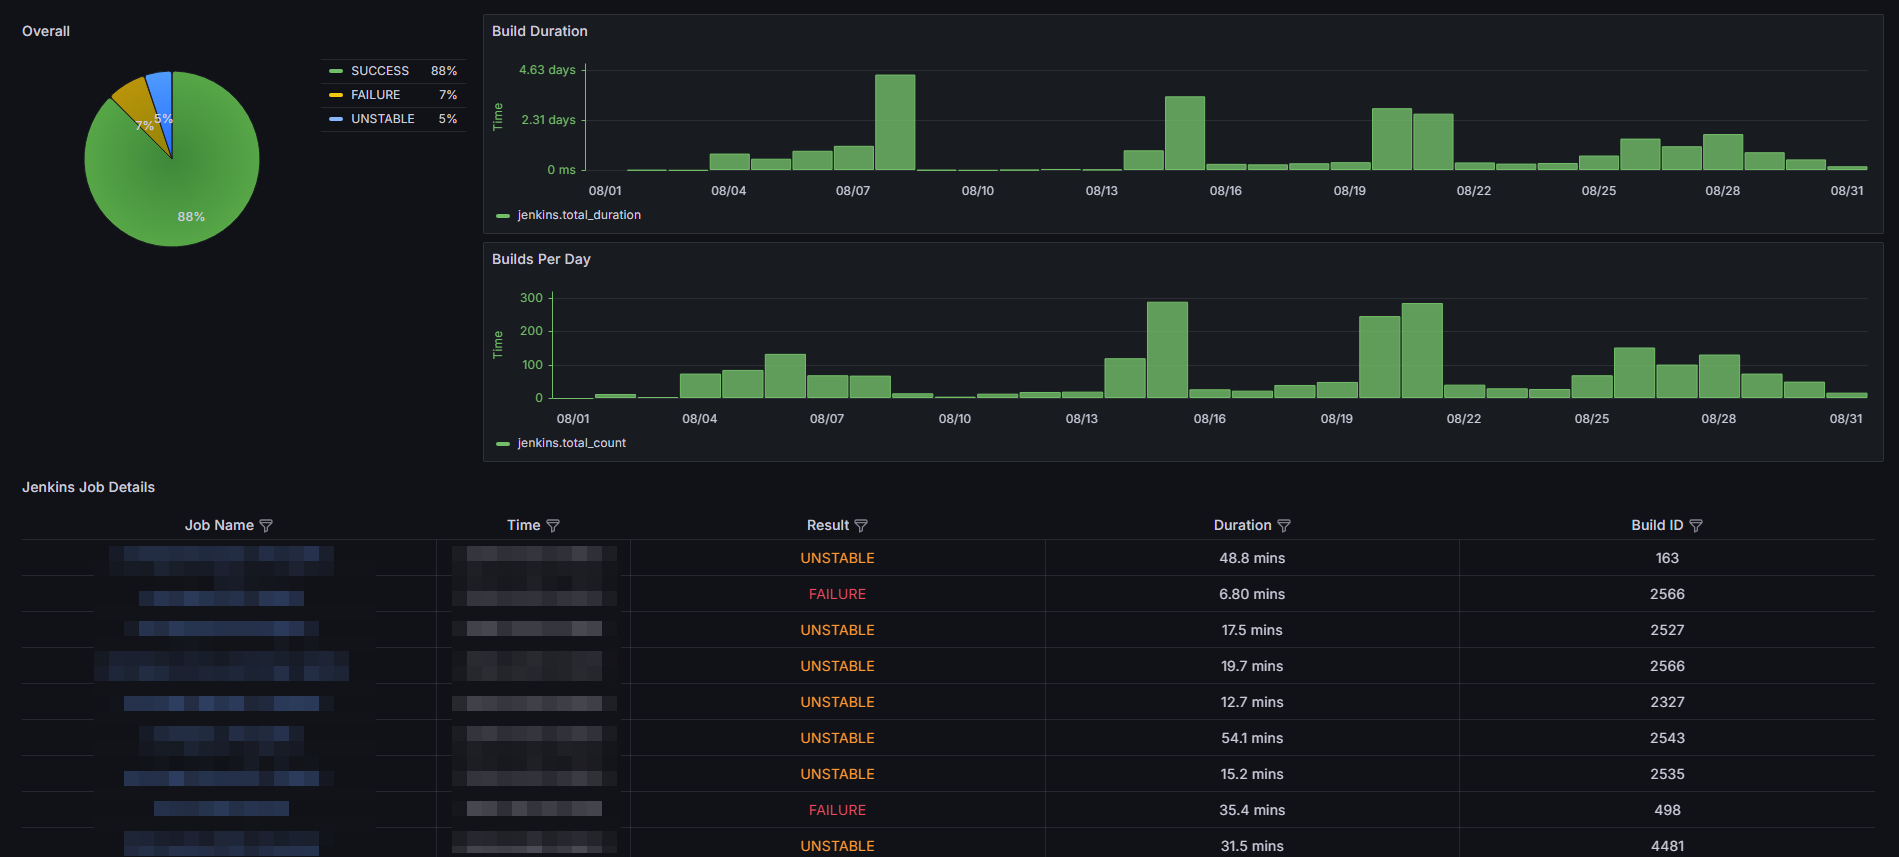
Jenkins Build Status Dashboard - Enhanced Version
This dashboard is a customized version based on the original Jenkins Build Status Dashboard. It provides comprehensive insights into the Jenkins build status and performance metrics.
Instructions to Clone the Code
To use this dashboard, first clone the code repository from GitHub:
git clone https://github.com/ynixon/jenkins-collector.git
Setup and Deployment
After cloning, follow the setup and deployment instructions provided in the repository's README. The README contains detailed steps to build, tag, push, and run the Docker container for the Jenkins Collector.
Link to repository: ynixon/jenkins-collector on GitHub.
Additional Notes
- Ensure your Jenkins and InfluxDB credentials are stored securely.
- The default logging level is set to
INFO. You can adjust it toDEBUGif more detailed logs are required. - Check the README for more security considerations and best practices.
Data source config
Collector config:
Upload an updated version of an exported dashboard.json file from Grafana
| Revision | Description | Created | |
|---|---|---|---|
| Download |
Jenkins
Easily monitor your deployment of Jenkins, the open source automation server, with Grafana Cloud's out-of-the-box monitoring solution.
Learn more