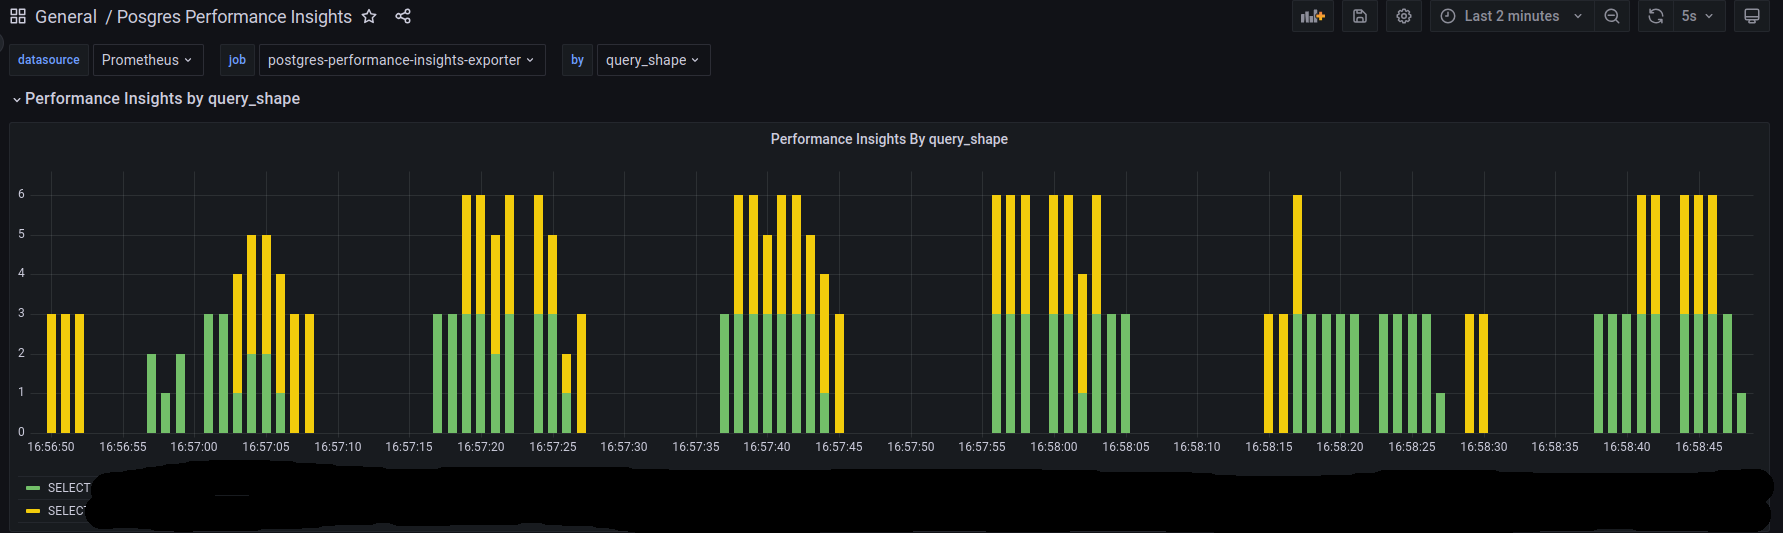
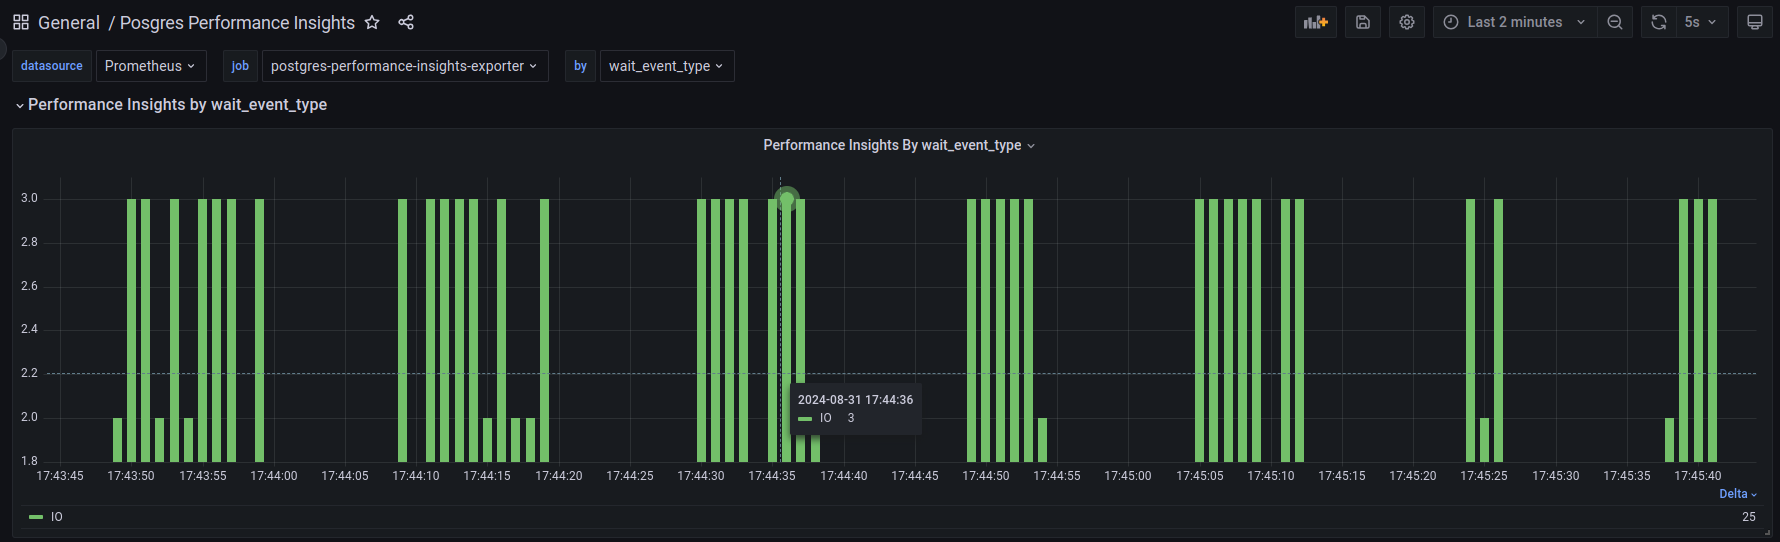
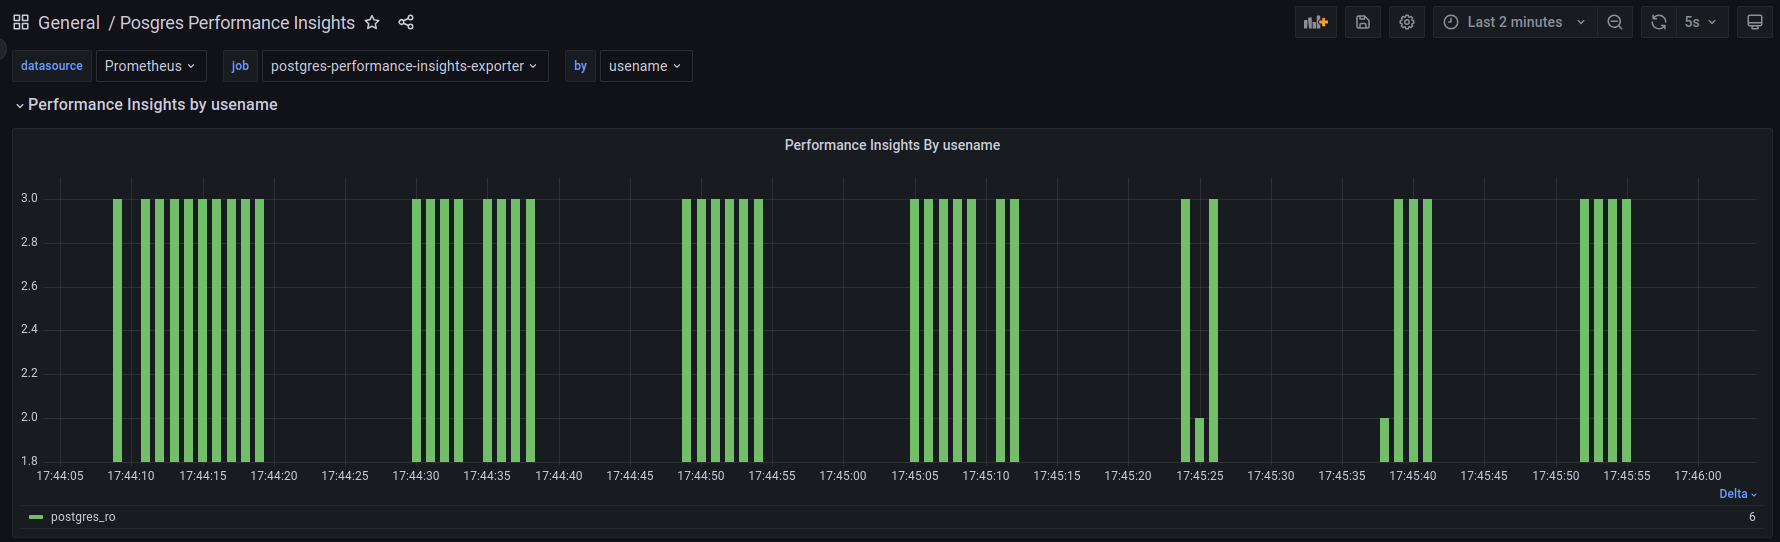
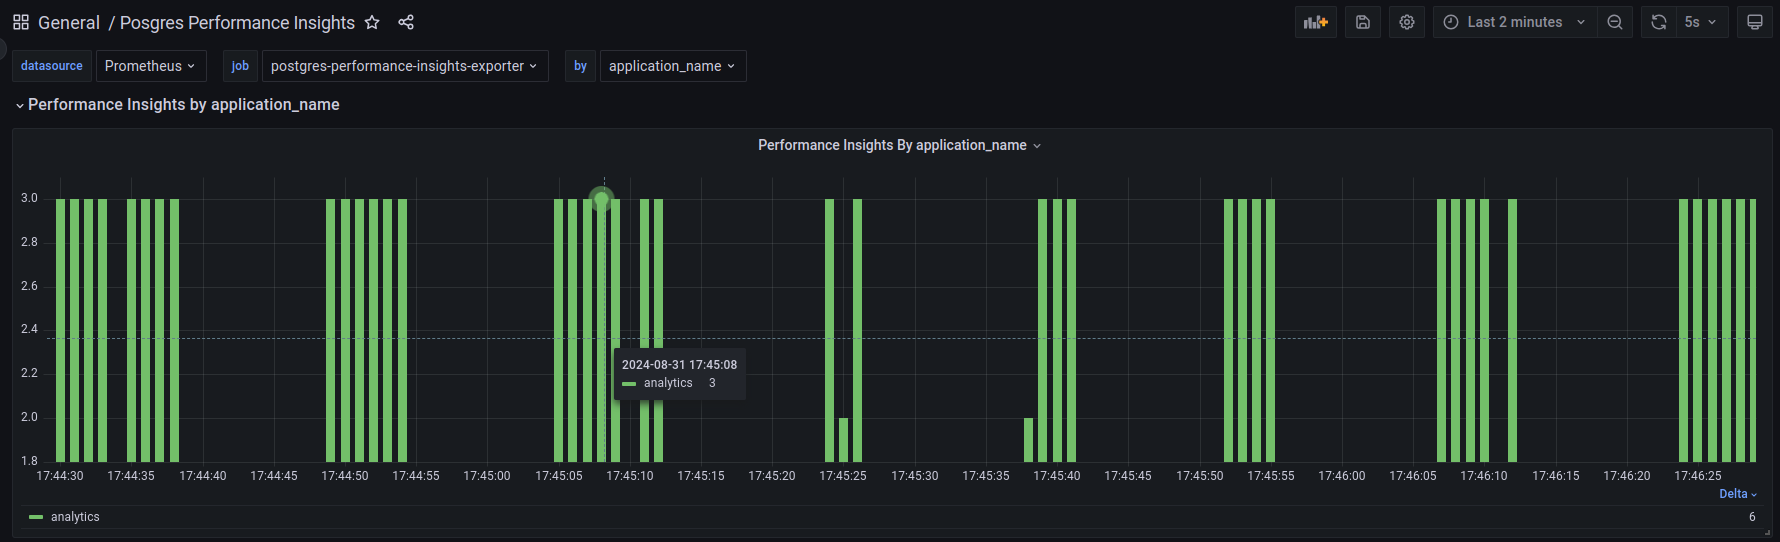
Postgres Performance Insights
PostgreSQL Performance Insights Exporter
Or run in docker
Read more at Medium
docker run -it --rm --net host \
  -e DB_NAME=test \
  -e DB_USER=postgres \
  -e DB_PASSWORD=pass \
  -e DB_HOST=127.0.0.1 \
  -e DB_PORT=5432 \
  --name postgres-performance-insights-exporter \
  andriik/postgres-performance-insights-exporter
Prometheus configuration
scrape_configs:
  - job_name: 'postgres-performance-insights-exporter'
    scrape_interval: 1s
    static_configs:
      - targets: ['127.0.0.1:9153']
Data source config
Collector type:
Collector plugins:
Collector config:
Revisions
Upload an updated version of an exported dashboard.json file from Grafana
| Revision | Description | Created | |
|---|---|---|---|
| Download |
PostgreSQL
Easily monitor your deployment of PostgreSQL, the open source relational database, with Grafana Cloud's out-of-the-box monitoring solution.
Learn more