r2cloud
Basic dashboard for monitoring r2cloud base stations.
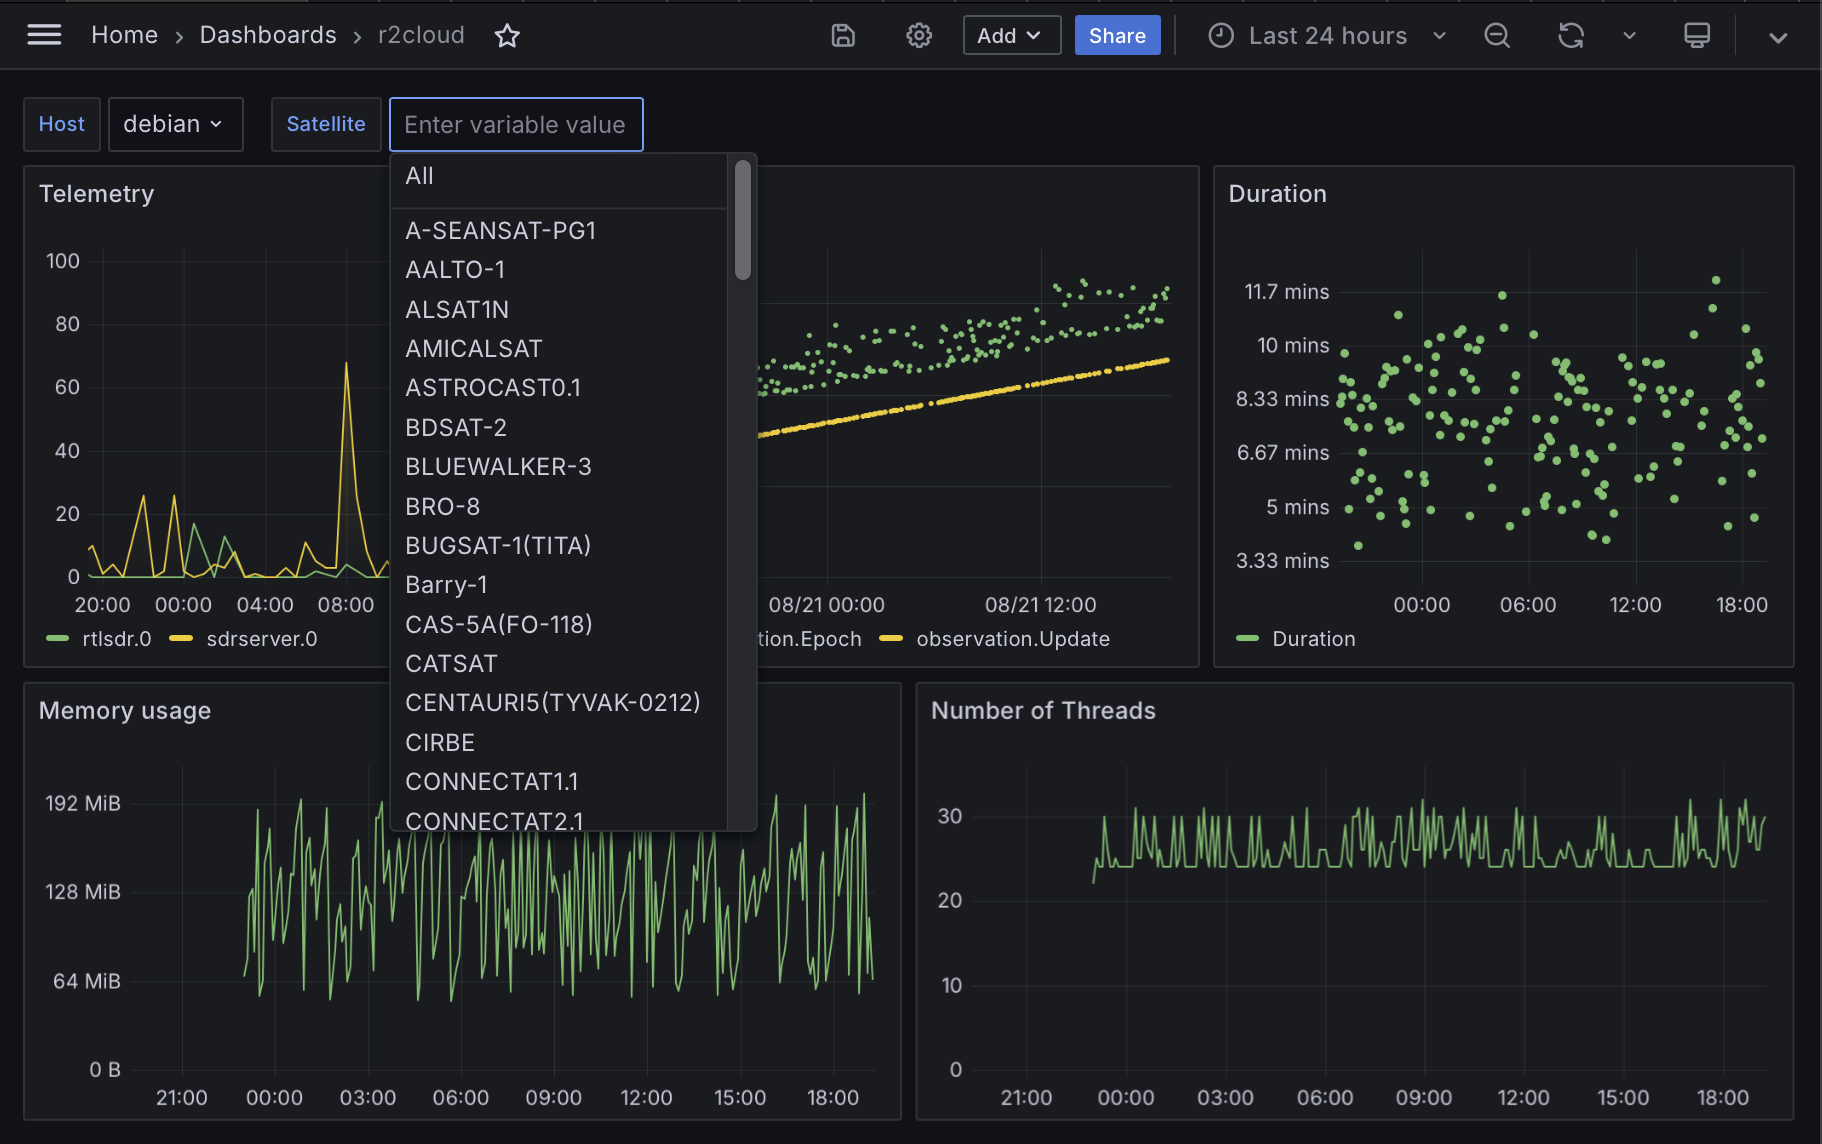
This is pre-defined Grafana dashboard for r2cloud monitoring. Here is steps to start:
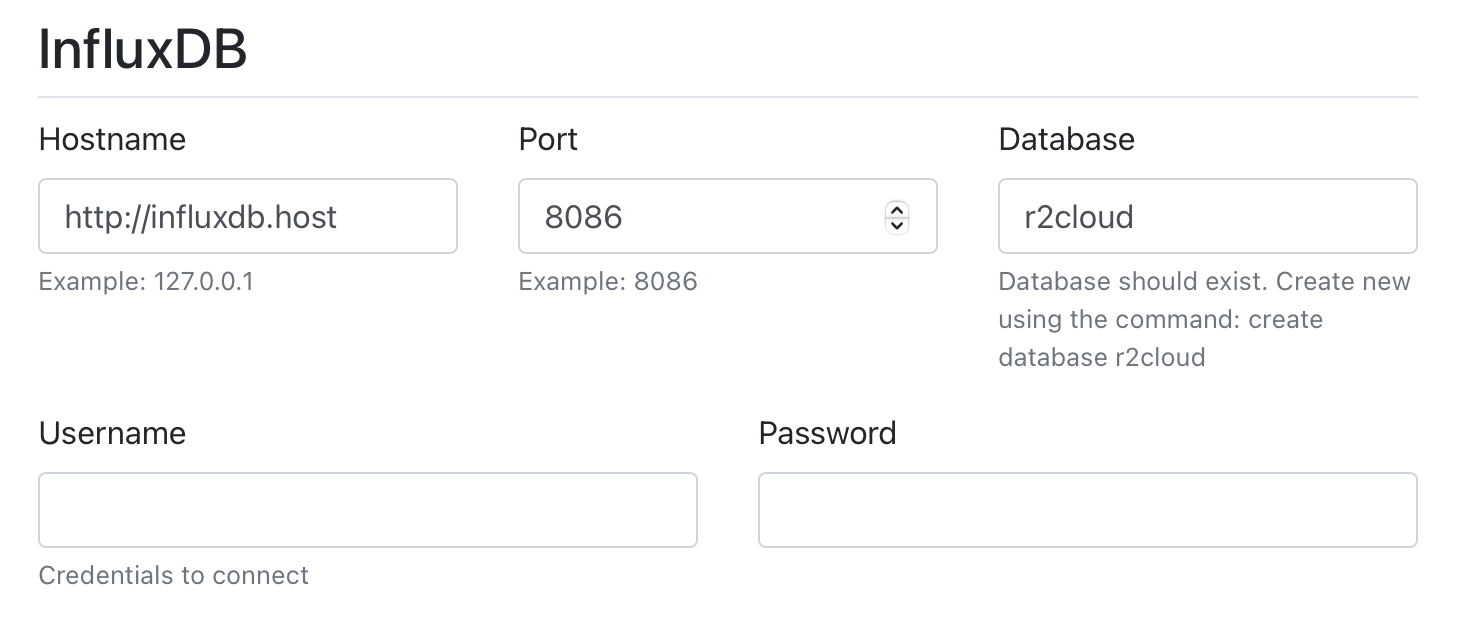
- Install InfluxDB
- Setup a separate database for r2cloud.
- In your r2cloud station go to menu "Configuration" -> "Integrations" and put InfluxDB details.
- Restart r2cloud to apply the settings
- Configure "influxdb-r2cloud" datasource in Grafana.
- Import this dashboard using standard Grafana tools.
Data source config
Collector type:
Collector plugins:
Collector config:
Revisions
Upload an updated version of an exported dashboard.json file from Grafana
| Revision | Description | Created | |
|---|---|---|---|
| Download |