Kube State Metrics v2
This Grafana dashboard provides a comprehensive overview of the state and performance of Kubernetes resources within your cluster, with a focus on resource counts, utilization, and availability. It covers key metrics across nodes, namespaces, pods, and containers, making it easier to monitor and troubleshoot your cluster effectively.
Here’s a detailed breakdown of each section in the Kubernetes State Metrics dashboard:
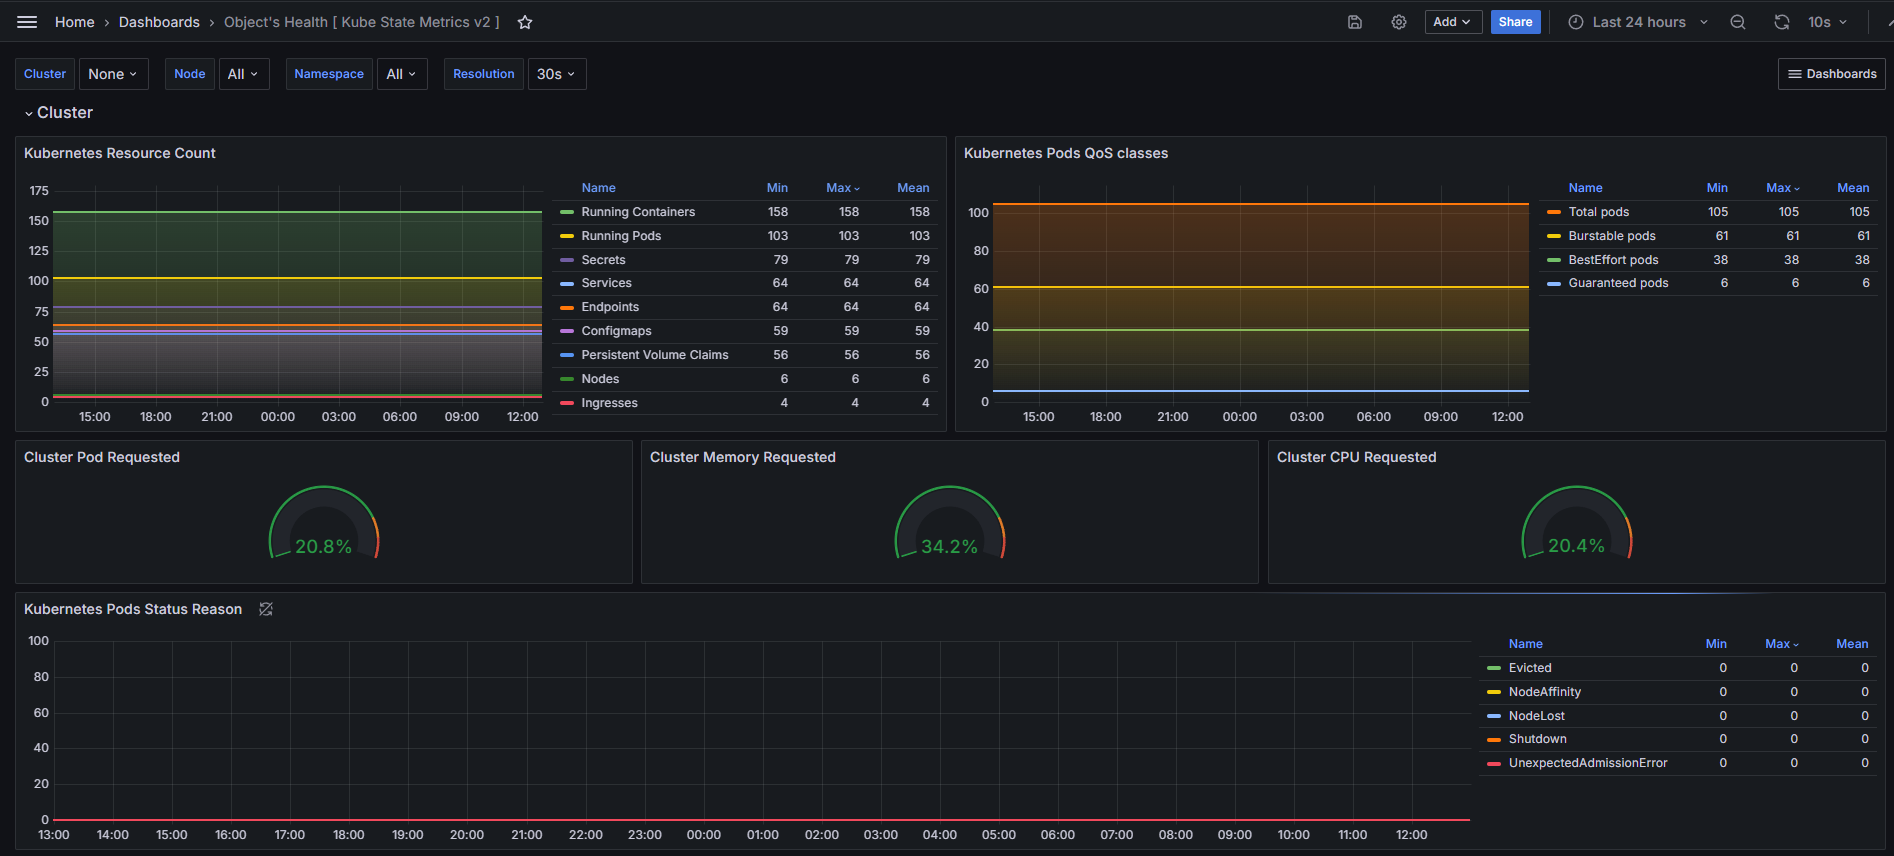
Kubernetes Resource Count: This section displays the total count of various Kubernetes resources, including pods, deployments, statefulsets, jobs, and PVCs, providing a quick overview of the resource distribution within the cluster.
Kubernetes Pods QoS Classes: This section shows the distribution of Quality of Service (QoS) classes for the pods in the cluster, such as Guaranteed, Burstable, and BestEffort, helping you understand how resources are allocated based on pod priority.
Cluster Pod Requested: This section presents the total number of requested pods within the cluster, offering insights into the resource demands placed on your Kubernetes environment.
Cluster Memory Requested: This section displays the total amount of memory requested by all pods in the cluster, helping you track memory resource allocation and identify potential over- or under-provisioning.
Cluster CPU Requested: This section provides metrics on the total CPU requested by pods in the cluster, offering a view of CPU resource demands and helping identify any bottlenecks.
Kubernetes Pods Status Reason: This section categorizes pods based on their status reasons (e.g., Running, Pending, Failed), giving you a clear picture of the current state of your workloads.
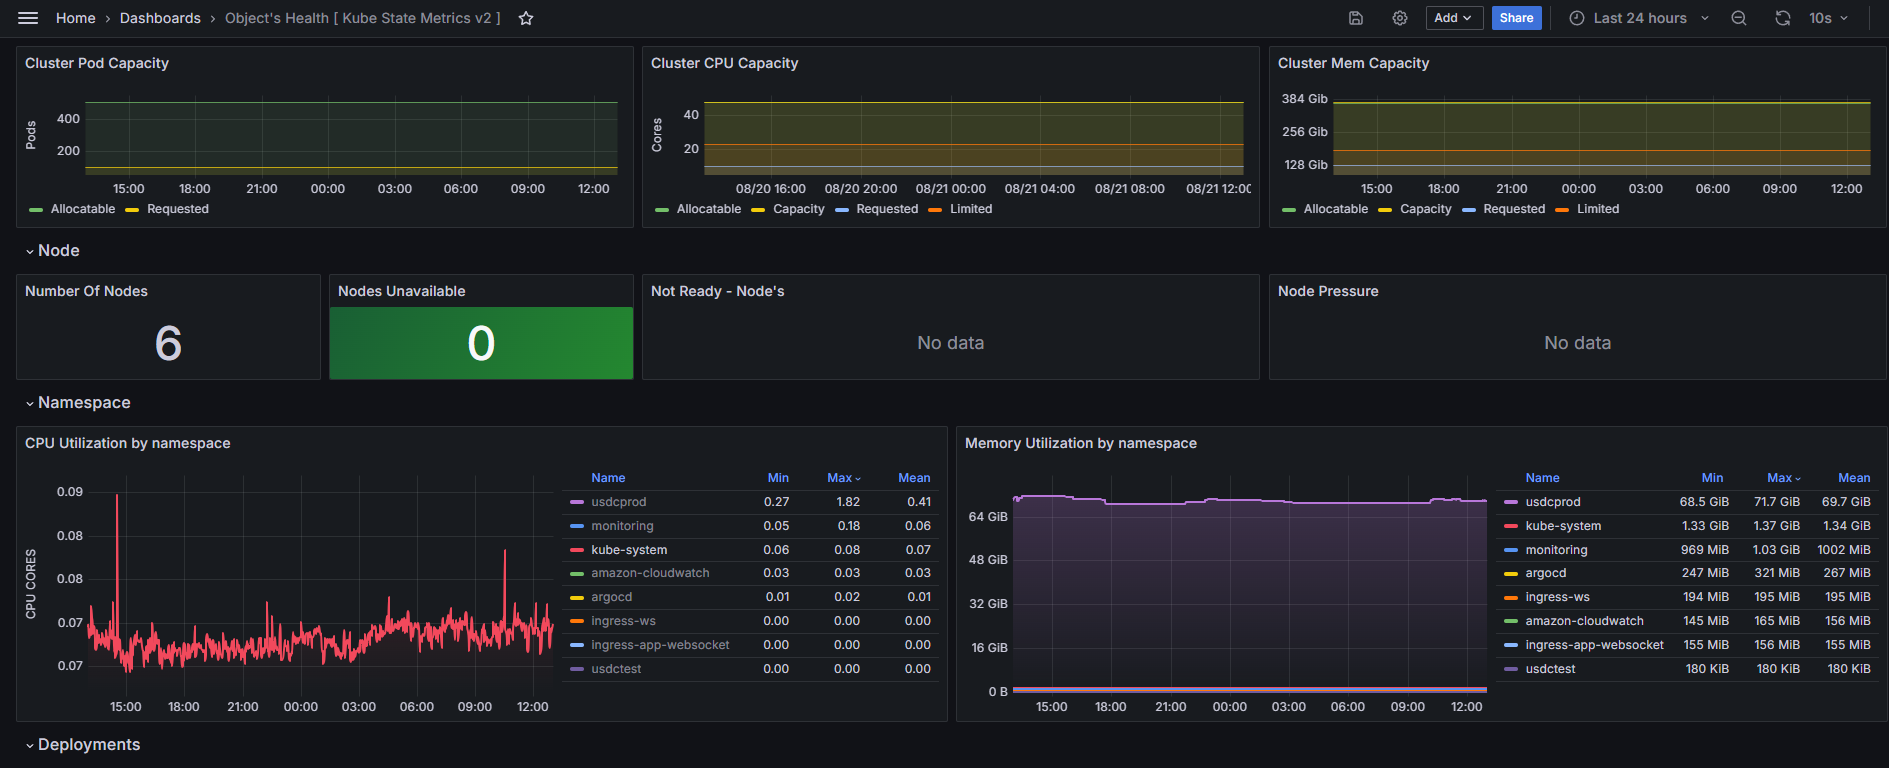
Cluster Pod, CPU, and Memory Capacity: This section shows the total capacity of pods, CPU, and memory across the cluster, helping you compare requested resources against available capacity to identify resource constraints.
Node Availability: This section provides a count of nodes that are available, unavailable, or not ready, as well as nodes under pressure. It helps you quickly identify any issues with node availability and performance.
CPU and Memory Utilization by Namespace: This section breaks down CPU and memory utilization by namespace, allowing you to monitor resource usage at a more granular level and identify any namespaces that may be consuming excessive resources.
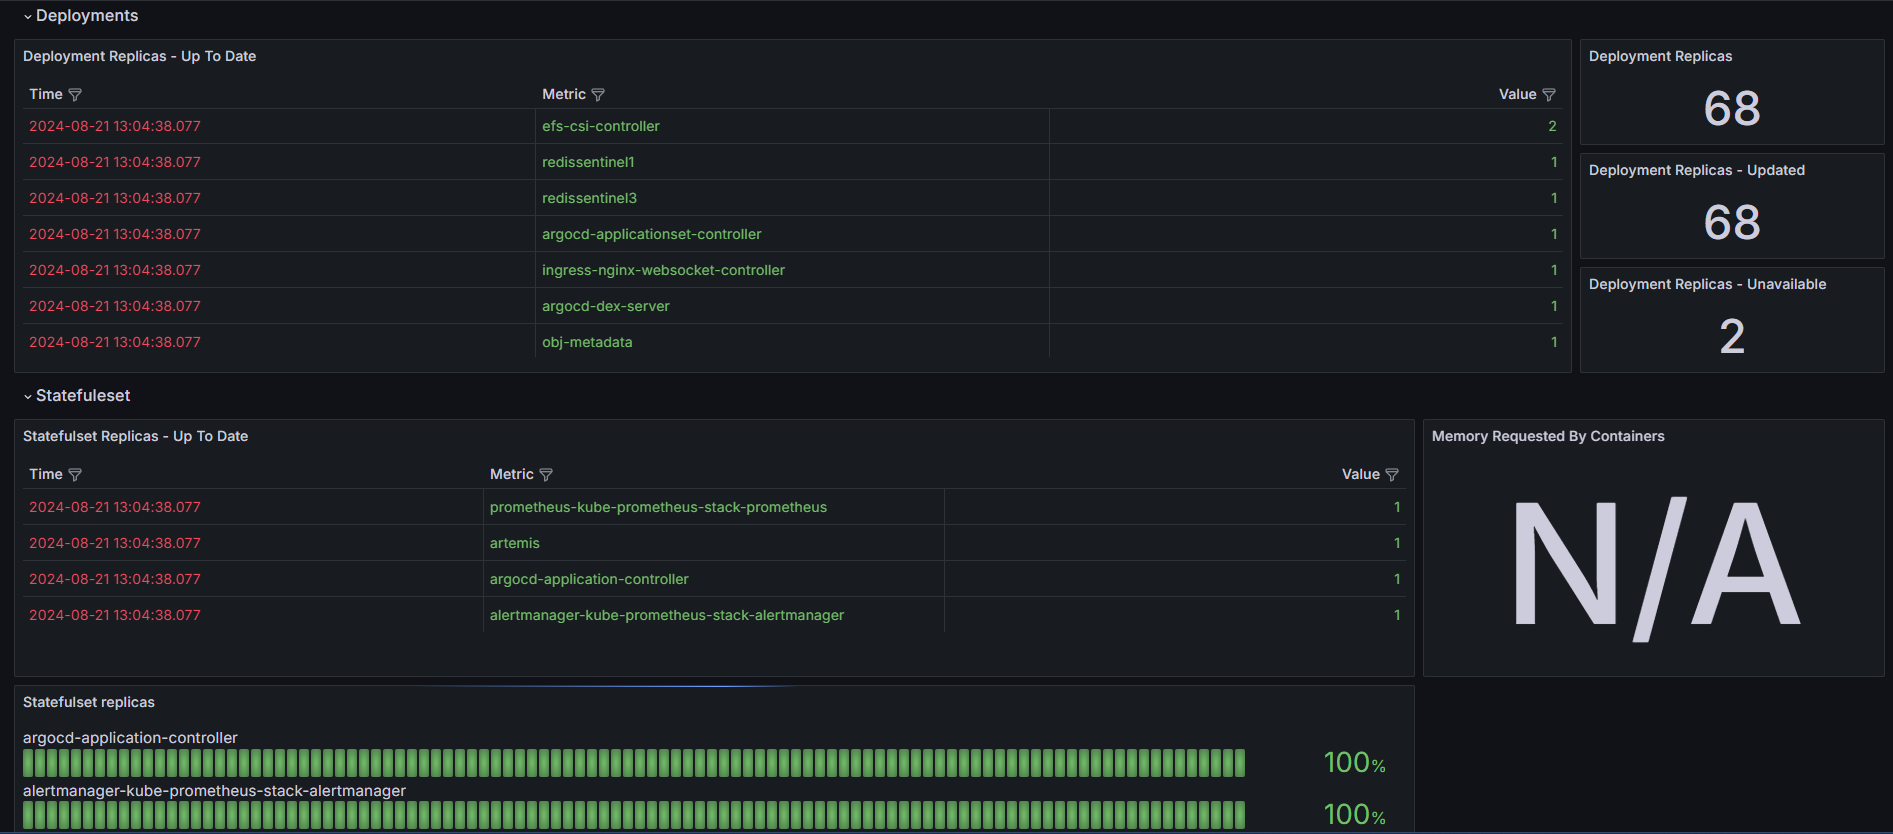
Deployments/StatefulSets Count and Availability: This section displays the count of deployments and statefulsets along with their availability status, helping you monitor the health and readiness of your critical workloads.
Pod Status (Running, Evicted, Not Running, Failed, Succeeded, Pending): This section categorizes pods by their status, providing detailed information on how many pods are running, evicted, failed, succeeded, or pending, helping you keep track of workload health and stability.
Container Status (Running, Waiting, Terminated, Restarted): This section shows the status of containers within the cluster, including metrics on running, waiting, terminated, and restarted containers. It also includes data on CPU cores requested by containers, helping you monitor container performance and resource allocation.
Horizontal Pod Autoscaler (HPA): This section provides insights into the performance of the Horizontal Pod Autoscaler, showing metrics like current replica count and target utilization. It helps you understand how well your cluster is handling scaling based on workload demands.
Jobs: This section tracks the status of jobs within the cluster, including metrics on running, succeeded, and failed jobs, helping you monitor task completion and identify any issues with job execution.
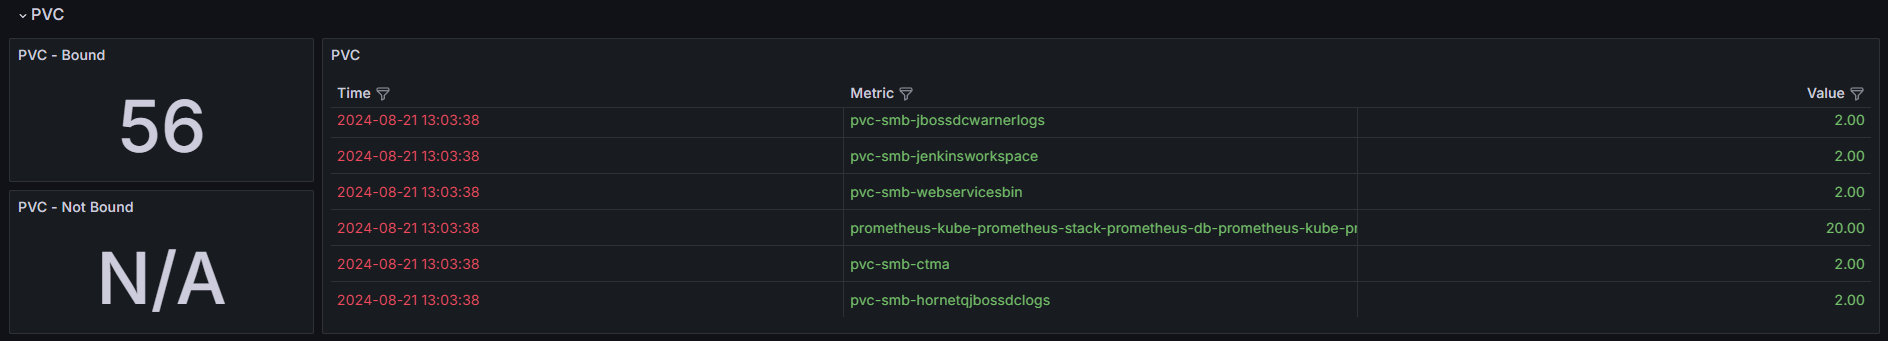
Persistent Volume Claims (PVC) Bound/Not Bound: This section displays the number of PVCs that are bound or not bound, helping you monitor the status of your storage resources and ensure that they are being correctly allocated and utilized.
This dashboard provides a detailed and structured view of your Kubernetes cluster's state and resource usage, making it easier to monitor performance, identify issues, and optimize resource allocation. To fully utilize the dashboard's capabilities, ensure that the Kube State Metrics exporter is correctly configured, as it provides the critical data needed for comprehensive monitoring and analysis.
Data source config
Collector config:
Upload an updated version of an exported dashboard.json file from Grafana
| Revision | Description | Created | |
|---|---|---|---|
| Download |
Kubernetes
Monitor your Kubernetes deployment with prebuilt visualizations that allow you to drill down from a high-level cluster overview to pod-specific details in minutes.
Learn more