OMEGAMON Data Provider Stack Monitoring V2
Dashboard for OMEGAMON Data Broker and Data Connect
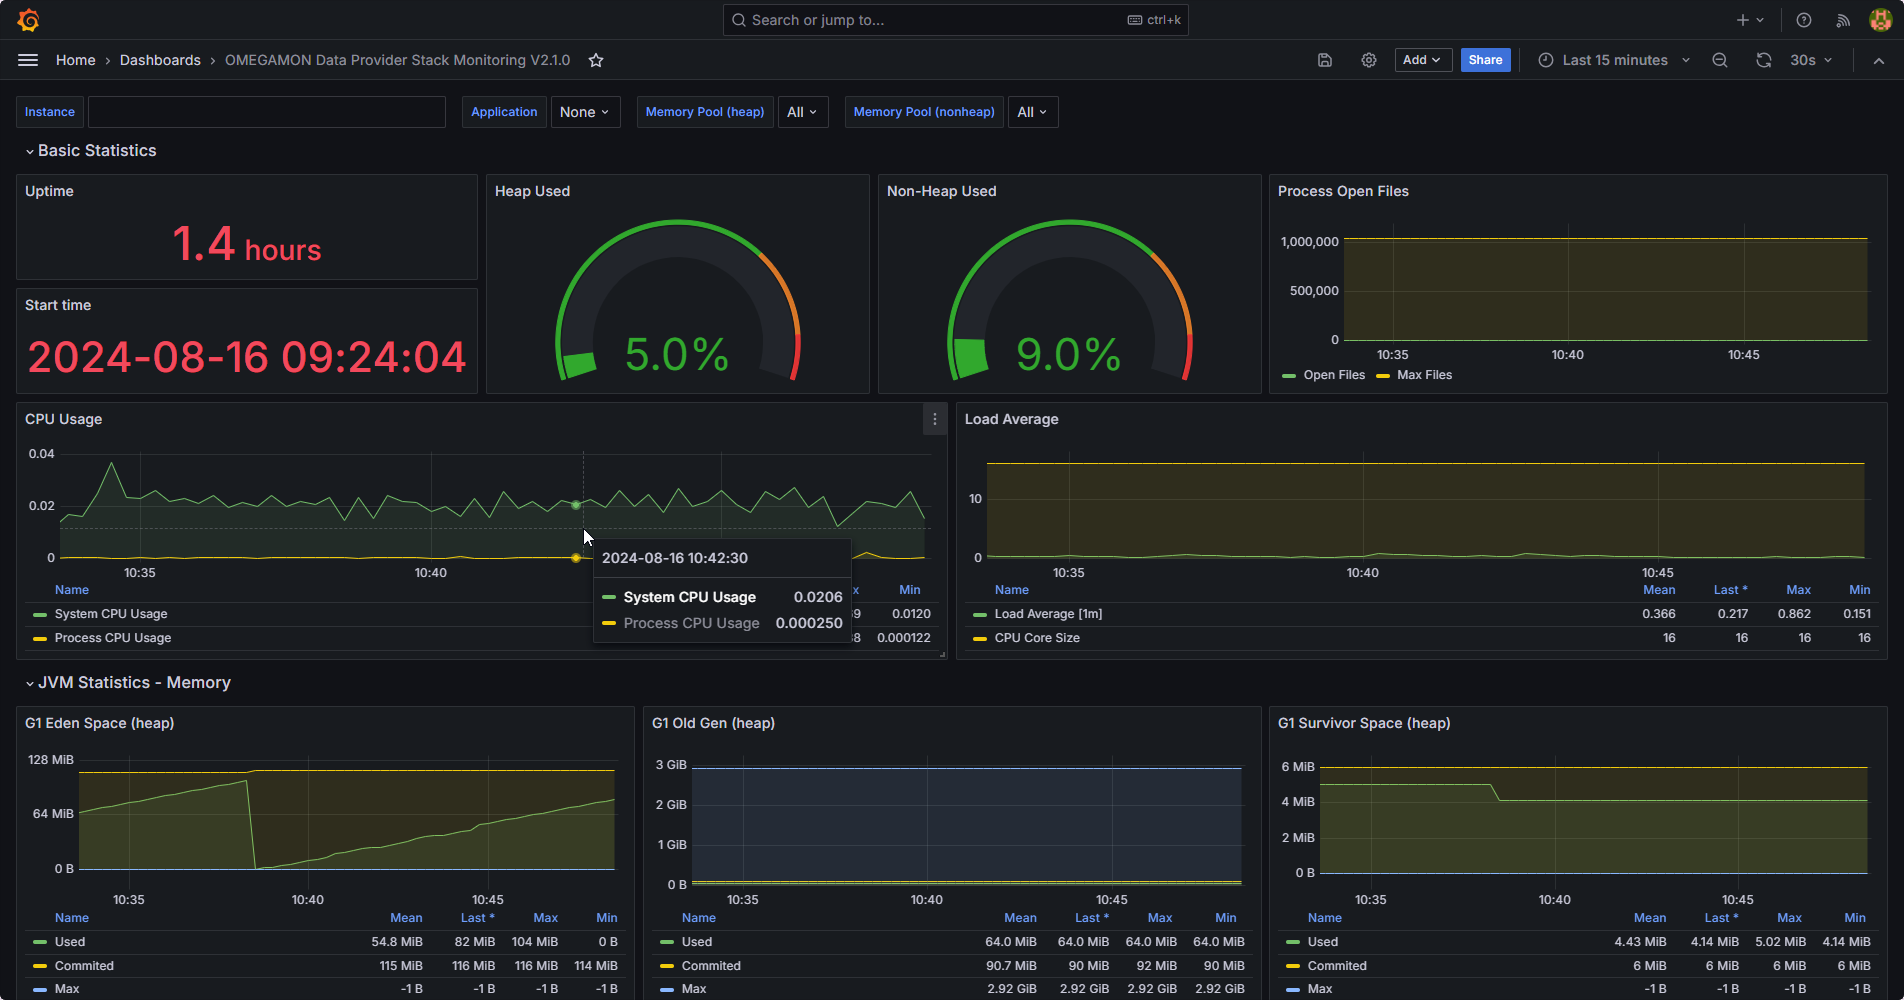
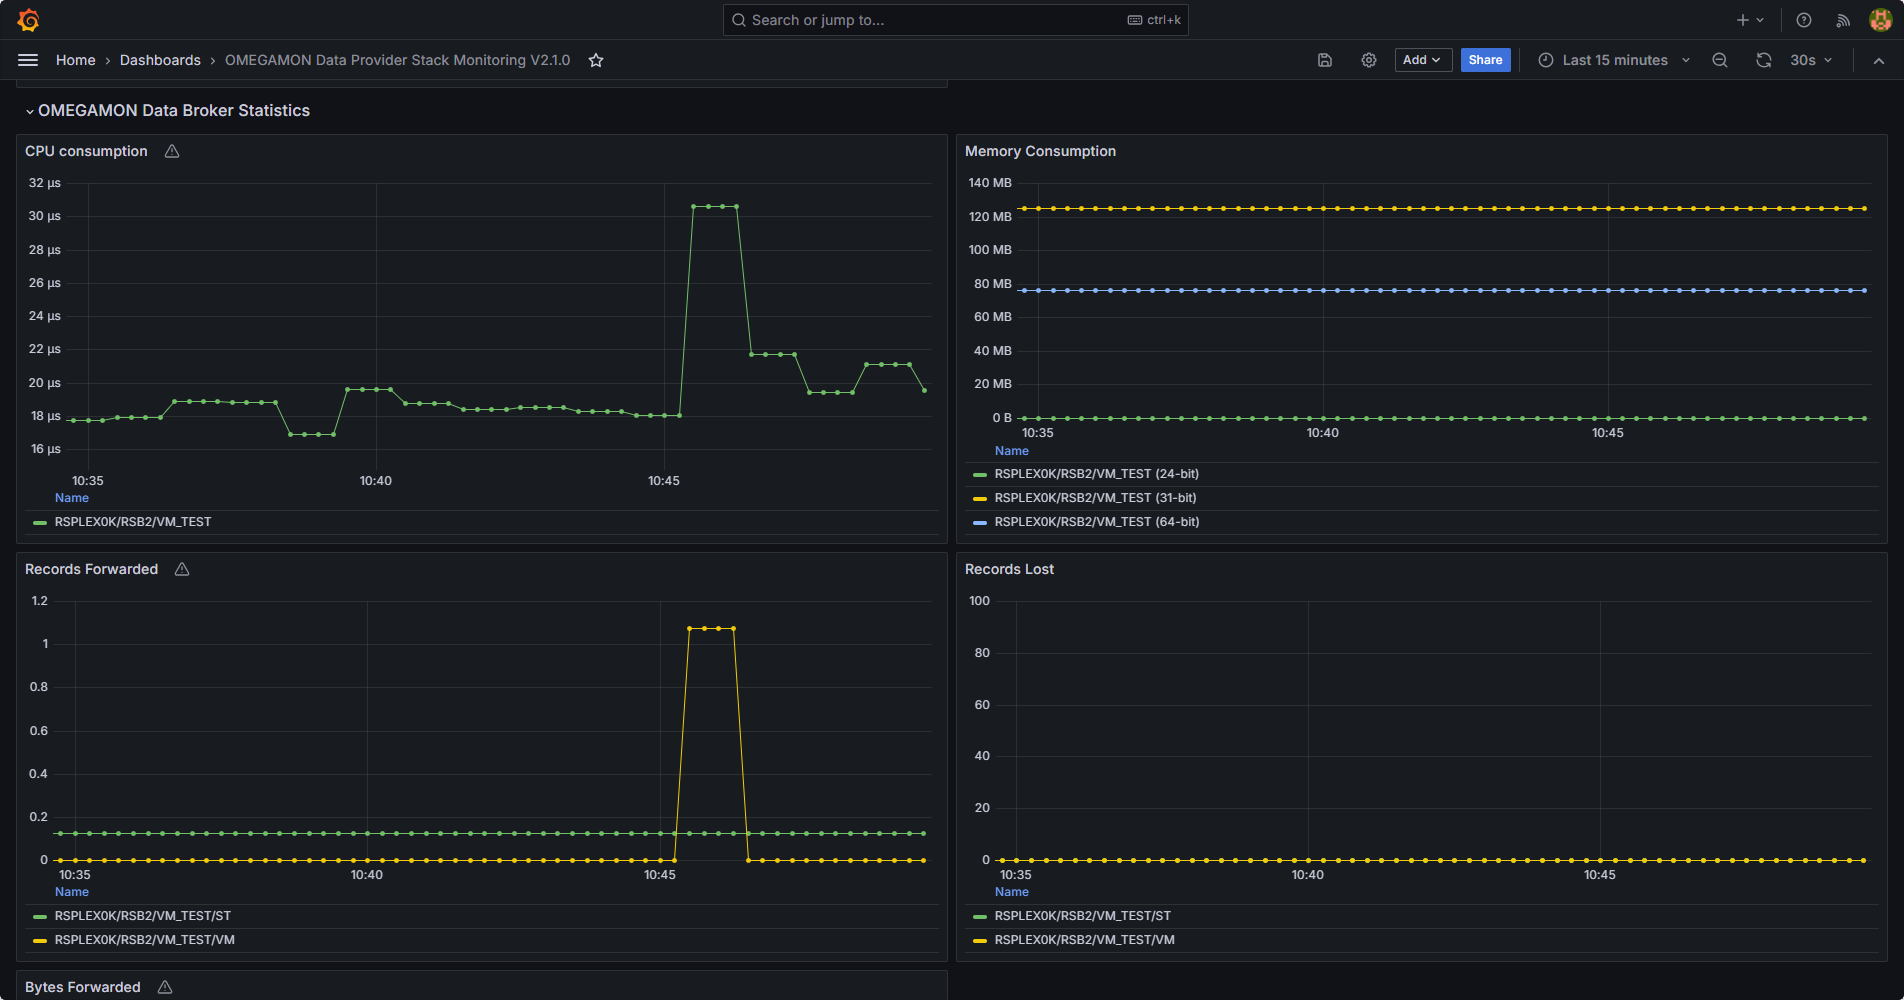
This sample Grafana dashboard is created to monitor OMEGAMON Data Provider stack. Dashboard is focusing on main metrics that allow to verify that OMEGAMON Data Provider stack is running properly and is in good state.
Data source config
Collector type:
Collector plugins:
Collector config:
Revisions
Upload an updated version of an exported dashboard.json file from Grafana
| Revision | Description | Created | |
|---|---|---|---|
| Download |