Jenkins overview
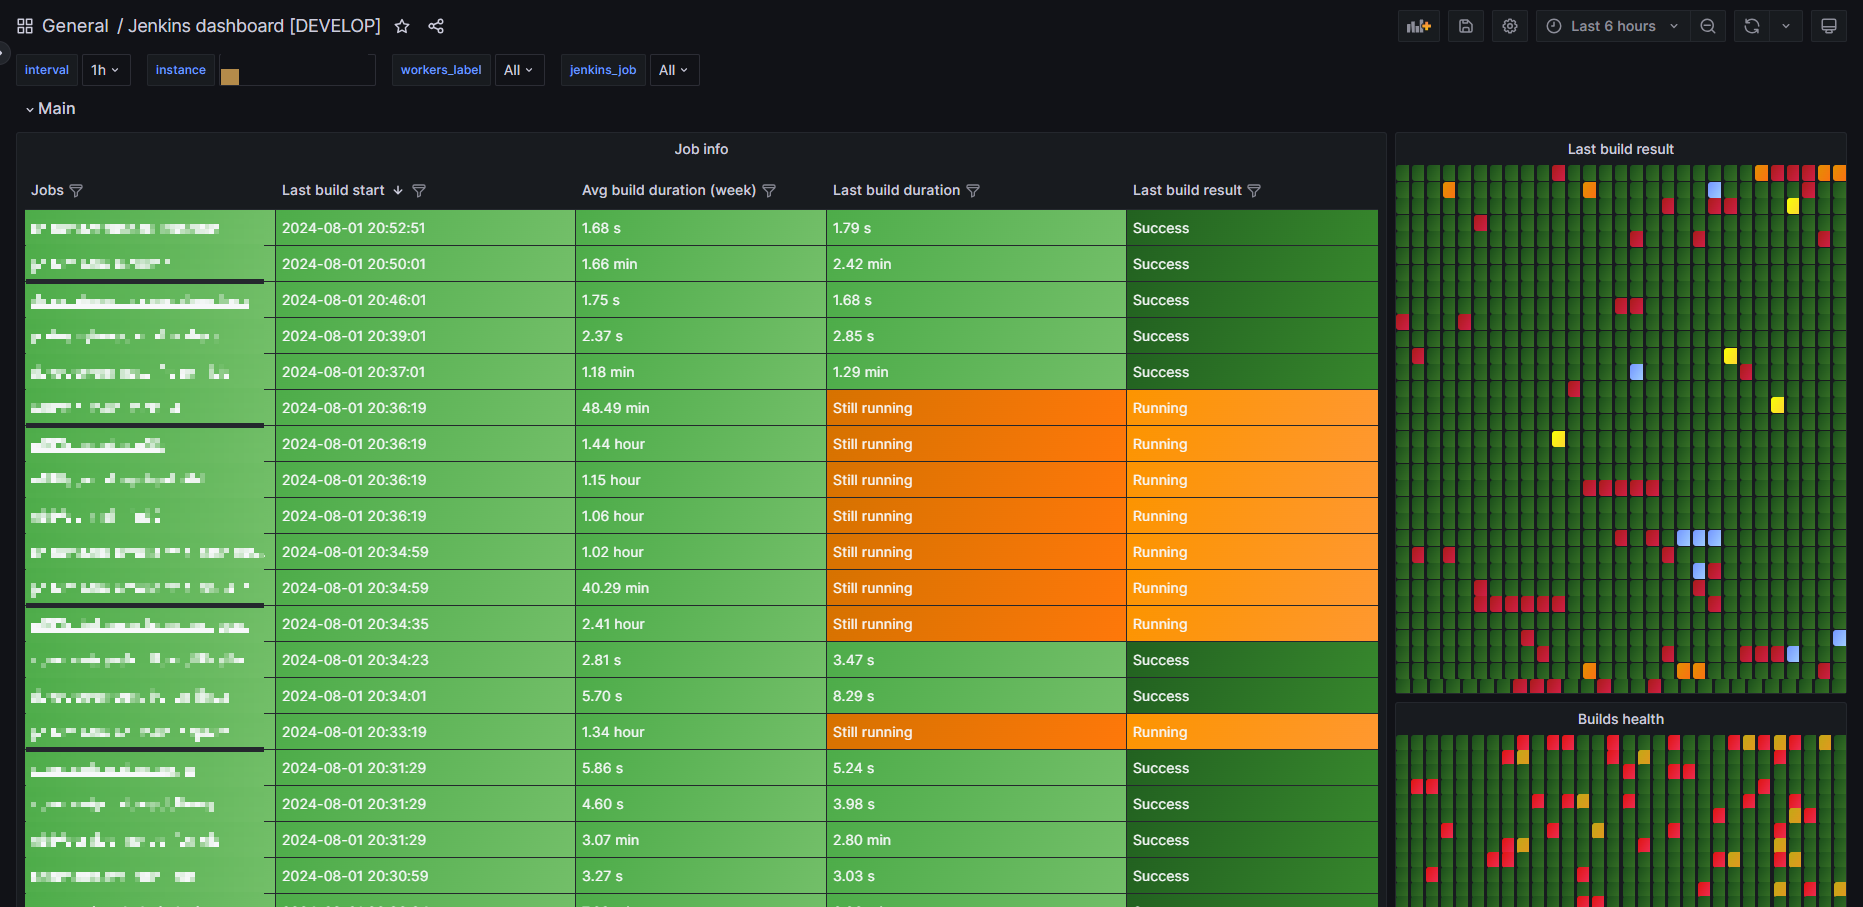
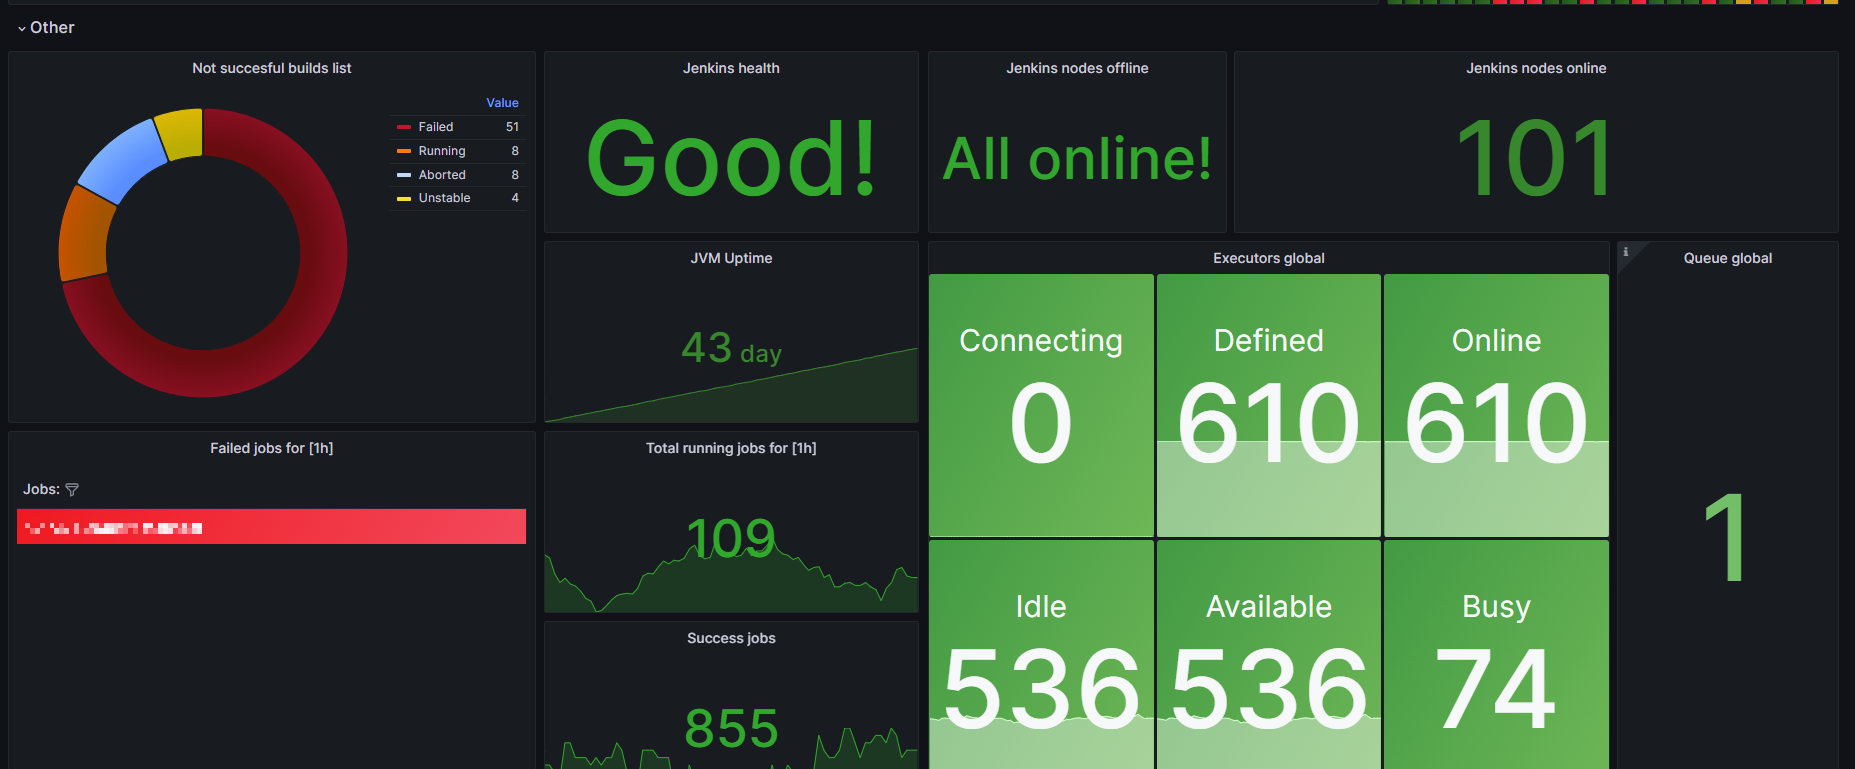
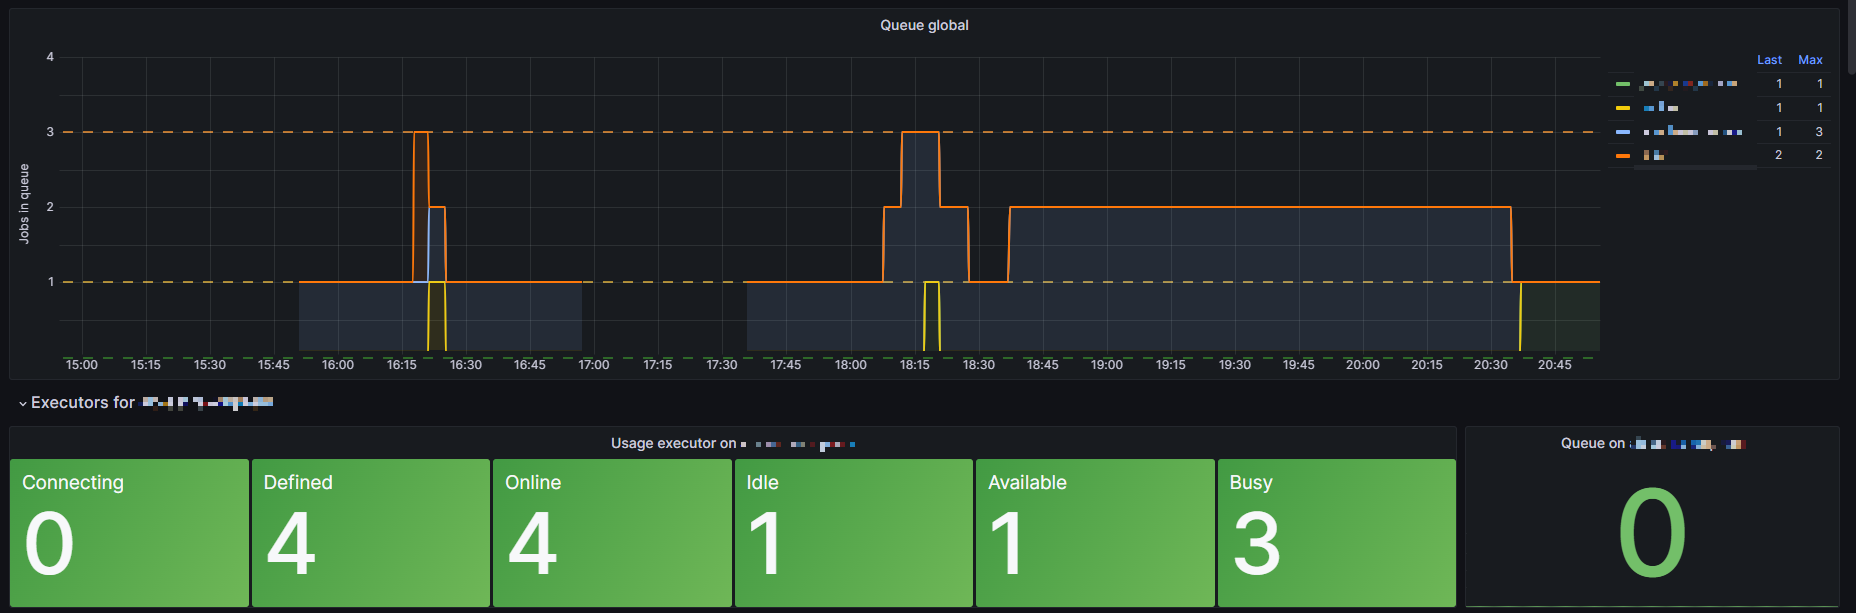
The dashboard displays the status of your Jenkins jobs, the status of the queue on executors, and a few other things. The metrics you get are taken from the Prometheus plugin for your Jenkins.
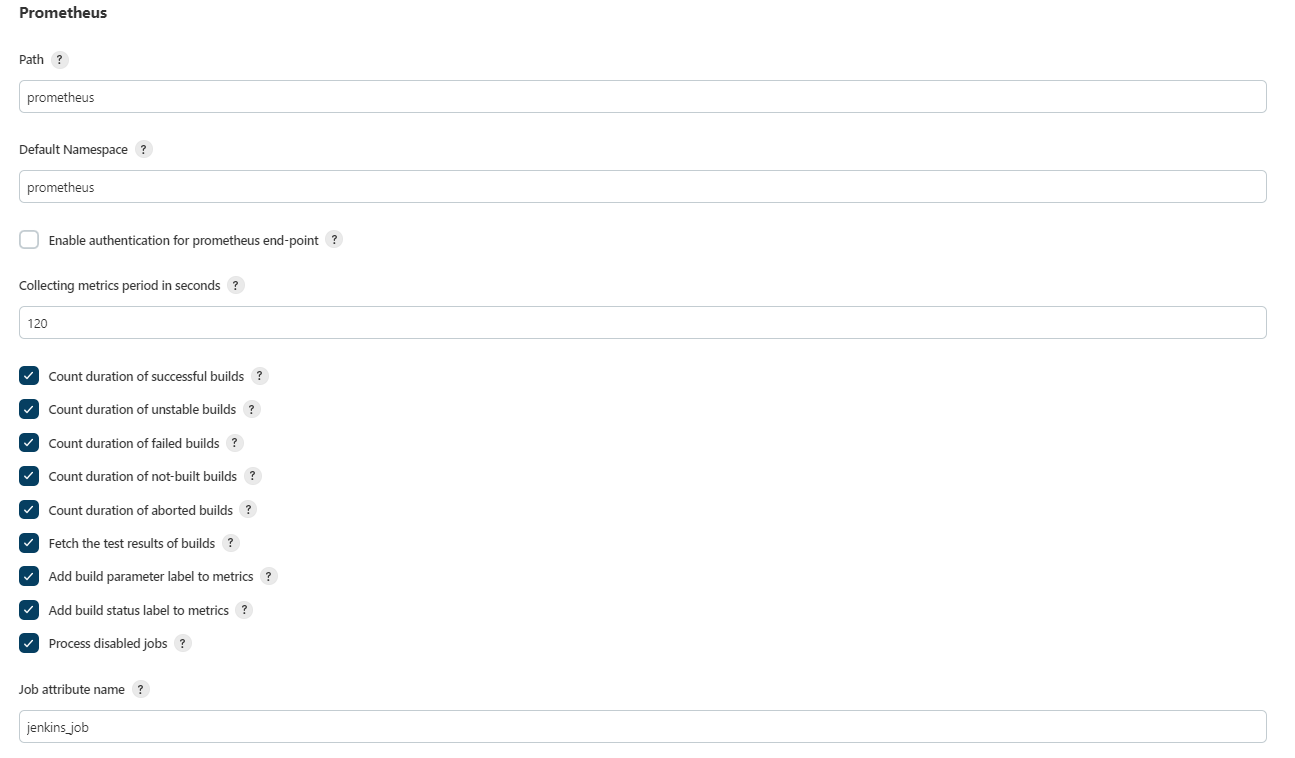
For the dashboard to work, you need to configure your prometheus plugin for jenkins. Set the default name for metrics on prometheus like prometheus_. All your metrics should start with prometheus_.
And you need set parameter job attribute name on jenkins_job like in screenshot.
For interactivity, also include a link to your Jenkins in the variables. jenkins_url must be like https://jenkins-test.com/job/.
Also in git
Data source config
Collector type:
Collector plugins:
Collector config:
Revisions
Upload an updated version of an exported dashboard.json file from Grafana
| Revision | Description | Created | |
|---|---|---|---|
| Download |
Jenkins
Easily monitor your deployment of Jenkins, the open source automation server, with Grafana Cloud's out-of-the-box monitoring solution.
Learn more