K8S Pod Metrics
Pod metrics from kube-prometheus-stack and cadvisor
Works with default kube prometheus stack setup. Display primary cadvisor metrics. Rows are created dynamically via grafana variables
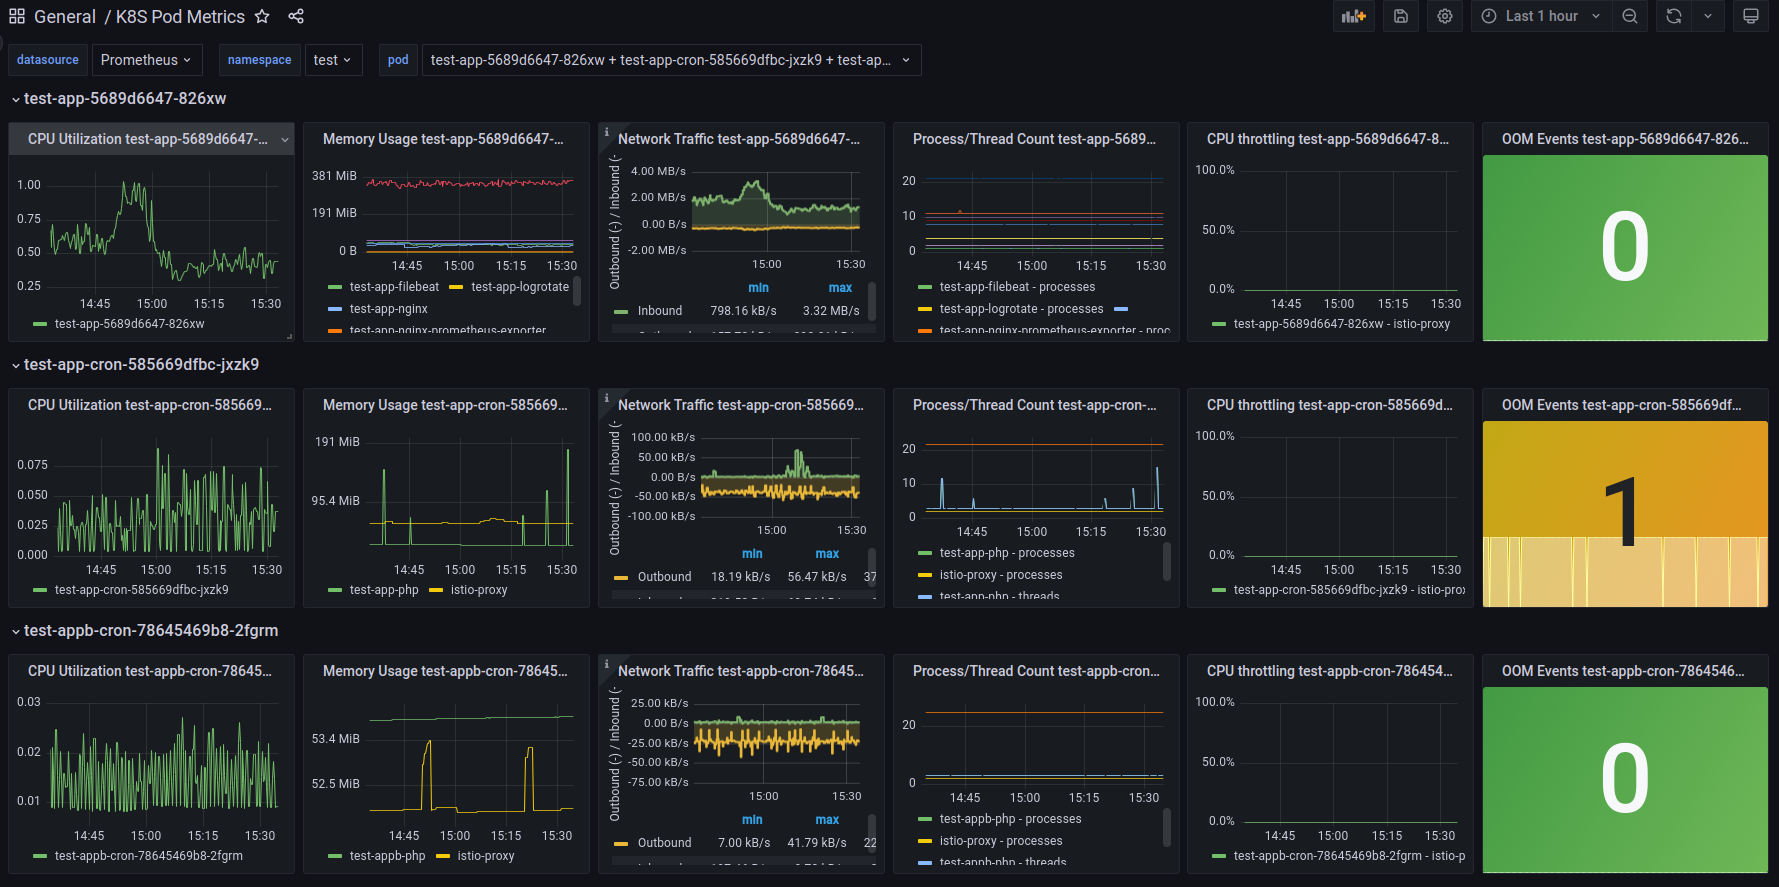
Metrics:
- Pod CPU usage per container
- Pod memory usage per container
- Pod network traffic
- Pod processes/threads per container
- Pod CPU throttling per container
- Pod OOM events
Data source config
Collector type:
Collector plugins:
Collector config:
Revisions
Upload an updated version of an exported dashboard.json file from Grafana
| Revision | Description | Created | |
|---|---|---|---|
| Download |
Kubernetes
Monitor your Kubernetes deployment with prebuilt visualizations that allow you to drill down from a high-level cluster overview to pod-specific details in minutes.
Learn more