Domain Expiration Overview
Display the expiration time monitoring of domain names and support the display of multiple domain names at the same time.
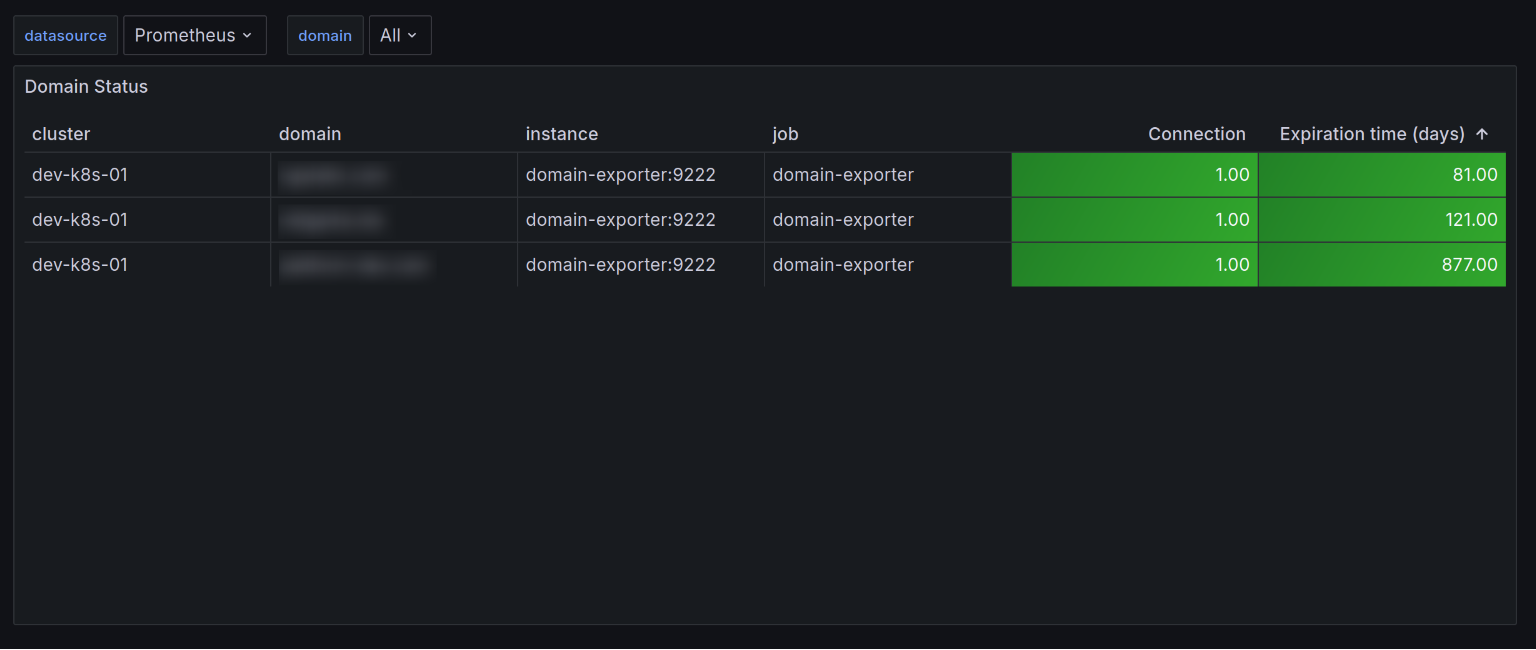
The Domain Expiration Overview dashboard uses the prometheus data source to create a Grafana dashboard with the table panel.
Data source config
Collector type:
Collector plugins:
Collector config:
Revisions
Upload an updated version of an exported dashboard.json file from Grafana
| Revision | Description | Created | |
|---|---|---|---|
| Download |